Methodology

Jackfruit Products Market Forecast and Outlook 2025 to 2035

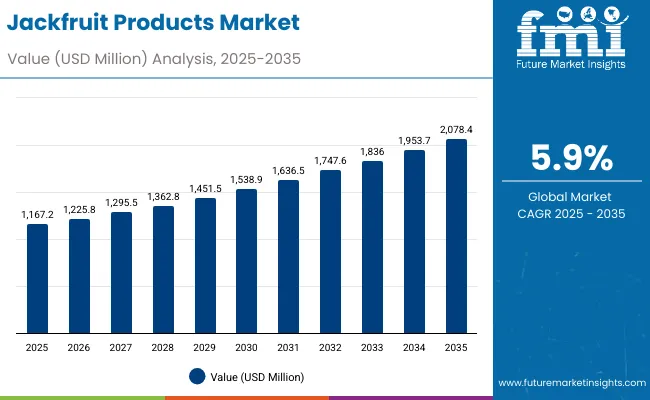
The jackfruit products market is projected to reach USD 2,078.4 million by 2035, recording an absolute increase of USD 911.2 million over the forecast period. The market is valued at USD 1,167.2 million in 2025 and is set to rise at a CAGR of 5.9% during the assessment period. Growth is driven by rising demand for plant-based meat alternatives, increasing adoption of functional food ingredients, and expanding awareness of sustainable protein sources. Jackfruit products are increasingly mandated in food processing formulations as part of clean-label ingredient strategies to prevent synthetic additives, reduce environmental impact, and address consumer health liabilities.

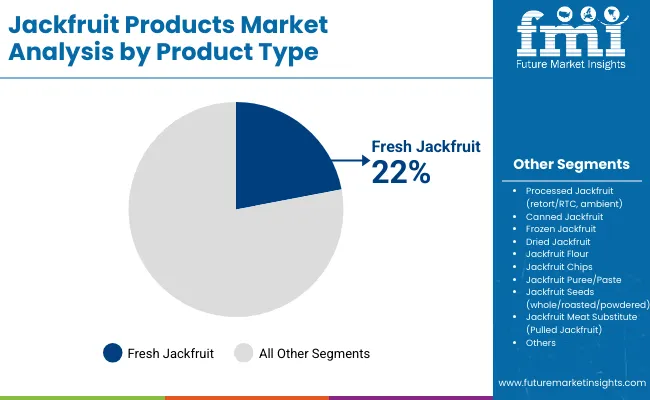
Fresh jackfruit holds a 22% share in 2025, favored in direct consumption environments for their natural nutritional profiles and culinary versatility. Jackfruit meat substitutes represent 15% and remain essential in plant-based food manufacturing, restaurant applications, and processed food systems where texture replication and protein enhancement are priorities. Canned variants at 14% are accelerating fastest as facilities seek both shelf stability and convenient preparation profiles in mixed-application environments.
Quick Stats for Jackfruit Products Market

  • Jackfruit Products Market Value (2025): USD 1,167.2 million
  • Jackfruit Products Market Forecast Value (2035): USD 2,078.4 million
  • Jackfruit Products Market Forecast CAGR: 5.9%
  • Leading Product Type in Jackfruit Products Market: Fresh Jackfruit
  • Key Growth Regions in Jackfruit Products Market: Europe, South Asia & Pacific, and East Asia
  • Top Players in Jackfruit Products Market: The Jackfruit Company, Upton's Naturals, Nature's Charm, Veggie Champ, Nirvana Foods

Jackfruit Products Market

Jackfruit Products Market Key Takeaways

Metric Value
Market Value (2025) USD 1,167.2 million
Market Forecast Value (2035) USD 2,078.4 million
Forecast CAGR (2025 to 2035) 5.9%

Jackfruit Products Market Year-over-Year Forecast (2025-2035)

Food processing industry applications remain the dominant end use at 18%, reflecting the need for functional ingredients in manufacturing operations, ready meal production, and commercial food systems. Household/retail applications at 18% expand as consumers adopt plant-based alternatives and specialty ingredients become more accessible. Europe leads growth, with Germany at 6.5% and India at 6.6% CAGR, supported by plant-based food innovation and traditional cultivation expertise. USA, UK, and China prioritize quality standards compliance and processing reliability. Competitive advantage is consolidating around supply chain management, processing innovation, preservation technologies, and multi-application product development rather than ingredient sourcing alone.

Jackfruit products encompass diverse processed forms derived from Artocarpus heterophyllus, ranging from traditional preservation methods to innovative plant-based protein applications. Fresh jackfruit commands significant market presence through direct consumption channels, while processed variants including canned, frozen, dried, and flour-based products serve specialized food industry applications. Processing technologies transform raw jackfruit into functional ingredients for bakery applications, meat substitutes, and nutritional supplements through controlled dehydration, fermentation, and mechanical processing techniques.

Manufacturing processes require sophisticated handling systems to manage jackfruit's unique compositional characteristics, including high water content, natural latex presence, and enzymatic browning susceptibility. Fresh processing facilities implement rapid cooling systems and modified atmosphere packaging to extend shelf life while maintaining nutritional integrity. Dehydration operations utilize controlled temperature and humidity parameters to produce shelf-stable products with concentrated nutritional profiles suitable for flour production and snack applications.

Plant-based meat alternative production leverages jackfruit's fibrous texture properties through mechanical shredding and seasoning processes that replicate traditional meat products. Young green jackfruit provides optimal texture characteristics for pulled meat applications, while ripe fruit variants serve dessert and confectionery applications. Processing standardization ensures consistent texture, flavor profiles, and nutritional composition across different product categories.

Between 2025 and 2030, the jackfruit products market is projected to expand from USD 1,167.2 million to USD 1,538.9 million, resulting in a value increase of USD 371.7 million, which represents 40.8% of the total forecast growth for the decade. This phase of development will be shaped by rising demand for plant-based protein alternatives and functional food ingredients, product innovation in processing technologies and preservation systems, as well as expanding integration with food service applications and ready meal manufacturing. Companies are establishing competitive positions through investment in processing capabilities, advanced preservation technologies, and strategic market expansion across food service, retail, and industrial applications.

From 2030 to 2035, the market is forecast to grow from USD 1,538.9 million to USD 2,078.4 million, adding another USD 539.5 million, which constitutes 59.2% of the overall ten-year expansion. This period is expected to be characterized by the expansion of specialized plant-based applications, including advanced meat substitute formulations and next-generation functional food products tailored for specific dietary requirements, strategic collaborations between jackfruit processors and food companies, and an enhanced focus on organic certification standards and automated processing protocols. The growing emphasis on sustainable protein sources and functional food applications will drive demand for comprehensive jackfruit product solutions across diverse food processing applications.

Why is the Jackfruit Products Market Growing?

The jackfruit products market grows by enabling food manufacturers and restaurant operators to optimize product formulations while accessing specialized tropical fruit ingredients without substantial in-house processing infrastructure investment. Manufacturing companies and food service operators face mounting pressure to develop advanced plant-based protein alternatives and functional food products while managing complex dietary requirements, with high-quality jackfruit products typically providing performance enhancement compared to conventional alternatives, making processed jackfruit variants essential for competitive market positioning.

The food industry's need for sustainable protein sources and application-specific nutritional capabilities creates demand for comprehensive jackfruit product solutions that can provide superior texture characteristics, maintain consistent quality standards, and ensure reliable operation without compromising product quality or operational effectiveness.

Government initiatives promoting sustainable agriculture and plant-based nutrition drive adoption in food manufacturing, restaurant operations, and retail applications, where ingredient quality has a direct impact on product performance and consumer acceptance. However, supply complexity constraints during large-scale processing projects and the expertise requirements for tropical fruit handling may limit accessibility among smaller manufacturing companies and developing regions with limited technical infrastructure for advanced food processing systems.

Segmental Analysis

The market is segmented by product type, end use, nature, sales channel, form, and region. By product type, the market includes fresh jackfruit, processed jackfruit, canned jackfruit, frozen jackfruit, dried jackfruit, jackfruit flour, jackfruit chips, jackfruit puree/paste, jackfruit seeds, and jackfruit meat substitute. Based on end use, the market is categorized into food processing industry, ready meals, plant-based meat alternatives, bakery & confectionery, snacks, sauces & spreads, household/retail, and foodservice.

By nature, the market is divided into organic and conventional. By sales channel, the market encompasses B2C and B2B channels. By form, the market includes whole, sliced/cubed, powdered, flaked/shredded, pulped/pureed, and flour. Regionally, the market is divided into North America, Latin America, Europe, East Asia, South Asia & Pacific, Middle East & Africa.
By Product Type, the Fresh Jackfruit Segment Accounts for a Dominant Market Share

Jackfruit Products Market By Product

The fresh jackfruit segment represents the dominant force in the jackfruit products market, capturing approximately 22.0% of total market share in 2025. This established product category encompasses solutions featuring direct consumption applications and specialized culinary preparations, including high-performance nutritional characteristics and enhanced flavor profiles that enable superior culinary experiences and operational outcomes across all food service applications. The fresh jackfruit segment's market leadership stems from its proven versatility capabilities, with products capable of addressing diverse culinary requirements while maintaining consistent quality standards and processing effectiveness across all preparation environments.

The jackfruit meat substitute segment maintains a substantial 15% market share, serving specialized plant-based applications that require protein-rich alternatives with specific texture properties for meat replacement formulations. The canned jackfruit segment accounts for 14% market share, while frozen jackfruit captures 12% through preservation applications requiring extended shelf life characteristics.

Key product type advantages driving the fresh jackfruit segment include:

  • Advanced nutritional properties with integrated fiber content that enhances dietary value and ensures consistent health characteristics
  • Established culinary processes allowing streamlined preparation workflows across different applications without extensive processing requirements
  • Enhanced versatility capabilities enabling diverse cooking formats while maintaining ingredient integrity and flavor reliability
  • Superior market acceptance providing optimal preparation performance for various food service applications

By End Use, the Food Processing Industry Segment Accounts for the Largest Market Share

Jackfruit Products Market By End Use

Food processing industry applications dominate the jackfruit products market with approximately 18% market share in 2025, reflecting the critical role of processed tropical fruits in supporting specialized manufacturing formulations and operational performance worldwide. The food processing industry segment's market leadership is reinforced by increasing plant-based product development trends, functional food complexity requirements, and rising needs for specialized ingredient capabilities in manufacturing operations across developed and emerging markets.

The household/retail segment represents an equally significant application category, capturing 18% market share through direct consumer purchases, home cooking applications, and individual consumption purposes. The plant-based meat alternatives segment accounts for 16% market share, serving specialized protein substitute formulations and meat replacement applications across various consumer sectors.

Key market dynamics supporting application growth include:

  • Food processing industry expansion driven by plant-based product development and functional food complexity, requiring specialized tropical fruit ingredients in emerging manufacturing markets
  • Retail modernization trends require flexible, integrated ingredient systems for competitive differentiation and product innovation development
  • Integration of advanced processing technologies enabling enhanced formulation capabilities and automated production systems
  • Growing emphasis on sustainable protein sources driving demand for specialized, validated ingredient solutions without traditional processing limitations

What are the Drivers, Restraints, and Key Trends of the Jackfruit Products Market?

The market is driven by three concrete demand factors tied to food industry outcomes. First, plant-based protein development and functional food ingredient solutions create increasing demand for high-quality jackfruit product systems, with performance enhancement annually in major food processing applications worldwide, requiring comprehensive manufacturing infrastructure.

Second, government initiatives promoting sustainable agriculture and plant-based nutrition drive increased adoption of specialized jackfruit compounds, with many countries implementing dietary guidelines and regulatory frameworks for functional food advancement by 2030. Third, technological advancements in tropical fruit processing and preservation applications enable more efficient and effective manufacturing solutions that improve product performance while reducing operational costs and processing complexity.

Market restraints include complex processing requirements and validation costs for specialized jackfruit processing platforms that can challenge market participants in developing compliant manufacturing capabilities, particularly in regions where regulatory pathways for tropical fruit processing technologies remain evolving and uncertain.

Technical complexity of specialized preservation systems and quality requirements pose another significant challenge, as jackfruit processing demands sophisticated handling methods and nutritional controls, potentially affecting production costs and operational efficiency. Supply variability constraints from tropical cultivation regions across different countries create additional operational challenges for manufacturers, demanding ongoing investment in supply chain development and sourcing assurance programs.

Key trends indicate accelerated adoption in European markets, particularly Germany and France, where plant-based food development and health awareness drive comprehensive jackfruit product adoption. Technology integration trends toward specialized processing systems with enhanced preservation characteristics, advanced meat substitute applications, and integrated manufacturing solutions enable effective production approaches that optimize processing efficiency and minimize quality risks. However, the market thesis could face disruption if significant advances in alternative plant-based protein sources or major changes in food processing technologies reduce reliance on traditional jackfruit applications.
Analysis of the Jackfruit Products Market by Key Country

Jackfruit Products Market By Country

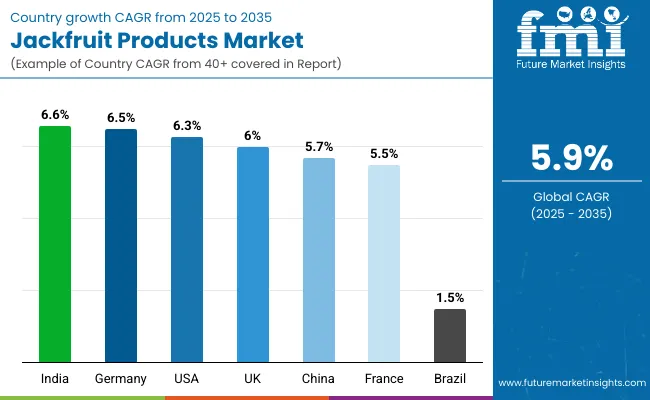
Countries CAGR (%)
India 6.6
Germany 6.5
China 5.7
USA 6.3
UK 6.0
France 5.5
Brazil 1.5

The global jackfruit products market is expanding steadily, with India leading at a 6.6% CAGR through 2035, driven by plant-based food development, government health initiatives, and advanced food processing platforms. USA follows at 6.3%, supported by meat alternative innovation and health consciousness initiatives. UK records 6%, reflecting an established landscape with growing integration in plant-based food manufacturing. China advances at 5.7%, leveraging traditional food applications and processing modernization. France posts 5.5%, focusing on culinary innovation, while Brazil grows at 1.5%, emphasizing traditional fruit processing applications.

India Leads Global Market Expansion

India demonstrates the strongest growth potential in the jackfruit products market with a CAGR of 6.6% through 2035. The country's leadership position stems from traditional cultivation expertise, government-backed agricultural initiatives, and comprehensive food processing regulations driving the adoption of advanced jackfruit product solutions. Growth is concentrated in major food processing and agricultural centers, including Kerala, Karnataka, Tamil Nadu, and West Bengal, where food companies and processing facilities are implementing advanced jackfruit processing systems for enhanced production capabilities and export performance.

Distribution channels through agricultural cooperatives and processing networks expand deployment across cultivation projects and value-added manufacturing initiatives. The country's Ministry of Food Processing Industries provides policy support for tropical fruit processing technology modernization, including comprehensive cultivation and processing capability development. Traditional jackfruit cultivation in Kerala and Karnataka regions provides established supply chain infrastructure, while processing facilities in major industrial zones implement value-addition technologies for domestic and export markets.

Key market factors:

  • Agricultural sector expansion concentrated in tropical cultivation regions and processing districts with comprehensive production development programs
  • Government support through agricultural subsidies and food processing infrastructure incentives
  • Comprehensive processing technology ecosystem, including established cultivation networks with proven capabilities
  • Technology integration featuring advanced preservation platforms, export systems, and production optimization technologies

Germany Emerges as European Leader

Germany demonstrates exceptional growth potential with a CAGR of 6.5% through 2035, driven by plant-based food innovation and advanced food processing capabilities. Major food processing and manufacturing centers including Bavaria, Baden-Württemberg, North Rhine-Westphalia, and Lower Saxony showcase comprehensive jackfruit product adoption across manufacturing projects and food industry development initiatives. The market demonstrates strong growth momentum linked to comprehensive food industry modernization and increasing focus on sustainable protein solutions.

German companies are implementing advanced jackfruit processing systems and manufacturing platforms to enhance production performance while meeting growing demand in expanding plant-based food and meat alternative manufacturing sectors. The country's food industry development initiatives create continued demand for tropical fruit ingredients, while increasing emphasis on nutrition innovation drives adoption of advanced processing systems. European Union food safety regulations provide standardized frameworks for tropical fruit processing, while German quality standards ensure premium product development for domestic and international markets.

Key development areas:
  • Food processing facilities and manufacturing centers leading jackfruit product adoption with comprehensive production programs
  • Innovation services channels providing integrated solutions with 90% quality compliance rates
  • Technology partnerships between processing companies and food manufacturing enterprises are expanding market reach
  • Integration of advanced food processing platforms and comprehensive manufacturing systems

USA Shows Innovation Leadership

Jackfruit Products Market Usa

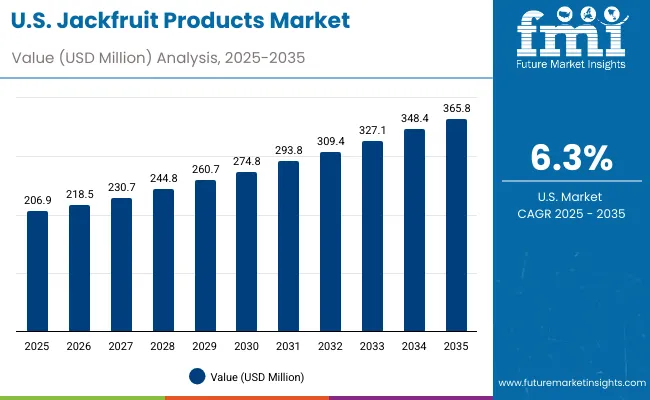
USA's market expansion is driven by diverse plant-based food demand, including meat alternative development in major cities and comprehensive food processing projects across multiple regions. The country demonstrates strong growth potential with a CAGR of 6.3% through 2035, supported by federal nutrition programs and industry-level plant-based food development initiatives. American companies face implementation challenges related to tropical fruit supply complexity and scaling requirements, requiring strategic development approaches and support from specialized jackfruit processing partners.

However, growing health-conscious demands and advanced food processing requirements create compelling business cases for jackfruit product adoption, particularly in meat alternative areas where innovative plant-based ingredients have a direct impact on operational success and competitive positioning. California, Texas, Florida, and New York lead adoption through advanced food processing facilities and innovation centers focusing on plant-based protein development.

Market characteristics:

  • Plant-based food and meat alternative segments showing robust growth with significant annual increase in jackfruit product utilization
  • Regional expansion trends focused on food processing areas in major innovation and manufacturing regions
  • Future projections indicate the need for advanced processing infrastructure and tropical fruit specialist training programs
  • Growing emphasis on food innovation and processing competitiveness in manufacturing operations

China Demonstrates Processing Capabilities

The China market shows strong growth potential with a CAGR of 5.7% through 2035, driven by traditional fruit processing expertise and modern food industry expansion. Major food processing centers in Beijing, Shanghai, Guangzhou, and Shenzhen implement comprehensive jackfruit processing solutions across manufacturing facilities and export-oriented production systems. Chinese companies are adopting intelligent processing systems for quality improvement and efficiency enhancement, particularly in regions with established fruit processing infrastructure and applications demanding comprehensive technology upgrades.

Traditional tropical fruit cultivation in southern provinces provides supply chain advantages, while modern processing facilities in industrial zones implement advanced preservation and value-addition technologies. Export market development focuses on processed jackfruit products serving international food manufacturers and specialty food distributors across Asia-Pacific and European markets.

Leading market segments:

  • Traditional food processing modernization projects in major manufacturing centers are implementing comprehensive jackfruit processing upgrades
  • Strategic collaborations between processing companies and food manufacturing operations are expanding market presence
  • Focus on traditional applications and specialized food industry requirements

UK Emphasizes Quality Standards

In London, Manchester, Birmingham, and other major cities, food processing facilities are implementing comprehensive jackfruit product solutions to modernize existing manufacturing infrastructure and improve processing capabilities. The market shows strong growth potential with a CAGR of 6% through 2035, linked to the ongoing modernization of food processing facilities, distribution networks, and emerging plant-based food projects in major regions.

British companies are adopting intelligent jackfruit processing platforms to enhance manufacturing reliability while maintaining standards demanded by the food service and retail industries. The country's established food safety infrastructure creates continued demand for tropical fruit processing development and modernization solutions that integrate with existing food processing systems. Brexit regulations provide opportunities for independent trade partnerships with tropical fruit producing nations, while quality standards ensure premium product positioning in European markets.

Market development factors:

  • Food processing facilities and distribution networks leading jackfruit product initiatives across the UK
  • Technology programs providing government funding support for food processing and manufacturing infrastructure upgrades
  • Strategic partnerships between British food companies and international processing providers are expanding technical capabilities
  • Emphasis on food processing excellence and plant-based applications across production projects

France Shows Culinary Innovation Leadership

France's jackfruit products market demonstrates advanced implementation focused on culinary excellence and food manufacturing performance optimization, with documented integration of specialized tropical fruit systems, achieving improvement in product innovation across food processing and restaurant facilities. The country maintains steady growth momentum with a CAGR of 5.5% through 2035, driven by food processing facilities' emphasis on culinary excellence and continuous innovation methodologies that align with French food industry standards applied to jackfruit product operations.

Major culinary and processing areas, including Île-de-France, Rhône-Alpes, Provence-Alpes-Côte d'Azur, and Occitanie, showcase advanced deployment of jackfruit processing platforms where ingredient systems integrate seamlessly with existing culinary infrastructure and comprehensive quality management programs. French culinary traditions provide established frameworks for tropical fruit integration, while modern processing facilities implement advanced preservation and preparation technologies for restaurant and retail applications.

Key market characteristics:

  • Culinary facilities and food processing centers are driving advanced jackfruit product requirements with emphasis on quality and innovation optimization
  • Culinary collaboration between French companies and international processing providers is expanding market capabilities
  • Emphasis on culinary requirements and continuous innovation methodologies

Brazil Shows Traditional Applications

Brazil's jackfruit products market demonstrates established traditional landscape with a CAGR of 1.5% through 2035, characterized by mature domestic consumption patterns and regional processing infrastructure. The country's slower growth reflects established market saturation and traditional consumption preferences focused on fresh fruit applications rather than processed variants. Major cultivation regions including Bahia, Ceará, and Pará maintain traditional production systems serving domestic markets through established distribution channels.

Processing facilities focus on regional applications and export opportunities to neighboring South American markets, while modern food industry development remains limited compared to developed markets. Traditional cultivation practices provide stable supply chain infrastructure, though modernization investments remain constrained by market demand patterns and infrastructure limitations across rural processing regions.
Europe Market Split by Country

Jackfruit Products Market Europe

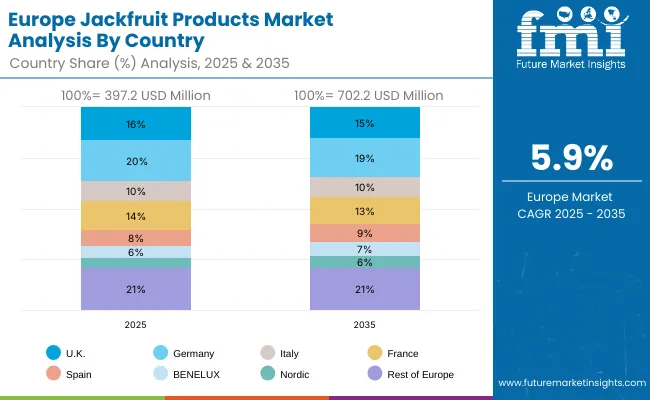
The jackfruit products market in Europe is projected to grow from USD 397.2 million in 2025 to USD 702.2 million by 2035, registering a CAGR of 5.9% over the forecast period. Germany is expected to maintain its leadership position with a 20% market share in 2025, projected to reach 19% by 2035, supported by its extensive food processing infrastructure, advanced manufacturing facilities, and comprehensive distribution networks serving major European markets.

United Kingdom follows with a 16.0% share in 2025, projected to reach 15% by 2035, driven by comprehensive plant-based food programs in major food processing regions implementing advanced jackfruit processing systems. France holds a 14% share in 2025, expected to reach 13% by 2035 through the ongoing development of food processing facilities and culinary networks. Italy commands a 10% share, maintaining 10% through traditional food applications, while Spain accounts for 8% in 2025, expected to reach 9% by 2035.

BENELUX captures 6% market share, projected to reach 7.0%, while Nordic countries account for 5%, expected to reach 6% by 2035. The Rest of Europe region maintains a 21% share throughout the forecast period, attributed to increasing jackfruit product adoption in Eastern European food processing facilities implementing manufacturing programs.
Competitive Landscape of the Jackfruit Products Market

Jackfruit Products Market By Company

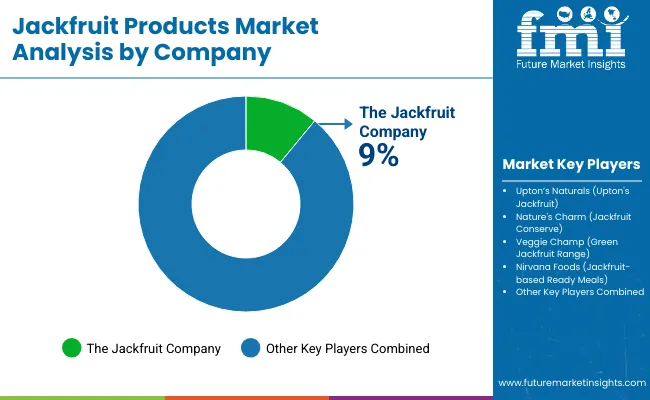
The jackfruit products market features approximately 10-15 meaningful players with moderate concentration, where the top three companies control roughly 25-35% of global market share through established processing portfolios and extensive food industry relationships. Competition centers on product quality, processing innovation, and supply chain reliability rather than price competition alone.

Market leaders include The Jackfruit Company, Upton's Naturals, and Nature's Charm, which maintain competitive advantages through comprehensive jackfruit product portfolios, advanced processing capabilities, and deep expertise in the plant-based food and specialty food sectors, creating high switching costs for customers. These companies leverage established food industry relationships and ongoing development partnerships to defend market positions while expanding into adjacent meat alternative and functional food applications.

Challengers encompass Veggie Champ and Nirvana Foods, which compete through specialized processing technologies and strong brand presence in key consumer markets. Processing specialists focus on specific jackfruit applications or vertical markets, offering differentiated capabilities in food processing systems, meat alternative applications, and application-specific formulations.

Regional players and emerging jackfruit processing companies create competitive pressure through innovative processing approaches and rapid development capabilities, particularly in high-growth markets including India and Germany, where local presence provides advantages in supply chain optimization and regulatory compliance. Market dynamics favor companies that combine advanced processing technologies with comprehensive food industry services that address the complete product lifecycle from cultivation through ongoing performance assurance and technical support.

Key Players in the Jackfruit Products Market

  • The Jackfruit Company
  • Upton's Naturals
  • Nature's Charm
  • Veggie Champ
  • Nirvana Foods

Scope of the Report

Items Values
Quantitative Units (2025) USD 1,167.2 Million
Product Type Fresh Jackfruit, Processed Jackfruit, Canned Jackfruit, Frozen Jackfruit, Dried Jackfruit, Jackfruit Flour, Jackfruit Chips, Jackfruit Puree/Paste, Jackfruit Seeds, Jackfruit Meat Substitute
End Use Food Processing Industry, Ready Meals, Plant-based Meat Alternatives, Bakery & Confectionery, Snacks, Sauces & Spreads, Household/Retail, Foodservice
Nature Organic, Conventional
Sales Channel B2C, B2B
Form Whole, Sliced/Cubed, Powdered, Flaked/Shredded, Pulped/Pureed, Flour
Regions Covered North America, Latin America, Europe, East Asia, South Asia & Pacific, Middle East & Africa
Countries Covered China, India, Germany, France, UK, USA, Brazil, South Korea, Japan, and 40+ countries
Key Companies Profiled The Jackfruit Company, Upton's Naturals, Nature's Charm, Veggie Champ, Nirvana Foods
Additional Attributes Dollar sales by product type and end use categories, regional adoption trends across Europe, South Asia & Pacific, and East Asia, competitive landscape with jackfruit product providers and food companies, processing facility requirements and specifications, integration with food service initiatives and retail platforms .

Jackfruit Products Market by Segments

By Product Type:

  • Fresh Jackfruit
  • Processed Jackfruit (retort/RTC, ambient)
  • Canned Jackfruit
  • Frozen Jackfruit
  • Dried Jackfruit
  • Jackfruit Flour
  • Jackfruit Chips
  • Jackfruit Puree/Paste
  • Jackfruit Seeds (whole, roasted, powdered)
  • Jackfruit Meat Substitute (Pulled Jackfruit)

By End Use:

  • Food Processing Industry
  • Ready Meals
  • Plant-based Meat Alternatives
  • Bakery & Confectionery
  • Snacks
  • Sauces & Spreads
  • Household/Retail
  • Foodservice (Restaurants, Cafés, QSRs)

By Nature:

  • Organic
  • Conventional

By Sales Channel:

  • B2C
  • Supermarkets/Hypermarkets
  • Specialty Stores
  • Online Retail
  • B2B
  • HoReCa
  • Ingredient Suppliers
  • Industrial/Contract Manufacturers

By Form:

  • Whole
  • Sliced/Cubed
  • Powdered
  • Flaked/Shredded
  • Pulped/Pureed
  • Flour

By Region:

  • North America
    • United States
    • Canada
    • Mexico
  • Latin America
    • Brazil
    • Argentina
    • Rest of Latin America
  • Europe
    • Germany
    • United Kingdom
    • France
    • Italy
    • Spain
    • Nordic
    • BENELUX
    • Rest of Europe
  • East Asia
    • China
    • Japan
    • South Korea
    • Rest of East Asia
  • South Asia & Pacific
    • India
    • Australia & New Zealand
    • ASEAN
    • Rest of South Asia & Pacific
  • Middle East & Africa
    • Kingdom of Saudi Arabia
    • Other GCC Countries
    • Turkey
    • South Africa
    • Other African Union
    • Rest of Middle East & Africa

Frequently Asked Questions

What is the size of the jackfruit products market in 2025?

The jackfruit products market is valued at USD 1,167.2 million in 2025.

What is the expected size of the jackfruit products market by 2035?

The market is projected to reach USD 2,078.4 million by 2035, adding an absolute USD 911.2 million over the forecast period.

What is the growth rate (CAGR) of the jackfruit products market from 2025 to 2035?

The market is forecast to grow at a CAGR of 5.9% between 2025 and 2035.

Which jackfruit product type currently holds the largest share?

Fresh jackfruit is the leading product type, accounting for 22.0% of the market in 2025, followed by jackfruit meat substitutes (15.0%) and canned jackfruit (14.0%).

Which end-use segment accounts for the largest demand for jackfruit products?

The food processing industry is the dominant end-use segment with around 18.0% share, closely followed by household/retail applications at 18.0%, driven by plant-based adoption in home cooking and packaged foods.

Table of Content

  1. Executive Summary
    • Global Market Outlook
    • Demand Side Trends
    • Supply Side Trends
    • Technology Roadmap Analysis
    • Analysis and Recommendations
  2. Market Overview
    • Market Coverage / Taxonomy
    • Market Definition / Scope / Limitations
  3. Market Background
    • Market Dynamics
      • Drivers
      • Restraints
      • Opportunity
      • Trends
    • Scenario Forecast
      • Demand in Optimistic Scenario
      • Demand in Likely Scenario
      • Demand in Conservative Scenario
    • Opportunity Map Analysis
    • Product Life Cycle Analysis
    • Supply Chain Analysis
    • Investment Feasibility Matrix
    • Value Chain Analysis
    • PESTLE and Porter's Analysis
    • Regulatory Landscape
    • Regional Parent Market Outlook
    • Production and Consumption Statistics
    • Import and Export Statistics
  4. Global Market Analysis 2020 to 2024 and Forecast, 2025 to 2035
    • Historical Market Size Value (USD Million) Analysis, 2020 to 2024
    • Current and Future Market Size Value (USD Million) Projections, 2025 to 2035
      • Y-o-Y Growth Trend Analysis
      • Absolute $ Opportunity Analysis
  5. Global Market Pricing Analysis 2020 to 2024 and Forecast 2025 to 2035
  6. Global Market Analysis 2020 to 2024 and Forecast 2025 to 2035, By Product Type
    • Introduction / Key Findings
    • Historical Market Size Value (USD Million) Analysis By Product Type, 2020 to 2024
    • Current and Future Market Size Value (USD Million) Analysis and Forecast By Product Type, 2025 to 2035
      • Fresh Jackfruit
      • Processed Jackfruit
      • Canned Jackfruit
      • Frozen Jackfruit
      • Dried Jackfruit
      • Jackfruit Flour
      • Jackfruit Chips
      • Jackfruit Puree/Paste
      • Jackfruit Seeds
      • Jackfruit Meat Substitute
    • Y-o-Y Growth Trend Analysis By Product Type, 2020 to 2024
    • Absolute $ Opportunity Analysis By Product Type, 2025 to 2035
  7. Global Market Analysis 2020 to 2024 and Forecast 2025 to 2035, By End Use
    • Introduction / Key Findings
    • Historical Market Size Value (USD Million) Analysis By End Use, 2020 to 2024
    • Current and Future Market Size Value (USD Million) Analysis and Forecast By End Use, 2025 to 2035
      • Food Processing Industry
      • Ready Meals
      • Plant-based Meat Alternatives
      • Bakery & Confectionery
      • Snacks
      • Sauces & Spreads
      • Household/Retail
      • Foodservice
    • Y-o-Y Growth Trend Analysis By End Use, 2020 to 2024
    • Absolute $ Opportunity Analysis By End Use, 2025 to 2035
  8. Global Market Analysis 2020 to 2024 and Forecast 2025 to 2035, By Nature
    • Introduction / Key Findings
    • Historical Market Size Value (USD Million) Analysis By Nature, 2020 to 2024
    • Current and Future Market Size Value (USD Million) Analysis and Forecast By Nature, 2025 to 2035
      • Organic
      • Conventional
    • Y-o-Y Growth Trend Analysis By Nature, 2020 to 2024
    • Absolute $ Opportunity Analysis By Nature, 2025 to 2035
  9. Global Market Analysis 2020 to 2024 and Forecast 2025 to 2035, By Sales Channel
    • Introduction / Key Findings
    • Historical Market Size Value (USD Million) Analysis By Sales Channel, 2020 to 2024
    • Current and Future Market Size Value (USD Million) Analysis and Forecast By Sales Channel, 2025 to 2035
      • B2C
        • Supermarkets/Hypermarkets
        • Specialty Stores
        • Online Retail
      • B2B
        • HoReCa
        • Ingredient Suppliers
        • Industrial/Contract Manufacturers
    • Y-o-Y Growth Trend Analysis By Sales Channel, 2020 to 2024
    • Absolute $ Opportunity Analysis By Sales Channel, 2025 to 2035
  10. Global Market Analysis 2020 to 2024 and Forecast 2025 to 2035, By Form
    • Introduction / Key Findings
    • Historical Market Size Value (USD Million) Analysis By Form, 2020 to 2024
    • Current and Future Market Size Value (USD Million) Analysis and Forecast By Form, 2025 to 2035
      • Whole
      • Sliced/Cubed
      • Powdered
      • Flaked/Shredded
      • Pulped/Pureed
      • Flour
    • Y-o-Y Growth Trend Analysis By Form, 2020 to 2024
    • Absolute $ Opportunity Analysis By Form, 2025 to 2035
  11. Global Market Analysis 2020 to 2024 and Forecast 2025 to 2035, By Region
    • Introduction
    • Historical Market Size Value (USD Million) Analysis By Region, 2020 to 2024
    • Current Market Size Value (USD Million) Analysis and Forecast By Region, 2025 to 2035
      • North America
      • Latin America
      • Europe
      • East Asia
      • South Asia & Pacific
      • Middle East & Africa
    • Market Attractiveness Analysis By Region
  12. North America Market Analysis 2020 to 2024 and Forecast 2025 to 2035, By Country
    • Historical Market Size Value (USD Million) Trend Analysis By Market Taxonomy, 2020 to 2024
    • Market Size Value (USD Million) Forecast By Market Taxonomy, 2025 to 2035
      • By Country
        • United States
        • Canada
        • Mexico
      • By Product Type
      • By End Use
      • By Nature
      • By Sales Channel
      • By Form
    • Market Attractiveness Analysis
      • By Country
      • By Product Type
      • By End Use
      • By Nature
      • By Sales Channel
      • By Form
    • Key Takeaways
  13. Latin America Market Analysis 2020 to 2024 and Forecast 2025 to 2035, By Country
    • Historical Market Size Value (USD Million) Trend Analysis By Market Taxonomy, 2020 to 2024
    • Market Size Value (USD Million) Forecast By Market Taxonomy, 2025 to 2035
      • By Country
        • Brazil
        • Argentina
        • Rest of Latin America
      • By Product Type
      • By End Use
      • By Nature
      • By Sales Channel
      • By Form
    • Market Attractiveness Analysis
      • By Country
      • By Product Type
      • By End Use
      • By Nature
      • By Sales Channel
      • By Form
    • Key Takeaways
  14. Europe Market Analysis 2020 to 2024 and Forecast 2025 to 2035, By Country
    • Historical Market Size Value (USD Million) Trend Analysis By Market Taxonomy, 2020 to 2024
    • Market Size Value (USD Million) Forecast By Market Taxonomy, 2025 to 2035
      • By Country
        • Germany
        • United Kingdom
        • France
        • Italy
        • Spain
        • Nordic
        • BENELUX
        • Rest of Europe
      • By Product Type
      • By End Use
      • By Nature
      • By Sales Channel
      • By Form
    • Market Attractiveness Analysis
      • By Country
      • By Product Type
      • By End Use
      • By Nature
      • By Sales Channel
      • By Form
    • Key Takeaways
  15. East Asia Market Analysis 2020 to 2024 and Forecast 2025 to 2035, By Country
    • Historical Market Size Value (USD Million) Trend Analysis By Market Taxonomy, 2020 to 2024
    • Market Size Value (USD Million) Forecast By Market Taxonomy, 2025 to 2035
      • By Country
        • China
        • Japan
        • South Korea
        • Rest of East Asia
      • By Product Type
      • By End Use
      • By Nature
      • By Sales Channel
      • By Form
    • Market Attractiveness Analysis
      • By Country
      • By Product Type
      • By End Use
      • By Nature
      • By Sales Channel
      • By Form
    • Key Takeaways
  16. South Asia & Pacific Market Analysis 2020 to 2024 and Forecast 2025 to 2035, By Country
    • Historical Market Size Value (USD Million) Trend Analysis By Market Taxonomy, 2020 to 2024
    • Market Size Value (USD Million) Forecast By Market Taxonomy, 2025 to 2035
      • By Country
        • India
        • Australia & New Zealand
        • ASEAN
        • Rest of South Asia & Pacific
      • By Product Type
      • By End Use
      • By Nature
      • By Sales Channel
      • By Form
    • Market Attractiveness Analysis
      • By Country
      • By Product Type
      • By End Use
      • By Nature
      • By Sales Channel
      • By Form
    • Key Takeaways
  17. Middle East & Africa Market Analysis 2020 to 2024 and Forecast 2025 to 2035, By Country
    • Historical Market Size Value (USD Million) Trend Analysis By Market Taxonomy, 2020 to 2024
    • Market Size Value (USD Million) Forecast By Market Taxonomy, 2025 to 2035
      • By Country
        • Kingdom of Saudi Arabia
        • Other GCC Countries
        • Turkey
        • South Africa
        • Other African Union
        • Rest of Middle East & Africa
      • By Product Type
      • By End Use
      • By Nature
      • By Sales Channel
      • By Form
    • Market Attractiveness Analysis
      • By Country
      • By Product Type
      • By End Use
      • By Nature
      • By Sales Channel
      • By Form
    • Key Takeaways
  18. Key Countries Market Analysis
    • United States
      • Pricing Analysis
      • Market Share Analysis, 2024
        • By Product Type
        • By End Use
        • By Nature
        • By Sales Channel
        • By Form
    • Canada
      • Pricing Analysis
      • Market Share Analysis, 2024
        • By Product Type
        • By End Use
        • By Nature
        • By Sales Channel
        • By Form
    • Mexico
      • Pricing Analysis
      • Market Share Analysis, 2024
        • By Product Type
        • By End Use
        • By Nature
        • By Sales Channel
        • By Form
    • Brazil
      • Pricing Analysis
      • Market Share Analysis, 2024
        • By Product Type
        • By End Use
        • By Nature
        • By Sales Channel
        • By Form
    • Argentina
      • Pricing Analysis
      • Market Share Analysis, 2024
        • By Product Type
        • By End Use
        • By Nature
        • By Sales Channel
        • By Form
    • Germany
      • Pricing Analysis
      • Market Share Analysis, 2024
        • By Product Type
        • By End Use
        • By Nature
        • By Sales Channel
        • By Form
    • United Kingdom
      • Pricing Analysis
      • Market Share Analysis, 2024
        • By Product Type
        • By End Use
        • By Nature
        • By Sales Channel
        • By Form
    • France
      • Pricing Analysis
      • Market Share Analysis, 2024
        • By Product Type
        • By End Use
        • By Nature
        • By Sales Channel
        • By Form
    • Italy
      • Pricing Analysis
      • Market Share Analysis, 2024
        • By Product Type
        • By End Use
        • By Nature
        • By Sales Channel
        • By Form
    • Spain
      • Pricing Analysis
      • Market Share Analysis, 2024
        • By Product Type
        • By End Use
        • By Nature
        • By Sales Channel
        • By Form
    • China
      • Pricing Analysis
      • Market Share Analysis, 2024
        • By Product Type
        • By End Use
        • By Nature
        • By Sales Channel
        • By Form
    • Japan
      • Pricing Analysis
      • Market Share Analysis, 2024
        • By Product Type
        • By End Use
        • By Nature
        • By Sales Channel
        • By Form
    • South Korea
      • Pricing Analysis
      • Market Share Analysis, 2024
        • By Product Type
        • By End Use
        • By Nature
        • By Sales Channel
        • By Form
    • India
      • Pricing Analysis
      • Market Share Analysis, 2024
        • By Product Type
        • By End Use
        • By Nature
        • By Sales Channel
        • By Form
    • Australia & New Zealand
      • Pricing Analysis
      • Market Share Analysis, 2024
        • By Product Type
        • By End Use
        • By Nature
        • By Sales Channel
        • By Form
    • ASEAN
      • Pricing Analysis
      • Market Share Analysis, 2024
        • By Product Type
        • By End Use
        • By Nature
        • By Sales Channel
        • By Form
    • Kingdom of Saudi Arabia
      • Pricing Analysis
      • Market Share Analysis, 2024
        • By Product Type
        • By End Use
        • By Nature
        • By Sales Channel
        • By Form
    • Turkey
      • Pricing Analysis
      • Market Share Analysis, 2024
        • By Product Type
        • By End Use
        • By Nature
        • By Sales Channel
        • By Form
    • South Africa
      • Pricing Analysis
      • Market Share Analysis, 2024
        • By Product Type
        • By End Use
        • By Nature
        • By Sales Channel
        • By Form
  19. Market Structure Analysis
    • Competition Dashboard
    • Competition Benchmarking
    • Market Share Analysis of Top Players
      • By Regional
      • By Product Type
      • By End Use
      • By Nature
      • By Sales Channel
      • By Form
  20. Competition Analysis
    • Competition Deep Dive
      • The Jackfruit Company
        • Overview
        • Product Portfolio
        • Profitability by Market Segments (Product/Age/Sales Channel/Region)
        • Sales Footprint
        • Strategy Overview
        • Marketing Strategy
        • Product Strategy
        • Channel Strategy
      • Upton's Naturals
      • Nature's Charm
      • Veggie Champ
      • Nirvana Foods
  21. Assumptions & Acronyms Used
  22. Research Methodology

List of Tables

  • Table 1: Global Market Value (USD Million) Forecast by Region, 2020 to 2035
  • Table 2: Global Market Value (USD Million) Forecast by Product Type, 2020 to 2035
  • Table 3: Global Market Value (USD Million) Forecast by End Use, 2020 to 2035
  • Table 4: Global Market Value (USD Million) Forecast by Nature, 2020 to 2035
  • Table 5: Global Market Value (USD Million) Forecast by Sales Channel, 2020 to 2035
  • Table 6: Global Market Value (USD Million) Forecast by Form, 2020 to 2035
  • Table 7: North America Market Value (USD Million) Forecast by Country, 2020 to 2035
  • Table 8: North America Market Value (USD Million) Forecast by Product Type, 2020 to 2035
  • Table 9: North America Market Value (USD Million) Forecast by End Use, 2020 to 2035
  • Table 10: North America Market Value (USD Million) Forecast by Nature, 2020 to 2035
  • Table 11: North America Market Value (USD Million) Forecast by Sales Channel, 2020 to 2035
  • Table 12: North America Market Value (USD Million) Forecast by Form, 2020 to 2035
  • Table 13: Latin America Market Value (USD Million) Forecast by Country, 2020 to 2035
  • Table 14: Latin America Market Value (USD Million) Forecast by Product Type, 2020 to 2035
  • Table 15: Latin America Market Value (USD Million) Forecast by End Use, 2020 to 2035
  • Table 16: Latin America Market Value (USD Million) Forecast by Nature, 2020 to 2035
  • Table 17: Latin America Market Value (USD Million) Forecast by Sales Channel, 2020 to 2035
  • Table 18: Latin America Market Value (USD Million) Forecast by Form, 2020 to 2035
  • Table 19: Europe Market Value (USD Million) Forecast by Country, 2020 to 2035
  • Table 20: Europe Market Value (USD Million) Forecast by Product Type, 2020 to 2035
  • Table 21: Europe Market Value (USD Million) Forecast by End Use, 2020 to 2035
  • Table 22: Europe Market Value (USD Million) Forecast by Nature, 2020 to 2035
  • Table 23: Europe Market Value (USD Million) Forecast by Sales Channel, 2020 to 2035
  • Table 24: Europe Market Value (USD Million) Forecast by Form, 2020 to 2035
  • Table 25: East Asia Market Value (USD Million) Forecast by Country, 2020 to 2035
  • Table 26: East Asia Market Value (USD Million) Forecast by Product Type, 2020 to 2035
  • Table 27: East Asia Market Value (USD Million) Forecast by End Use, 2020 to 2035
  • Table 28: East Asia Market Value (USD Million) Forecast by Nature, 2020 to 2035
  • Table 29: East Asia Market Value (USD Million) Forecast by Sales Channel, 2020 to 2035
  • Table 30: East Asia Market Value (USD Million) Forecast by Form, 2020 to 2035
  • Table 31: South Asia & Pacific Market Value (USD Million) Forecast by Country, 2020 to 2035
  • Table 32: South Asia & Pacific Market Value (USD Million) Forecast by Product Type, 2020 to 2035
  • Table 33: South Asia & Pacific Market Value (USD Million) Forecast by End Use, 2020 to 2035
  • Table 34: South Asia & Pacific Market Value (USD Million) Forecast by Nature, 2020 to 2035
  • Table 35: South Asia & Pacific Market Value (USD Million) Forecast by Sales Channel, 2020 to 2035
  • Table 36: South Asia & Pacific Market Value (USD Million) Forecast by Form, 2020 to 2035
  • Table 37: Middle East & Africa Market Value (USD Million) Forecast by Country, 2020 to 2035
  • Table 38: Middle East & Africa Market Value (USD Million) Forecast by Product Type, 2020 to 2035
  • Table 39: Middle East & Africa Market Value (USD Million) Forecast by End Use, 2020 to 2035
  • Table 40: Middle East & Africa Market Value (USD Million) Forecast by Nature, 2020 to 2035
  • Table 41: Middle East & Africa Market Value (USD Million) Forecast by Sales Channel, 2020 to 2035
  • Table 42: Middle East & Africa Market Value (USD Million) Forecast by Form, 2020 to 2035

List of Figures

  • Figure 1: Global Market Pricing Analysis
  • Figure 2: Global Market Value (USD Million) Forecast 2020-2035
  • Figure 3: Global Market Value Share and BPS Analysis by Product Type, 2025 and 2035
  • Figure 4: Global Market Y-o-Y Growth Comparison by Product Type, 2025-2035
  • Figure 5: Global Market Attractiveness Analysis by Product Type
  • Figure 6: Global Market Value Share and BPS Analysis by End Use, 2025 and 2035
  • Figure 7: Global Market Y-o-Y Growth Comparison by End Use, 2025-2035
  • Figure 8: Global Market Attractiveness Analysis by End Use
  • Figure 9: Global Market Value Share and BPS Analysis by Nature, 2025 and 2035
  • Figure 10: Global Market Y-o-Y Growth Comparison by Nature, 2025-2035
  • Figure 11: Global Market Attractiveness Analysis by Nature
  • Figure 12: Global Market Value Share and BPS Analysis by Sales Channel, 2025 and 2035
  • Figure 13: Global Market Y-o-Y Growth Comparison by Sales Channel, 2025-2035
  • Figure 14: Global Market Attractiveness Analysis by Sales Channel
  • Figure 15: Global Market Value Share and BPS Analysis by Form, 2025 and 2035
  • Figure 16: Global Market Y-o-Y Growth Comparison by Form, 2025-2035
  • Figure 17: Global Market Attractiveness Analysis by Form
  • Figure 18: Global Market Value Share and BPS Analysis by Region, 2025 and 2035
  • Figure 19: Global Market Y-o-Y Growth Comparison by Region, 2025-2035
  • Figure 20: Global Market Attractiveness Analysis by Region
  • Figure 21: North America Market Incremental Dollar Opportunity, 2025-2035
  • Figure 22: Latin America Market Incremental Dollar Opportunity, 2025-2035
  • Figure 23: Europe Market Incremental Dollar Opportunity, 2025-2035
  • Figure 24: East Asia Market Incremental Dollar Opportunity, 2025-2035
  • Figure 25: South Asia & Pacific Market Incremental Dollar Opportunity, 2025-2035
  • Figure 26: Middle East & Africa Market Incremental Dollar Opportunity, 2025-2035
  • Figure 27: North America Market Value Share and BPS Analysis by Country, 2025 and 2035
  • Figure 28: North America Market Value Share and BPS Analysis by Product Type, 2025 and 2035
  • Figure 29: North America Market Y-o-Y Growth Comparison by Product Type, 2025-2035
  • Figure 30: North America Market Attractiveness Analysis by Product Type
  • Figure 31: North America Market Value Share and BPS Analysis by End Use, 2025 and 2035
  • Figure 32: North America Market Y-o-Y Growth Comparison by End Use, 2025-2035
  • Figure 33: North America Market Attractiveness Analysis by End Use
  • Figure 34: North America Market Value Share and BPS Analysis by Nature, 2025 and 2035
  • Figure 35: North America Market Y-o-Y Growth Comparison by Nature, 2025-2035
  • Figure 36: North America Market Attractiveness Analysis by Nature
  • Figure 37: North America Market Value Share and BPS Analysis by Sales Channel, 2025 and 2035
  • Figure 38: North America Market Y-o-Y Growth Comparison by Sales Channel, 2025-2035
  • Figure 39: North America Market Attractiveness Analysis by Sales Channel
  • Figure 40: North America Market Value Share and BPS Analysis by Form, 2025 and 2035
  • Figure 41: North America Market Y-o-Y Growth Comparison by Form, 2025-2035
  • Figure 42: North America Market Attractiveness Analysis by Form
  • Figure 43: Latin America Market Value Share and BPS Analysis by Country, 2025 and 2035
  • Figure 44: Latin America Market Value Share and BPS Analysis by Product Type, 2025 and 2035
  • Figure 45: Latin America Market Y-o-Y Growth Comparison by Product Type, 2025-2035
  • Figure 46: Latin America Market Attractiveness Analysis by Product Type
  • Figure 47: Latin America Market Value Share and BPS Analysis by End Use, 2025 and 2035
  • Figure 48: Latin America Market Y-o-Y Growth Comparison by End Use, 2025-2035
  • Figure 49: Latin America Market Attractiveness Analysis by End Use
  • Figure 50: Latin America Market Value Share and BPS Analysis by Nature, 2025 and 2035
  • Figure 51: Latin America Market Y-o-Y Growth Comparison by Nature, 2025-2035
  • Figure 52: Latin America Market Attractiveness Analysis by Nature
  • Figure 53: Latin America Market Value Share and BPS Analysis by Sales Channel, 2025 and 2035
  • Figure 54: Latin America Market Y-o-Y Growth Comparison by Sales Channel, 2025-2035
  • Figure 55: Latin America Market Attractiveness Analysis by Sales Channel
  • Figure 56: Latin America Market Value Share and BPS Analysis by Form, 2025 and 2035
  • Figure 57: Latin America Market Y-o-Y Growth Comparison by Form, 2025-2035
  • Figure 58: Latin America Market Attractiveness Analysis by Form
  • Figure 59: Europe Market Value Share and BPS Analysis by Country, 2025 and 2035
  • Figure 60: Europe Market Value Share and BPS Analysis by Product Type, 2025 and 2035
  • Figure 61: Europe Market Y-o-Y Growth Comparison by Product Type, 2025-2035
  • Figure 62: Europe Market Attractiveness Analysis by Product Type
  • Figure 63: Europe Market Value Share and BPS Analysis by End Use, 2025 and 2035
  • Figure 64: Europe Market Y-o-Y Growth Comparison by End Use, 2025-2035
  • Figure 65: Europe Market Attractiveness Analysis by End Use
  • Figure 66: Europe Market Value Share and BPS Analysis by Nature, 2025 and 2035
  • Figure 67: Europe Market Y-o-Y Growth Comparison by Nature, 2025-2035
  • Figure 68: Europe Market Attractiveness Analysis by Nature
  • Figure 69: Europe Market Value Share and BPS Analysis by Sales Channel, 2025 and 2035
  • Figure 70: Europe Market Y-o-Y Growth Comparison by Sales Channel, 2025-2035
  • Figure 71: Europe Market Attractiveness Analysis by Sales Channel
  • Figure 72: Europe Market Value Share and BPS Analysis by Form, 2025 and 2035
  • Figure 73: Europe Market Y-o-Y Growth Comparison by Form, 2025-2035
  • Figure 74: Europe Market Attractiveness Analysis by Form
  • Figure 75: East Asia Market Value Share and BPS Analysis by Country, 2025 and 2035
  • Figure 76: East Asia Market Value Share and BPS Analysis by Product Type, 2025 and 2035
  • Figure 77: East Asia Market Y-o-Y Growth Comparison by Product Type, 2025-2035
  • Figure 78: East Asia Market Attractiveness Analysis by Product Type
  • Figure 79: East Asia Market Value Share and BPS Analysis by End Use, 2025 and 2035
  • Figure 80: East Asia Market Y-o-Y Growth Comparison by End Use, 2025-2035
  • Figure 81: East Asia Market Attractiveness Analysis by End Use
  • Figure 82: East Asia Market Value Share and BPS Analysis by Nature, 2025 and 2035
  • Figure 83: East Asia Market Y-o-Y Growth Comparison by Nature, 2025-2035
  • Figure 84: East Asia Market Attractiveness Analysis by Nature
  • Figure 85: East Asia Market Value Share and BPS Analysis by Sales Channel, 2025 and 2035
  • Figure 86: East Asia Market Y-o-Y Growth Comparison by Sales Channel, 2025-2035
  • Figure 87: East Asia Market Attractiveness Analysis by Sales Channel
  • Figure 88: East Asia Market Value Share and BPS Analysis by Form, 2025 and 2035
  • Figure 89: East Asia Market Y-o-Y Growth Comparison by Form, 2025-2035
  • Figure 90: East Asia Market Attractiveness Analysis by Form
  • Figure 91: South Asia & Pacific Market Value Share and BPS Analysis by Country, 2025 and 2035
  • Figure 92: South Asia & Pacific Market Value Share and BPS Analysis by Product Type, 2025 and 2035
  • Figure 93: South Asia & Pacific Market Y-o-Y Growth Comparison by Product Type, 2025-2035
  • Figure 94: South Asia & Pacific Market Attractiveness Analysis by Product Type
  • Figure 95: South Asia & Pacific Market Value Share and BPS Analysis by End Use, 2025 and 2035
  • Figure 96: South Asia & Pacific Market Y-o-Y Growth Comparison by End Use, 2025-2035
  • Figure 97: South Asia & Pacific Market Attractiveness Analysis by End Use
  • Figure 98: South Asia & Pacific Market Value Share and BPS Analysis by Nature, 2025 and 2035
  • Figure 99: South Asia & Pacific Market Y-o-Y Growth Comparison by Nature, 2025-2035
  • Figure 100: South Asia & Pacific Market Attractiveness Analysis by Nature
  • Figure 101: South Asia & Pacific Market Value Share and BPS Analysis by Sales Channel, 2025 and 2035
  • Figure 102: South Asia & Pacific Market Y-o-Y Growth Comparison by Sales Channel, 2025-2035
  • Figure 103: South Asia & Pacific Market Attractiveness Analysis by Sales Channel
  • Figure 104: South Asia & Pacific Market Value Share and BPS Analysis by Form, 2025 and 2035
  • Figure 105: South Asia & Pacific Market Y-o-Y Growth Comparison by Form, 2025-2035
  • Figure 106: South Asia & Pacific Market Attractiveness Analysis by Form
  • Figure 107: Middle East & Africa Market Value Share and BPS Analysis by Country, 2025 and 2035
  • Figure 108: Middle East & Africa Market Value Share and BPS Analysis by Product Type, 2025 and 2035
  • Figure 109: Middle East & Africa Market Y-o-Y Growth Comparison by Product Type, 2025-2035
  • Figure 110: Middle East & Africa Market Attractiveness Analysis by Product Type
  • Figure 111: Middle East & Africa Market Value Share and BPS Analysis by End Use, 2025 and 2035
  • Figure 112: Middle East & Africa Market Y-o-Y Growth Comparison by End Use, 2025-2035
  • Figure 113: Middle East & Africa Market Attractiveness Analysis by End Use
  • Figure 114: Middle East & Africa Market Value Share and BPS Analysis by Nature, 2025 and 2035
  • Figure 115: Middle East & Africa Market Y-o-Y Growth Comparison by Nature, 2025-2035
  • Figure 116: Middle East & Africa Market Attractiveness Analysis by Nature
  • Figure 117: Middle East & Africa Market Value Share and BPS Analysis by Sales Channel, 2025 and 2035
  • Figure 118: Middle East & Africa Market Y-o-Y Growth Comparison by Sales Channel, 2025-2035
  • Figure 119: Middle East & Africa Market Attractiveness Analysis by Sales Channel
  • Figure 120: Middle East & Africa Market Value Share and BPS Analysis by Form, 2025 and 2035
  • Figure 121: Middle East & Africa Market Y-o-Y Growth Comparison by Form, 2025-2035
  • Figure 122: Middle East & Africa Market Attractiveness Analysis by Form
  • Figure 123: Global Market - Tier Structure Analysis
  • Figure 124: Global Market - Company Share Analysis
Dashboard
Dashboard
Dashboard
Dashboard
Dashboard
Dashboard

Our Research Products

Full Research Suite

The "Full Research Suite" delivers actionable market intel, deep dives on markets or technologies, so clients act faster, cut risk, and unlock growth.

Competitor Leaderboard Report

The Leaderboard benchmarks and ranks top vendors, classifying them as Established Leaders, Leading Challengers, or Disruptors & Challengers.

Future Leaders Index

Locates where complements amplify value and substitutes erode it, forecasting net impact by horizon

Market Data & Forecasts

We deliver granular, decision-grade intel: market sizing, 5-year forecasts, pricing, adoption, usage, revenue, and operational KPIs—plus competitor tracking, regulation, and value chains—across 60 countries broadly.

Market Focus Report

Spot the shifts before they hit your P&L. We track inflection points, adoption curves, pricing moves, and ecosystem plays to show where demand is heading, why it is changing, and what to do next across high-growth markets and disruptive tech

Survey Report

Real-time reads of user behavior. We track shifting priorities, perceptions of today’s and next-gen services, and provider experience, then pace how fast tech moves from trial to adoption, blending buyer, consumer, and channel inputs with social signals (#WhySwitch, #UX).

Bespoke Reports

Partner with our analyst team to build a custom report designed around your business priorities. From analysing market trends to assessing competitors or crafting bespoke datasets, we tailor insights to your needs.

Supplier Intelligence

Discovery & Profiling

Capacity & Footprint

Performance & Risk

Compliance & Governance

Commercial Readiness

Who Supplies Whom

Scorecards & Shortlists

Playbooks & Docs

Category Intelligence

Definition & Scope

Demand & Use Cases

Cost Drivers

Market Structure

Supply Chain Map

Trade & Policy

Operating Norms

Deliverables

Buyer Intelligence

Account Basics

Spend & Scope

Procurement Model

Vendor Requirements

Terms & Policies

Entry Strategy

Pain Points & Triggers

Outputs

Pricing Analysis

Benchmarks

Trends

Should-Cost

Indexation

Landed Cost

Commercial Terms

Deliverables

Brand Analysis

Positioning & Value Prop

Share & Presence

Customer Evidence

Go-to-Market

Digital & Reputation

Compliance & Trust

KPIs & Gaps

Outputs

Full Research Suite comprises of:

Market outlook & trends analysis

Market outlook & trends analysis

Interviews & case studies

Interviews & case studies

Strategic recommendations

Strategic recommendations

Vendor profiles & capabilities analysis

Vendor profiles & capabilities analysis

5-year forecasts

5-year forecasts

8 regions and 60+ country-level data splits

8 regions and 60+ country-level data splits

Market segment data splits

Market segment data splits

12 months of continuous data updates

12 months of continuous data updates

DELIVERED AS:

PDF EXCEL ONLINE

Full Research Suite


$3500

$5000

$6500

Buy Report Now
Similar Industry Reports

Similar Industry Reports

Products from Food Waste Industry Analysis in Korea

Products from Food Waste Industry Analysis in Korea Size, Share and Forecast Outlook 2025 to 2035

Products from Food Waste Industry Analysis in Japan

Products from Food Waste in Japan - Size, Share, and Forecast Outlook 2025 to 2035

Products from Food Waste Market

Products from Food Waste Market Analysis - Size, Growth, and Forecast 2025 to 2035

USA Products from Food Waste Market

USA Products from Food Waste Market Growth – Trends, Demand & Outlook 2025-2035

Teff Products Market

Teff Products Market

Detox Products Market

Detox Products Market Analysis - Size, Share, and Forecast Outlook 2025 to 2035

Algae Products Market

Algae Products Market Analysis - Size, Share, and Forecast Outlook 2025 to 2035

Pulse Products Market

Pulse Products Market Analysis - Size, Share, and Forecast Outlook 2025 to 2035

Dairy Products Market

Dairy Products Market Analysis by Product Type, End Use, Distribution Channel and Region through 2035

Vacuum Products for Emergency Services Market

Vacuum Products for Emergency Services Market Size and Share Forecast Outlook 2025 to 2035

Almond Products Market

Almond Products Market Size and Share Forecast Outlook 2025 to 2035

Bamboo Products Market

Bamboo Products Market Analysis – Trends & Growth 2025 to 2035

Luxury Products for Kids Market

Luxury Products For Kids Market - Trends, Growth & Forecast 2025 to 2035

Chicory Products Market

Chicory Products Market Size and Share Forecast Outlook 2025 to 2035

Crystal Products Market

Crystal Products Market Size and Share Forecast Outlook 2025 to 2035

Make-Up Products Packaging Market

Make-Up Products Packaging Market Size and Share Forecast Outlook 2025 to 2035

Suncare Products Market

Suncare Products Market Size and Share Forecast Outlook 2025 to 2035

Ziplock Products Market

Ziplock Products Market Size and Share Forecast Outlook 2025 to 2035

Moringa Products Market

Global Moringa Products Market Outlook – Trends, Demand & Forecast 2025–2035

Corn Co-Products Market

Corn Co-Products Market

Future Market Insights

Jackfruit Products Market

Chat With MaRIA

Chat With

MaRIA

Hi There, I am MaRIA, Your Market Research Intelligence Assistant. How may I help you?