The global biological indicator vial market is valued at USD 142.5 billion in 2025 and is slated to reach USD 319.2 billion by 2035, recording an absolute increase of USD 176.2 billion over the forecast period. This translates into a total growth of 123.6%, with the market forecast to expand at a CAGR of 8.4% between 2025 and 2035. The overall market size is expected to grow by nearly 2.24X during the same period, supported by increasing demand for sterilization validation in healthcare facilities, growing pharmaceutical manufacturing activities requiring sterility assurance, and rising regulatory compliance requirements across medical device production and laboratory operations.
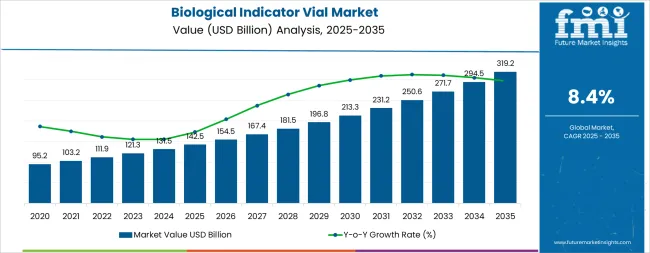
Between 2025 and 2030, the biological indicator vial market is projected to expand from USD 142.5 billion to USD 212.8 billion, resulting in a value increase of USD 70.3 billion, which represents 39.9% of the total forecast growth for the decade. This phase of development will be shaped by increasing healthcare infrastructure expansion in emerging markets, rising adoption of advanced sterilization monitoring technologies, and growing demand for rapid-readout biological indicators in high-throughput sterilization facilities. Healthcare providers and pharmaceutical manufacturers are expanding their sterilization validation capabilities to address the growing demand for infection prevention solutions and quality assurance in sterile product manufacturing.
| Metric | Value |
|---|---|
| Estimated Value in (2025E) | USD 142.5 billion |
| Forecast Value in (2035F) | USD 319.2 billion |
| Forecast CAGR (2025 to 2035) | 8.4% |
The biological indicator vial market is primarily divided between Original Equipment Manufacturers (OEMs) and the aftermarket sector. OEMs dominate the market, accounting for approximately 70% of the share. This dominance is driven by established partnerships with pharmaceutical and healthcare equipment manufacturers, ensuring a steady demand for biological indicator vials during the production of sterilization equipment. The aftermarket segment, comprising about 30% of the market, caters to consumers seeking replacement vials, upgrades, and customization options for their existing sterilization systems. This sector's growth is fueled by the increasing need for sterilization validation and compliance with stringent regulatory standards.
Recent trends in the biological indicator vial market indicate a shift towards enhanced sterility assurance. Manufacturers are focusing on developing vials with improved resistance to sterilization processes and incorporating eco-friendly materials to meet environmental regulations. Advancements in packaging technologies, such as tamper-evident and contamination-resistant designs, are gaining traction to ensure the integrity of the biological indicators.
Market expansion is being supported by the increasing global demand for sterility assurance in healthcare settings and the corresponding need for reliable sterilization validation tools that can demonstrate the complete elimination of viable microorganisms across various sterilization modalities. Modern healthcare facilities and pharmaceutical manufacturers are increasingly focused on implementing quality control solutions that can provide definitive proof of sterilization efficacy, minimize infection risks, and ensure regulatory compliance across critical sterilization processes. Biological indicator vials' proven ability to deliver microbiological challenge testing, regulatory compliance documentation, and quality assurance validation make them essential tools for contemporary infection prevention and sterile manufacturing operations.
The growing emphasis on patient safety and medical device quality assurance is driving demand for biological indicators that can support routine sterilization monitoring, periodic validation studies, and compliance with international standards for sterilization processes. Healthcare providers' preference for monitoring solutions that combine microbiological accuracy with operational convenience and rapid result turnaround is creating opportunities for innovative biological indicator implementations. The rising influence of regulatory enforcement and quality management system requirements is also contributing to increased adoption of biological indicators that can provide traceable documentation and scientific evidence of sterilization effectiveness.
The biological indicator vial market is poised for rapid growth and transformation. As healthcare facilities, pharmaceutical manufacturers, and medical device producers across both developed and emerging markets seek to ensure sterilization efficacy, prevent contamination, and maintain regulatory compliance, biological indicators are gaining prominence not just as quality control tools but as strategic components of comprehensive infection prevention and quality assurance programs.
Rising healthcare expenditure and pharmaceutical manufacturing expansion in Asia-Pacific, Latin America, and Africa amplify demand, while manufacturers are advancing innovations in rapid-readout technologies and digital monitoring integration. Pathways like rapid detection systems, specialized indicator development, and automated monitoring promise strong margin uplift, especially in mature markets. Geographic expansion and localized manufacturing will capture volume, particularly where healthcare infrastructure is expanding and regulatory enforcement is strengthening.
The market is segmented by product type, end use, sterilization method, and region. By product type, the market is divided into self-contained biological indicators, biological indicator strips, and biological indicator suspensions. By organism type, it covers Geobacillus stearothermophilus, Bacillus atrophaeus, and others. By sterilization method, it is segmented into steam sterilization, ethylene oxide sterilization, hydrogen peroxide sterilization, and dry heat sterilization. Based on end use, the market is categorized into hospitals & healthcare facilities, pharmaceutical & biotechnology companies, medical device manufacturers, and research laboratories. By distribution channel, the market includes direct sales, distributors & wholesalers, and online channels. Regionally, the market is divided into North America, Europe, East Asia, South Asia & Pacific, Latin America, and the Middle East & Africa.
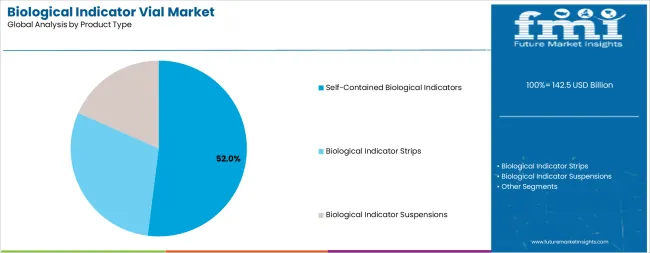
The self-contained biological indicators segment is projected to account for 52.0% of the biological indicator vial market in 2025, reaffirming its position as the leading product category. Healthcare facilities and sterilization service providers increasingly utilize self-contained biological indicators for their superior convenience, integrated culture media systems, and elimination of transfer steps that can introduce contamination risks during post-sterilization incubation. Self-contained biological indicator technology's advanced design capabilities and user-friendly operation directly address the operational requirements for streamlined sterilization validation and reduced handling complexity in high-volume processing environments.
This product segment forms the foundation of modern sterilization monitoring programs, as it represents the indicator format with the greatest ease of use and established market acceptance across multiple healthcare settings and sterilization applications. Facility investments in automated incubator systems and digital monitoring platforms continue to strengthen adoption among healthcare providers seeking enhanced workflow efficiency. With healthcare organizations prioritizing infection prevention and regulatory compliance, self-contained biological indicators align with both operational efficiency objectives and quality assurance requirements, making them the central component of comprehensive sterilization validation strategies.
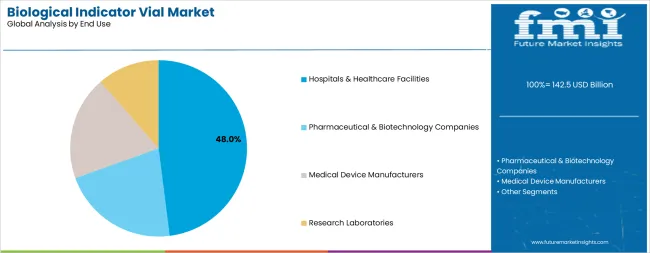
Hospitals and healthcare facilities are projected to represent 48.0% of biological indicator vial demand in 2025, underscoring their critical role as the primary consumers of sterilization validation products for surgical instrument processing, medical device reprocessing, and infection prevention programs. Healthcare institutions prefer biological indicators for their scientific reliability, regulatory acceptance, and ability to provide definitive proof of sterilization efficacy while supporting quality management system requirements. Positioned as essential quality control tools for patient safety protection, biological indicators offer both microbiological validation and compliance documentation benefits.
The segment is supported by continuous advancement in sterile processing department operations and the growing availability of rapid-readout biological indicator systems that enable same-day validation results for critical instrument loads.
The biological indicator vial market is advancing rapidly due to increasing regulatory requirements for sterilization validation and growing adoption of biological monitoring systems that provide scientific evidence of sterilization process efficacy across diverse healthcare and pharmaceutical applications. The market faces challenges, including cost pressures in resource-constrained healthcare settings, extended incubation times for traditional biological indicators limiting same-day sterilization release, and the need for temperature-controlled storage infrastructure for viable spore maintenance. Innovation in rapid-readout technologies and digital monitoring integration continues to influence product development and market expansion patterns.
The growing adoption of rapid-readout biological indicator systems is enabling healthcare facilities and sterilization service providers to obtain validation results in significantly reduced timeframes, with some systems delivering definitive results in under 3 hours compared to traditional 24-48 hour incubation periods. Advanced rapid-readout technologies provide improved operational efficiency while allowing faster instrument turnaround and enhanced surgical scheduling flexibility. Manufacturers are increasingly recognizing the competitive advantages of rapid-readout capabilities for market differentiation and premium product positioning in time-sensitive healthcare environments.
Modern biological indicator manufacturers are incorporating digital reader systems and cloud-based monitoring platforms to enhance result interpretation accuracy, eliminate manual documentation errors, and provide automated compliance tracking capabilities for quality management systems. These technologies improve validation workflow efficiency while enabling remote monitoring applications, centralized data management, and real-time alert notifications for sterilization process failures. Advanced digital integration also allows facilities to support electronic record-keeping requirements and comprehensive audit trail documentation beyond traditional paper-based monitoring approaches.
| Country | CAGR (2025-2035) |
|---|---|
| USA | 8.0% |
| China | 10.5% |
| India | 11.2% |
| Germany | 7.5% |
| Japan | 6.8% |
| Brazil | 9.3% |
| United Kingdom | 7.2% |
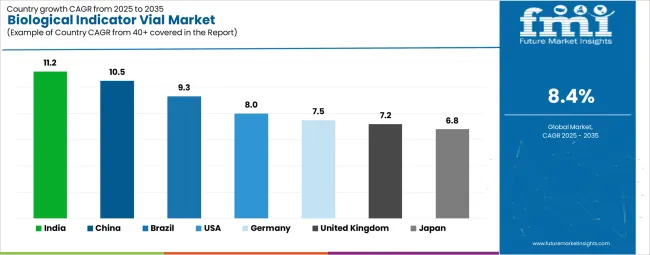
The biological indicator vial market is experiencing strong growth globally, with India leading at an 11.2% CAGR through 2035, driven by the rapidly expanding healthcare infrastructure, growing pharmaceutical manufacturing sector, and significant investment in hospital sterilization equipment modernization programs. China follows at 10.5%, supported by large-scale pharmaceutical production capacity, increasing medical device manufacturing activities, and strengthening regulatory enforcement of sterilization validation requirements. Brazil records 9.3%, focusing on healthcare infrastructure expansion and pharmaceutical industry growth. The USA shows growth at 8.0%, emphasizing technological innovation and regulatory compliance rigor. Germany demonstrates 7.5% growth, prioritizing advanced sterilization technologies and quality assurance systems. The United Kingdom exhibits 7.2% growth, supported by National Health Service sterilization standards and medical device regulation compliance. Japan shows 6.8% growth, driven by advanced healthcare facilities and pharmaceutical manufacturing excellence.
The report covers an in-depth analysis of 40+ countries, Top-performing countries are highlighted below.
The biological indicator vials market in India is projected to exhibit exceptional growth with a CAGR of 11.2% through 2035, driven by expanding hospital infrastructure and rapidly growing pharmaceutical manufacturing capabilities supported by government healthcare modernization initiatives and Make in India programs. The country's increasing focus on healthcare quality standards and rising investment in sterilization equipment are creating substantial demand for biological indicator validation solutions. Major hospital chains, pharmaceutical companies, and medical device manufacturers are establishing comprehensive sterilization monitoring programs to serve both domestic quality requirements and international export market compliance standards.
The biological indicator vials industry in China is expanding at a CAGR of 10.5%, supported by the country's massive pharmaceutical manufacturing capacity, advanced medical device production infrastructure, and increasing regulatory enforcement of sterilization validation requirements under updated Good Manufacturing Practice standards. The country's comprehensive healthcare system expansion and growing emphasis on infection prevention are driving demand for sophisticated biological indicator capabilities. International quality system providers and domestic manufacturers are establishing extensive production and distribution networks to address the growing demand for sterilization monitoring products across hospital systems and pharmaceutical facilities.
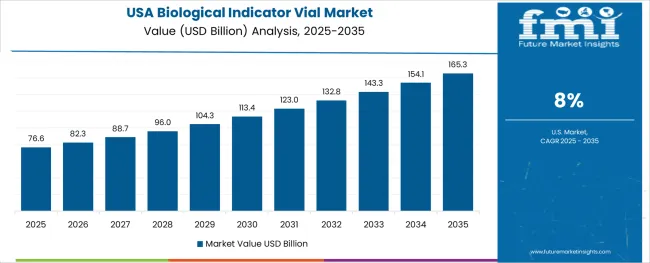
Demand for biological indicator vials in the USA is expanding at a CAGR of 8.0%, supported by the country's advanced healthcare infrastructure, stringent regulatory requirements enforced by the FDA and CDC, and robust demand for rapid-readout biological indicator systems among high-volume sterilization facilities. The nation's mature healthcare system and sophisticated pharmaceutical manufacturing sector are driving advanced biological indicator capabilities throughout hospital sterile processing departments and contract sterilization service providers. Leading manufacturers and technology innovators are investing extensively in rapid-readout system development and digital monitoring platform integration to serve both domestic healthcare facilities and international pharmaceutical manufacturing operations.
Revenue from biological indicator vials in Brazil is growing at a CAGR of 9.3%, driven by expanding hospital infrastructure development, increasing pharmaceutical manufacturing investment, and growing emphasis on healthcare quality standards implementation throughout public and private healthcare systems. The country's modernization of healthcare facilities and advancement of pharmaceutical production capabilities are supporting demand for biological indicator technologies across major urban centers and pharmaceutical manufacturing hubs. Healthcare providers and pharmaceutical manufacturers are establishing comprehensive sterilization validation programs to serve both domestic quality requirements and export market compliance standards.
The biological indicator vials sector in Germany is expanding at a CAGR of 7.5%, supported by the country's advanced healthcare system, emphasis on infection prevention excellence, and strong pharmaceutical manufacturing sector requiring rigorous sterilization validation compliance. Germany's mature hospital infrastructure and technological expertise in medical device production are supporting investment in sophisticated biological indicator capabilities throughout healthcare facilities and pharmaceutical production centers. Industry leaders are establishing comprehensive quality management systems incorporating advanced biological indicator technologies to serve both domestic healthcare facilities and international pharmaceutical manufacturing operations.
The biological indicator vials market in the United Kingdom is expanding at a CAGR of 7.2%, supported by National Health Service sterilization standards, comprehensive decontamination unit modernization programs, and strong pharmaceutical manufacturing sector requirements for sterility assurance validation. The country's established healthcare infrastructure and emphasis on infection prevention excellence are driving demand for biological indicator technologies across hospital sterile service departments and pharmaceutical production facilities. Leading healthcare trusts and pharmaceutical manufacturers are investing in advanced sterilization monitoring capabilities to ensure compliance with Health Technical Memorandum 01-01 standards and Medicines and Healthcare products Regulatory Agency requirements.
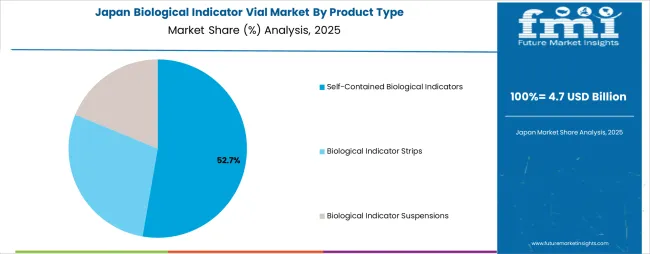
The biological indicator vials market in Japan is expanding at a CAGR of 6.8%, supported by the country's advanced healthcare infrastructure, rigorous sterilization standards, and sophisticated pharmaceutical manufacturing sector emphasizing quality control excellence. Japan's mature hospital system and emphasis on infection prevention are driving demand for premium biological indicator technologies including rapid-readout systems and automated monitoring platforms. Leading healthcare facilities and pharmaceutical manufacturers are investing in comprehensive sterilization validation capabilities to serve both domestic quality requirements and international export market compliance standards.
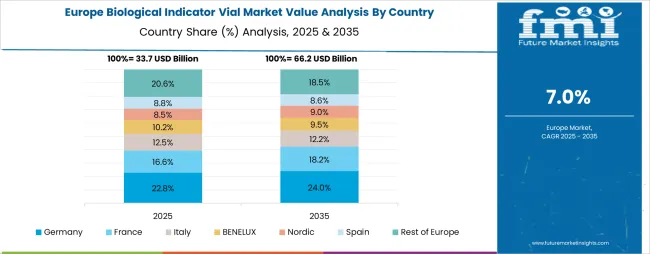
The biological indicator vial market in Europe is projected to grow from USD 31.8 billion in 2025 to USD 70.2 billion by 2035, registering a CAGR of 8.3% over the forecast period. Germany is expected to maintain its leadership position with a 29.0% market share in 2025, maintaining stability at 29.0% by 2035, supported by its advanced healthcare infrastructure, comprehensive pharmaceutical manufacturing sector, and rigorous sterilization validation requirements throughout hospital systems and production facilities.
France follows with a 19.0% share in 2025, projected to reach 19.2% by 2035, driven by robust demand for biological indicators in hospital sterilization departments, pharmaceutical manufacturing facilities, and medical device production operations, combined with comprehensive regulatory oversight from the French National Agency for Medicines and Health Products Safety. The United Kingdom holds a 17.0% share in 2025, expected to maintain 17.0% by 2035, supported by National Health Service sterilization standards and established pharmaceutical manufacturing infrastructure. Italy commands a 13.0% share in 2025, projected to reach 13.3% by 2035, while Spain accounts for 11.0% in 2025, expected to reach 11.2% by 2035. The Netherlands maintains a 3.5% share in 2025, growing to 3.7% by 2035. The Rest of Europe region, including Nordic countries, Eastern Europe, Switzerland, Belgium, Austria, and Portugal, is anticipated to gain momentum, expanding its collective share from 10.0% to 10.1% by 2035, attributed to healthcare infrastructure modernization in Eastern European markets and growing pharmaceutical manufacturing activities across Nordic countries implementing enhanced quality assurance programs.

The biological indicator vial market is characterized by competition among established sterilization monitoring specialists, medical device manufacturers, and pharmaceutical quality control solution providers. Companies are investing in rapid-readout technology research, digital monitoring platform development, spore production optimization, and comprehensive product portfolios to deliver reliable, user-friendly, and regulatory-compliant biological indicator solutions. Innovation in incubation systems, automated reading platforms, and specialized organism selection is central to strengthening market position and competitive advantage.
3M Company leads the market with a strong market share, offering comprehensive sterilization monitoring solutions with a focus on self-contained biological indicators and rapid-readout systems for healthcare applications. Mesa Labs provides specialized biological indicator products with an emphasis on pharmaceutical manufacturing validation and contract sterilization service support. Steris PLC delivers integrated sterilization and infection prevention solutions with a focus on healthcare facility support and equipment manufacturing. Getinge AB specializes in comprehensive sterilization equipment and biological indicator systems for hospital applications. Terragene SA focuses on biological indicator manufacturing with emphasis on Latin American markets and cost-effective validation solutions. Crosstex International offers specialized sterilization monitoring products with emphasis on dental and medical office applications.
| Items | Values |
|---|---|
| Quantitative Units (2025) | USD 142.5 billion |
| Product Type | Self-Contained Biological Indicators, Biological Indicator Strips, Biological Indicator Suspensions |
| Organism Type | Geobacillus stearothermophilus, Bacillus atrophaeus, Others |
| Sterilization Method | Steam Sterilization, Ethylene Oxide Sterilization, Hydrogen Peroxide Sterilization, Dry Heat Sterilization |
| End Use | Hospitals & Healthcare Facilities, Pharmaceutical & Biotechnology Companies, Medical Device Manufacturers, Research Laboratories |
| Distribution Channel | Direct Sales, Distributors & Wholesalers, Online Channels |
| Regions Covered | North America, Europe, East Asia, South Asia & Pacific, Latin America, Middle East & Africa |
| Countries Covered | United States, Canada, United Kingdom, Germany, France, China, Japan, South Korea, India, Brazil, Australia and 40+ countries |
| Key Companies Profiled | 3M Company, Mesa Labs, Steris PLC, Getinge AB, Terragene SA, and Crosstex International |
| Additional Attributes | Dollar sales by product type and end use category, regional demand trends, competitive landscape, technological advancements in rapid-readout systems, digital monitoring integration, organism optimization, and sterilization validation protocols |
The global biological indicator vial market is estimated to be valued at USD 142.5 billion in 2025.
The market size for the biological indicator vial market is projected to reach USD 319.2 billion by 2035.
The biological indicator vial market is expected to grow at a 8.4% CAGR between 2025 and 2035.
The key product types in biological indicator vial market are self-contained biological indicators, biological indicator strips and biological indicator suspensions.
In terms of end use, hospitals & healthcare facilities segment to command 48.0% share in the biological indicator vial market in 2025.


Full Research Suite comprises of:
Market outlook & trends analysis
Interviews & case studies
Strategic recommendations
Vendor profiles & capabilities analysis
5-year forecasts
8 regions and 60+ country-level data splits
Market segment data splits
12 months of continuous data updates
DELIVERED AS:
PDF EXCEL ONLINE
Breaking Down Market Share in Biological Indicator Vial Industry
Biological and Chemical Indicators Market Insights - Trends, Growth & Forecast 2025 to 2035
Microbiological Water Testing Services Market – Growth, Demand & Safety Trends
Cancer Biological Therapy Market Size and Share Forecast Outlook 2025 to 2035
Veterinary Biologicals Biobank Market
Real Time Continuous Microbiological Monitoring Systems Market
Flow Indicator Market Size and Share Forecast Outlook 2025 to 2035
Oxygen Indicator Labels Market Size and Share Forecast Outlook 2025 to 2035
Market Leaders & Share in Oxygen Indicator Labels Manufacturing
Grating Indicator Calibrator Market Size and Share Forecast Outlook 2025 to 2035
Chemical Indicator Inks Market Size and Share Forecast Outlook 2025 to 2035
Ripeness Indicator Labels Market Size and Share Forecast Outlook 2025 to 2035
Humidity Indicator Plugs Market
Freshness Indicator Label Market Size and Share Forecast Outlook 2025 to 2035
Colorimetric Indicator Labels Market Trends – Growth & Forecast 2024-2034
Rotation Speed Indicators Market Size and Share Forecast Outlook 2025 to 2035
Steam Chemical Indicator Market
Pharmaceutical Indicator Strips Market
Cable Line Fault Indicator Market Size and Share Forecast Outlook 2025 to 2035
Time Temperature Indicator Labels Market Size and Share Forecast Outlook 2025 to 2035

Thank you!
You will receive an email from our Business Development Manager. Please be sure to check your SPAM/JUNK folder too.
Chat With
MaRIA