Biotin Gummies Market Size and Share Forecast Outlook 2025 to 2035

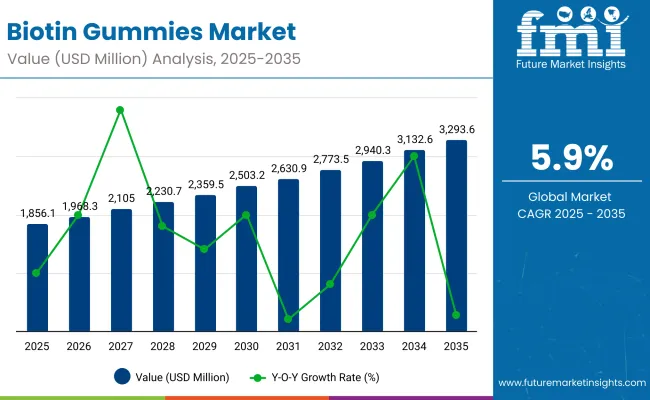
A market valuation of USD 1,856.1 million in 2025 is projected to be advanced to USD 3,293.6 million by 2035, reflecting an incremental gain of USD 1,437.5 million over the decade. This translates into a compound annual growth rate (CAGR) of 5.9%, signaling steady yet resilient category expansion.
Quick Stats Biotin Gummies Market

  • Biotin Gummies Market Value (2025): USD 1.86 billion
  • Biotin Gummies Market Forecast Value (2035): USD 3.29 billion
  • Biotin Gummies Market Forecast CAGR (2025 to 2035): 5.9%
  • Leading Segment in Biotin Gummies Market in 2025: Below 2,500 mcg dosage strength (XX%)
  • Key Growth Regions in the Biotin Gummies Market: North America, Europe, South Asia & Pacific
  • Top Key Players in Biotin Gummies Market: Church & Dwight Co., Inc., Nature’s Bounty Co., NutraBlast, Olly Public Benefit Corporation, Pharmavite LLC, Vitafusion, Nature Made, Natrol LLC, SmartyPants Vitamins, Goli Nutrition Inc.

Biotin Gummies Market

Biotin Gummies Market Key Takeaways

Metric Value
Market Estimated Value in (2025E) USD 1.86 billion
Market Forecast Value in (2035F) USD 3.9 billion
Forecast CAGR (2025 to 2035) 5.9%

The first half of the forecast period, from 2025 to 2030, is expected to see the market progress from USD 1,856.1 million to USD 2,503.2 million, generating USD 647.1 million in additional value, which represents nearly 45% of the total ten-year increase. Growth in this phase is anticipated to be underpinned by the broadening acceptance of beauty-from-within supplementation and the consolidation of online retail as a dominant sales channel.

During the second half, from 2030 to 2035, a stronger pace of market expansion is anticipated, with USD 790.4 million added as the market moves from USD 2,503.2 million to USD 3,293.6 million. This acceleration is likely to be reinforced by deeper penetration into emerging economies, where rising disposable incomes and wellness awareness are forecast to stimulate demand. Product innovation aligned with sugar reduction, plant-based gelling agents, and clinically validated dosages is expected to sustain premium positioning and encourage repeat purchase rates.

In the context of this trajectory, market share shifts are likely to favor brands demonstrating regulatory compliance, robust supply chain agility, and Omni channel execution. As consumer trust becomes increasingly linked to transparency and third-party testing, long-term competitive advantage is expected to be secured by those investing in both product quality and educational outreach.

From 2020 to 2024, the Biotin Gummies Market was advanced from a niche wellness segment to a mainstream supplementation category, supported by strong consumer pull for beauty-from-within products. This period witnessed market leadership concentrated among established nutraceutical brands and specialized gummy supplement innovators, collectively accounting for the majority of global revenue. Differentiation was achieved through taste innovation, dosage standardization, and multi-ingredient fortification strategies, while online channels emerged as critical acquisition platforms.

By 2025, demand is projected to reach USD 1.86 billion, with growth increasingly shaped by clean-label reformulations, sugar reduction, and plant-based gelling innovations. Competitive dynamics are anticipated to shift toward brands demonstrating clinical validation, transparent sourcing, and Omni channel execution. Digital-first entrants are expected to challenge incumbents by leveraging influencer ecosystems, AI-personalized subscription models, and targeted micro-nutrient blending. Over the decade, long-term category winners are likely to be defined not solely by product innovation, but by the strength of consumer trust, supply chain agility, and the ability to scale personalization at a global level.

Why the Biotin Gummies Market is growing ?

Growth in the Biotin Gummies Market is being supported by the convergence of rising wellness awareness, the popularity of beauty-from-within supplementation, and consumer preference for convenient, palatable dosage forms. The format’s taste appeal and ease of consumption have been leveraged to attract first-time supplement users, particularly in younger demographics. Advancements in gummy formulation technology have enabled the integration of clinically relevant biotin dosages alongside complementary nutrients, improving perceived efficacy.

Digital retail channels have been utilized to drive personalized marketing, influencer-led promotions, and subscription-based replenishment models. Clean-label reformulations, reduced sugar content, and plant-based gelling agents have been adopted to align with evolving dietary preferences. Regulatory compliance and transparent sourcing practices are expected to strengthen consumer trust, further sustaining adoption. As functional benefits are increasingly supported by clinical validation, demand is anticipated to accelerate in both mature and emerging markets, driving consistent revenue expansion across the forecast period.

Segmental Analysis

The Biotin Gummies Market has been comprehensively segmented to reflect how architecture taste, benefit signaling, and audience targeting are shaping demand. In flavor, consumer adherence is being strengthened by familiar berry and citrus profiles, while tropical and assorted mixes are being used to refresh repeat purchases and reduce taste fatigue. In product claims, growth is being catalyzed by hair-focused positioning, with spillover into nail and skin outcomes as multi-ingredient formats mature and substantiation improves.

In target demographics, engagement is being led by women aged 18-44, while adoption among men and teenagers is being expanded through gender-neutral branding and creator-led discovery. Through this structure, visibility is being provided into shifting taste preferences, proof-oriented claims, and age-specific need states that are expected to guide portfolio design, channel prioritization, and pricing ladders over the forecast horizon.

Insights into Flavor Segment with Berry Profiles Leading Acceptance

Flavor Segment Market Value Share, 2025
Berry (Strawberry, Raspberry, Blueberry, Mixed Berry) 40%
Citrus (Orange, Lemon, Grapefruit) 18%
Tropical (Pineapple, Mango, Coconut) 12%
Apple & Other Fruits 10%
Mixed/Assorted Flavors 20%

Berry-forward profiles are being positioned as the default for broad appeal share around 40% of total market share in 2025, supported by natural flavor associations and high acceptance across age cohorts. Citrus notes are expected to benefit from “fresh/clean” cues and pairing with reduced-sugar recipes. Tropical variants are being used to drive novelty and incremental trial among younger consumers, while apple/other fruits and assorted mixes are being deployed to maintain variety across subscription cycles. Over the medium term, share stability is anticipated to favor brands standardizing natural colorants and sweeteners, with shelf resilience expected where heat/moisture stability is validated for warm-climate markets.
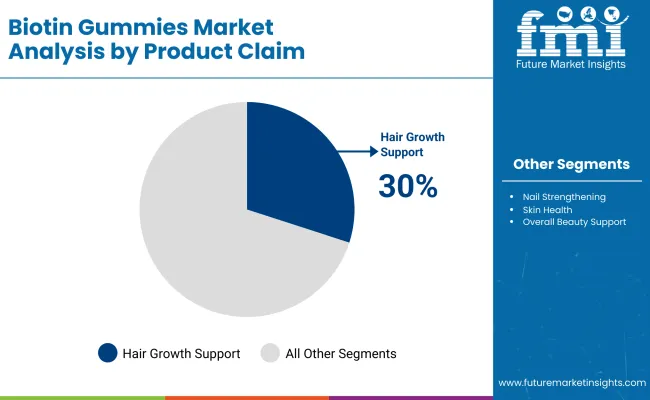
Insights into Product Claim Segment with Hair Growth Support Dominating Choice

Biotin Gummies Market By Product

Application Market Value Share, 2025
Hair Growth Support 30%
Nail Strengthening 20%
Skin Health 25%
Overall Beauty Support 15%
Energy & Metabolism Support 10%

Hair growth support is being retained as the anchor claim, share 30% of the market share underpinned by recognition of biotin’s role in keratin pathways and reinforced by before/after narratives. Nail strengthening is expected to sustain momentum in routines that bundle hair, nail, and skin outcomes. Skin health claims are being widened through co-formulation with collagen, minerals, and antioxidants, while “overall beauty support” SKUs are being positioned for simplicity seekers. Energy/metabolism claims are being used to reach wellness generalists through B-complex synergy. Over time, claim hierarchy is expected to correlate with clinical signaling, assay-interference risk communication, and retailer compliance requirements.

What are the Drivers, Restraints, and Key Trends of the Biotin Gummies Market?

Clinical Validation Enhancing Category Credibility

Market adoption is being anchored by the growing portfolio of peer-reviewed clinical studies validating biotin supplementation’s measurable benefits for hair, skin, and nail health. Over the past five years, evidence-based positioning has been increasingly emphasized as both consumers and regulatory bodies demand transparency in dosage efficacy and safety. Brands are leveraging third-party laboratory verification and publishing assay results to substantiate claims, enabling the category to transition from trend-driven appeal to clinically grounded legitimacy. Retailer partnerships are being strengthened as evidence-backed products are seen as lower compliance risks and better suited for premium placement.

This validation is also allowing manufacturers to justify premium pricing strategies, particularly in mature markets where consumer skepticism can hinder uptake. Additionally, ongoing research into synergistic ingredient combinations is expected to extend biotin’s appeal into adjacent wellness categories, further solidifying its functional credibility. Competitive advantage over the forecast period is projected to favor companies that not only meet minimum compliance standards but also actively invest in longitudinal studies and dosage optimization trials. This proactive approach is anticipated to position such brands as thought leaders in the beauty-from-within segment, resulting in sustained shelf visibility, higher repeat purchase rates, and enduring consumer trust.

Cross-Category Innovation in Functional Formulations

The Biotin Gummies Market is experiencing accelerated expansion through the integration of biotin with complementary active ingredients, creating multifunctional formulations that address multiple beauty and wellness concerns simultaneously. By combining biotin with collagen peptides, zinc, adaptogens, and antioxidants, brands are able to target hair vitality, skin elasticity, nail strength, stress management, and overall energy metabolism in a single product. This cross-category innovation is enabling products to move beyond single-claim positioning, aligning with consumer demand for convenience, value-per-serving, and comprehensive health solutions.

The appeal is particularly strong in urban markets where time-pressed consumers seek simplified supplement regimens without sacrificing efficacy. Manufacturers capable of delivering stable, multi-active formulations without compromising taste, texture, or bioavailability are expected to secure strategic advantage. Technological advances in microencapsulation and controlled-release systems are further enabling ingredient compatibility while preserving potency over shelf life. As premiumization trends continue, multifunctional gummies are anticipated to command higher price points, especially when supported by clear on-pack benefit hierarchies and clinically validated claims. Over the forecast horizon, competitive differentiation is likely to favor players that excel in integrating functional diversity with clean-label credentials, effectively bridging the gap between indulgence, convenience, and therapeutic performance.
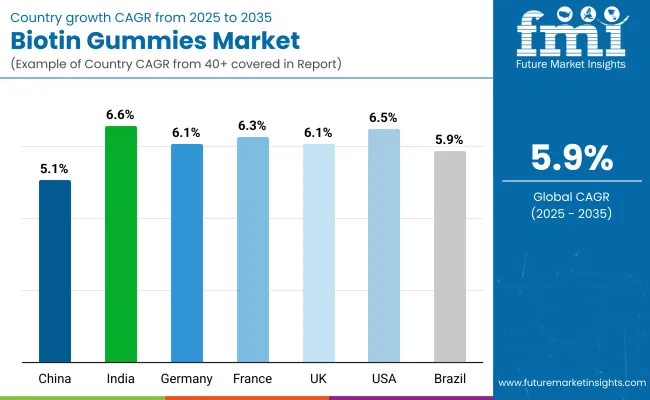
Analysis of Biotin Gummies Market by Key Countries

Country Wise Analysis Biotin Gummies Market

Countries CAGR (2025 to 2035)
United States 6.54%
Germany 6.16%
France 6.38%
China 5.13%
India 6.62%
Brazil 5.91%

The global biotin gummies market has been shaped by varied regional consumption patterns, regulatory environments, and consumer awareness of nutraceuticals. North America has remained the most mature market, with the United States (6.54% CAGR) leading growth through the dominance of direct-to-consumer (DTC) brands, subscription-based e-commerce models, and sustained demand for multifunctional beauty-from-within supplements.

Europe has registered steady progress, led by Germany (6.16%), France (6.38%), where biotin gummies have been increasingly positioned as part of holistic beauty and wellness regimes. Stronger regulatory oversight and consumer preference for vegan-certified and sugar-free formulations have shaped demand in these markets.

Asia-Pacific has been identified as the fastest-growing, with China (5.13%) and India (6.62%) emerging as pivotal growth centers. In China, expansion has been accelerated by clean-label demand, KOL-driven online marketing, and cross-border e-commerce platforms. India’s momentum has been attributed to rapid uptake in urban wellness retail, expanding preventive healthcare awareness, and increasing female consumer participation in beauty supplement categories.

In Latin America, Brazil (5.91%) has emerged as a growth hub, supported by expanding health-focused retail chains and rising popularity of beauty gummies among younger demographics.
Sales Outlook for Biotin Gummies in the United States

United States Biotin Gummies Market

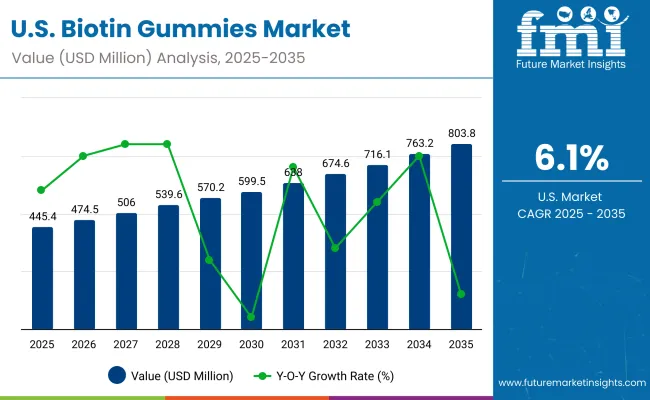
The USA biotin gummies market is projected to grow at a CAGR of 6.1% between 2025 and 2035, reaching substantial value expansion over the forecast period. Growth is supported by strong consumer adoption of beauty-from-within nutraceuticals, particularly among millennials and Gen Z who favor gummies for their palatable taste, convenience, and compliance advantages compared to capsules or tablets.

Hair health continues to dominate product positioning, with biotin widely marketed for hair growth, thickness, and strength. This segment accounts for the largest share, while nail health and skin radiance solutions are also gaining traction. Increasing awareness of metabolism andenergy support has further diversified demand, especially through multifunctional gummy formulations that combine biotin with collagen, hyaluronic acid, or other beauty actives.

Distribution is led by direct-to-consumer (DTC) e-commerce platforms, Amazon, and brand-owned websites, with offline presence in Walmart, Walgreens, and CVS reinforcing accessibility. Marketing via influencers and subscription-based models has enhanced repeat purchase rates and brand loyalty.

Sales Outlook for Biotin Gummies in the United States

Year USA Biotin Gummies Market (USD Billion)
2025 445.46
2026 474.5
2027 506.0
2028 539.6
2029 570.2
2030 599.5
2031 638.0
2032 674.6
2033 716.1
2034 763.2
2035 803.8
  • The USA biotin gummies market is projected to expand steadily at 6.1% CAGR (2025-2035).
  • Hair growth and thickness dominate consumption with 44% share in 2025.
  • Growth will be reinforced by vegan, sugar-free, and clean-label innovations catering to health-conscious consumers.

Growth and Expansion Outlook for Biotin Gummies Market in the United Kingdom

The Biotin Gummies Market in the United Kingdom is forecasted to expand at a CAGR of 6.11% between 2025 and 2035, supported by increasing consumer prioritization of beauty-from-within solutions and preventive wellness practices. Expansion has been strengthened by the UK’s clean-label supplement movement, where transparency, allergen-free formulations, and vegan certifications have become core purchase drivers. Specialty beauty retailers, e-commerce channels, and subscription-based platforms are being positioned as the leading distribution networks. Notable momentum has been observed in multifunctional gummy formats that combine biotin with collagen, hyaluronic acid, or vitamins C and E, catering to holistic skin, hair, and nail health. Rising awareness of nutritional gaps among younger demographics and an aging population has further reinforced market adoption.

  • Biotin gummies are being increasingly recommended through beauty and wellness retailers as part of preventive care regimens.
  • Premium segments are adopting sugar-free, vegan, and clinically validated formulations aligned with UK clean-label standards.
  • Growing self-directed wellness trends, fueled by NHS appointment backlogs, are accelerating OTC biotin gummy uptake.

Growth and Expansion Outlook for Berberine Market in India

The berberine market in India is projected to grow at a CAGR of 6.54% between 2025 and 2035, driven by expanding awareness of traditional botanicals in managing diabetes, cholesterol, and digestive disorders. India’s strong Ayurvedic heritage and integration of botanical extracts into modern nutraceutical formulations are reinforcing consumer confidence in berberine supplements. The proliferation of e-commerce marketplaces and regional nutraceutical brands is fueling accessibility, while private-label collaborations with global supplement firms are accelerating domestic capacity. Increased prevalence of metabolic syndrome and a surge in preventive healthcare spending have catalyzed demand for berberine capsules, tablets, and functional blends. Clean-label, vegan, and allergen-free positioning continues to gain traction among India’s younger urban population.

  • Berberine is increasingly integrated with Ayurvedic botanicals (e.g., ashwagandha, turmeric) for holistic wellness formulations.
  • Domestic manufacturers are expanding contract production for export markets, strengthening India’s role as a sourcing hub.
  • Rising middle-class incomes and preventive healthcare adoption are expanding demand beyond metros into Tier II/III cities.

Sales Outlook for Biotin Gummies in China

China’s biotin gummies market is projected to expand at a CAGR of 9.70% between 2025 and 2035, positioning it as one of the fastest-growing markets globally. The category has been reinforced by both traditional beauty beliefs and modern supplement innovation. Gummies have gained popularity across Tier 1 and Tier 2 cities, where consumers are adopting them as part of beauty-from-within and functional wellness regimens. Strong regulatory encouragement for standardized nutraceuticals, coupled with robust domestic gummy manufacturing infrastructure, has enabled China to emerge as both a leading consumer and a competitive exporter.

  • Long-term demand is being reinforced by the integration of biotin in beauty and wellness programs.
  • Functional gummies combining biotin with herbal extracts and probiotics are being launched by domestic players.
  • Offline distribution is driven by pharmacies and beauty chains, while cross-border e-commerce is expanding reach into Southeast Asia.

In-depth Analysis Biotin Gummies Market in Germany

Countries / Subregions 2025
UK 19.15%
Germany 21.88%
Italy 9.42%
France 14.62%
Spain 10.56%
BENELUX 6.19%
Nordic 5.83%
Rest of Europe 12%
Countries / Subregions 2035
UK 19.40%
Germany 20.73%
Italy 10.73%
France 13.58%
Spain 11.92%
BENELUX 5.26%
Nordic 5.46%
Rest of Europe 13%

The biotin gummies market in Germany is projected to expand steadily, underpinned by consumers’ strong orientation toward scientifically validated, clean-label supplements. From your dataset, the skin health claim segment is highlighted with a CAGR of ~6.16% (2025-2035), suggesting that beauty-from-within positioning will remain a primary demand driver. Germany’s mature regulatory ecosystem favors transparent ingredient disclosure, vegan pectin-based formulations, and sugar-reduced innovations, reinforcing consumer trust in premium offerings.

Demographically, teenagers accounted for ~21.88% of consumption in 2025, a share expected to slightly decline to ~20.73% by 2035, signaling diversification toward adult and mid-life users. Pharmacy-led distribution remains dominant, but e-commerce is steadily scaling as German buyers increasingly engage with personalized wellness platforms. Over the forecast horizon, brands integrating recyclable packaging, third-party certifications, and omnichannel strategies are expected to secure competitive advantage.
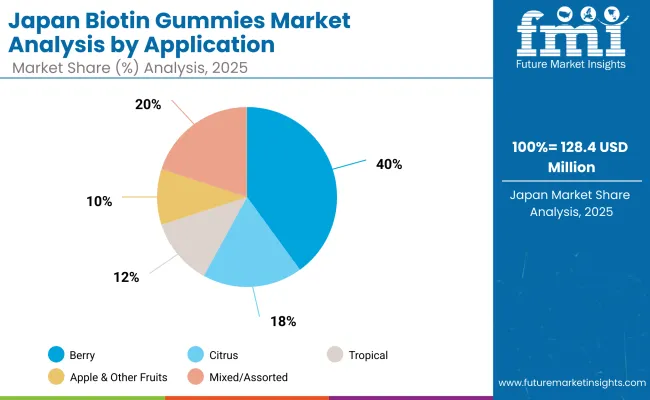
Growth Outlook for Biotin Gummies Market in Japan

Japan Biotin Gummies Market

Application Segment Market Value Share, 2025
Berry 40%
Citrus 18%
Tropical 12%
Apple & Other Fruits 10%
Mixed/Assorted 20%

The biotin gummies market in Japan is projected to reach USD 128.4 million in 2025, expanding steadily at a CAGR of 6.12% between 2025 and 2035. Market performance is strongly tied to Japan’s aging demographic, where beauty, hair, nail, and skin care remain critical consumer priorities. In 2025, hair and nail health accounts for 40% of the market, while skin health contributes 28%, together representing over two-thirds of demand. Growth has also been supported by the availability of pharmacy-led OTC channels, robust consumer trust in clinically validated supplements, and increasing focus on premium gummies enriched with collagen peptides, CoQ10, and ceramides. Rising urban lifestyles and preference for convenience-based supplementation continue to accelerate adoption.
  • Japan holds 7.10% of the global biotin gummies market in 2025.
  • Hair, nail, and skin health segments dominate with a combined 68% share.
  • Market growth is supported by clinical-grade innovation and OTC retail adoption.

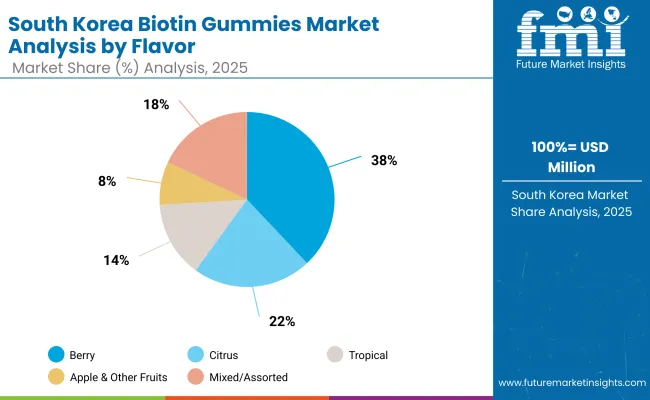
Opportunity Analysis of South Korea Biotin Gummies Market

South Korea Biotin Gummies Market

Flavor 2025 Share (%)
Berry 38%
Citrus 22%
Tropical 14%
Apple & Other Fruits 8%
Mixed/Assorted 18%
Total 100%

The biotin gummies market in South Korea is positioned for strong growth, with berry flavors commanding the largest share at 38% in 2025, reflecting their alignment with consumer preferences for antioxidant-rich and naturally sweet formulations. Citrus-based gummies follow at 22%, supported by South Korea’s strong demand for vitamin C-enriched wellness solutions. Tropical flavors at 14% have benefited from premiumization trends and cross-category inspiration from beverages and functional snacks. Apple and other fruit flavors maintain an 8% share, offering niche opportunities in localized taste innovation. The fastest expansion is projected in the mixed/assorted category, with a CAGR of 9.0%, as multi-flavor packs gain traction among younger demographics seeking variety and playful consumption. This flavor-led diversification underpins broader opportunities in the country’s beauty-from-within segment.

Berry dominates with 38% share, leveraging antioxidant positioning and mainstream appeal. Mixed/assorted gummies, though smaller in share, lead growth with a 9% CAGR. Flavor diversification is shaping consumer engagement in South Korea’s beauty-driven nutraceutical culture.
Competitive Landscape of Biotin Gummies Market

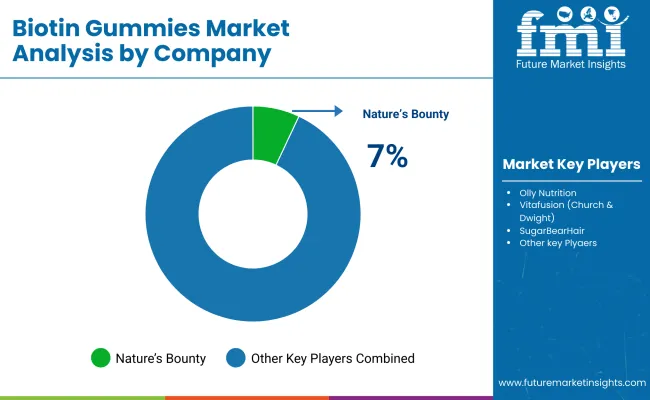
Biotin Gummies Market By Company

Company Global Value Share (%)
Nature’s Bounty 7%
Olly Nutrition 6%
Vitafusion (Church & Dwight) 5%
SugarBearHair 4%
Others 78%

The global biotin gummies market in 2025 is characterized by moderate fragmentation, shaped by innovation in beauty-from-within positioning, clean-label compliance, and flavor-based consumer appeal. USA-based leaders such as Nature’s Bounty, Olly Nutrition, and Vitafusiondominate premium and mass retail segments, leveraging strong brand equity, celebrity endorsements, and extensive distribution networks. Niche innovators like SugarBearHair have capitalized on influencer-led direct-to-consumer (DTC) channels, targeting younger demographics and creating high visibility through social media campaigns.

Asian manufacturers, particularly in India and China, play a growing role in private-label and contract manufacturing of gummies, focusing on vegan, halal, and sugar-free formats tailored for export markets. European firms are differentiating through collagen-infused and plant-based gummies, catering to rising demand for multifunctional supplements. Competitive strategies are shifting from price-based competition to format innovation, combination formulations (biotin + collagen/hyaluronic acid), and clinical substantiation to build consumer trust. Future leadership is expected to rely on R&D-driven biofunctional blends, e-commerce-first launches, and omnichannel retail penetration.

Key Developments in Biotin Gummies Market

  • On March 12, 2025 Strategic partnerships were established between leading nutraceutical brands and digital health platforms to enable AI-driven personalization of biotin gummy supplementation, increasing consumer engagement and subscription-based retention.
  • On October 18, 2024European manufacturers adopted biodegradable and recyclable packaging solutions for biotin gummies, enhancing alignment with sustainability-focused consumer preferences.

Scope of the Report

Item Value
Quantitative Units USD 1.89 Billion
Component Single-ingredient Biotin Gummies, Biotin + Multivitamins, Biotin + Collagen, Biotin + Minerals (Zinc, Selenium, etc.)
Dosage Strength Below 2,500 mcg, 2,500-5,000 mcg, 5,001-10,000 mcg, Above 10,000 mcg
Formulation Standalone Biotin, Combination with Multivitamins, Combination with Collagen, Combination with Minerals
Type Chewable gummies, Sugar-free gummies, Vegan/plant-based gummies, Functional gummies (fortified with additional nutrients)
End-use Industry Nutraceuticals, Dietary Supplements, Cosmetics & Personal Care, Pharmaceutical/Medical Nutrition, Functional Food & Beverages
Regions Covered North America, Latin America, Europe, East Asia, South Asia & Pacific, Middle East & Africa
Country Covered United States, Canada, Germany, France, United Kingdom, China, Japan, India, Brazil, South Africa
Key Companies Profiled Church & Dwight Co., Inc. (Vitafusion), Nature’s Bounty, GNC Holdings, Inc., NutraBlast, Olly Public Benefit Corporation, HUM Nutrition, Nature Made, Vital Proteins, SugarBearHair, and other regional players
Additional Attributes Dollar sales by dosage strength and formulation, consumer preference for sugar-free and vegan gummies, growing demand in beauty-from-within supplements, rapid adoption in Asia-Pacific markets, strong retail and e-commerce growth, rising brand collaborations with influencers, increasing product launches in multivitamin- biotine blends, and innovations in clean-label and organic gummy formulations.

Key Segments

By Dosage Strength:

  • Below 2,500 mcg
  • 2,500-5,000 mcg
  • 5,001-10,000 mcg
  • Above 10,000 mcg

By Formulation:

  • Single-ingredient Biotin
  • Biotin + Multivitamins
  • Biotin + Collagen
  • Biotin + Minerals (e.g., Zinc, Selenium)
  • Biotin + Herbal Extracts (e.g., Horsetail, Amla)

By Flavor:

  • Berry (Strawberry, Raspberry, Blueberry, Mixed Berry)
  • Citrus (Orange, Lemon, Grapefruit)
  • Tropical (Pineapple, Mango, Coconut)
  • Apple & Other Fruits
  • Mixed/Assorted Flavors

By Product Claim:

  • Hair Growth Support
  • Nail Strengthening
  • Skin Health
  • Overall Beauty Support
  • Energy & Metabolism Support

By Target Demographic:

  • Women (18-44 years)
  • Middle-aged Adults (45-64 years)
  • Seniors (65+ years)
  • Men
  • Teenagers

By Sweetener Type:

  • Sugar-containing
  • Sugar-free (Artificial Sweeteners)
  • Sugar-free (Natural Sweeteners - Stevia, Monk Fruit)

By Dietary Preference:

  • Vegan
  • Vegetarian
  • Non-Vegetarian (Gelatin-based)
  • Allergen-free (Gluten-free, Dairy-free, Nut-free)

By Region:

  • North America
  • Latin America
  • Europe
  • East Asia
  • South Asia & Pacific
  • Middle East and Africa

Table of Content

  1. Executive Summary
    • Global Market Outlook
    • Demand-side Trends
    • Supply-side Trends
    • Technology Roadmap Analysis
    • Analysis and Recommendations
  2. Market Overview
    • Market Coverage / Taxonomy
    • Market Definition / Scope / Limitations
  3. Market Background
    • Market Dynamics
      • Drivers
      • Restraints
      • Opportunity
      • Trends
    • Scenario Forecast
      • Demand in Optimistic Scenario
      • Demand in Likely Scenario
      • Demand in Conservative Scenario
    • Opportunity Map Analysis
    • Product Life Cycle Analysis
    • Supply Chain Analysis
    • Investment Feasibility Matrix
    • Value Chain Analysis
    • PESTLE and Porter’s Analysis
    • Regulatory Landscape
    • Regional Parent Market Outlook
    • Production and Consumption Statistics
    • Import and Export Statistics
  4. Global Market Analysis 2020 to 2024 and Forecast, 2025 to 2035
    • Historical Market Size Value (USD Million) Analysis, 2020 to 2024
    • Current and Future Market Size Value (USD Million) Projections, 2025 to 2035
      • Y-o-Y Growth Trend Analysis
      • Absolute $ Opportunity Analysis
  5. Global Market Pricing Analysis 2020 to 2024 and Forecast 2025 to 2035
  6. Global Market Analysis 2020 to 2024 and Forecast 2025 to 2035, By Dosage Strength
    • Introduction / Key Findings
    • Historical Market Size Value (USD Million) Analysis By Dosage Strength, 2020 to 2024
    • Current and Future Market Size Value (USD Million) Analysis and Forecast By Dosage Strength, 2025 to 2035
      • Below 2,500 mcg
      • 2,500-5,000 mcg
      • 5,001-10,000 mcg
      • Above 10,000 mcg
    • Y-o-Y Growth Trend Analysis By Dosage Strength, 2020 to 2024
    • Absolute $ Opportunity Analysis By Dosage Strength, 2025 to 2035
  7. Global Market Analysis 2020 to 2024 and Forecast 2025 to 2035, By Formulation
    • Introduction / Key Findings
    • Historical Market Size Value (USD Million) Analysis By Formulation, 2020 to 2024
    • Current and Future Market Size Value (USD Million) Analysis and Forecast By Formulation, 2025 to 2035
      • Single-ingredient Biotin
      • Biotin + Multivitamins
      • Biotin + Collagen
      • Biotin + Minerals (e.g., Zinc, Selenium)
      • Biotin + Herbal Extracts (e.g., Horsetail, Amla)
    • Y-o-Y Growth Trend Analysis By Formulation, 2020 to 2024
    • Absolute $ Opportunity Analysis By Formulation, 2025 to 2035
  8. Global Market Analysis 2020 to 2024 and Forecast 2025 to 2035, By Flavor
    • Introduction / Key Findings
    • Historical Market Size Value (USD Million) Analysis By Flavor, 2020 to 2024
    • Current and Future Market Size Value (USD Million) Analysis and Forecast By Flavor, 2025 to 2035
      • Berry (Strawberry, Raspberry, Blueberry, Mixed Berry)
      • Citrus (Orange, Lemon, Grapefruit)
      • Tropical (Pineapple, Mango, Coconut)
      • Apple & Other Fruits
      • Mixed/Assorted Flavors
    • Y-o-Y Growth Trend Analysis By Flavor, 2020 to 2024
    • Absolute $ Opportunity Analysis By Flavor, 2025 to 2035
  9. Global Market Analysis 2020 to 2024 and Forecast 2025 to 2035, By Product Claim
    • Introduction / Key Findings
    • Historical Market Size Value (USD Million) Analysis By Product Claim, 2020 to 2024
    • Current and Future Market Size Value (USD Million) Analysis and Forecast By Product Claim, 2025 to 2035
      • Hair Growth Support
      • Nail Strengthening
      • Skin Health
      • Overall Beauty Support
      • Energy & Metabolism Support
    • Y-o-Y Growth Trend Analysis By Product Claim, 2020 to 2024
    • Absolute $ Opportunity Analysis By Product Claim, 2025 to 2035
  10. Global Market Analysis 2020 to 2024 and Forecast 2025 to 2035, By Target Demographic
    • Introduction / Key Findings
    • Historical Market Size Value (USD Million) Analysis By Target Demographic, 2020 to 2024
    • Current and Future Market Size Value (USD Million) Analysis and Forecast By Target Demographic, 2025 to 2035
      • Women (18-44 years)
      • Middle-aged Adults (45-64 years)
      • Seniors (65+ years)
      • Men
      • Teenagers
    • Y-o-Y Growth Trend Analysis By Target Demographic, 2020 to 2024
    • Absolute $ Opportunity Analysis By Target Demographic, 2025 to 2035
  11. Global Market Analysis 2020 to 2024 and Forecast 2025 to 2035, By Sweetener Type
    • Introduction / Key Findings
    • Historical Market Size Value (USD Million) Analysis By Sweetener Type, 2020 to 2024
    • Current and Future Market Size Value (USD Million) Analysis and Forecast By Sweetener Type, 2025 to 2035
      • Sugar-containing
      • Sugar-free (Artificial Sweeteners)
      • Sugar-free (Natural Sweeteners - Stevia, Monk Fruit)
    • Y-o-Y Growth Trend Analysis By Sweetener Type, 2020 to 2024
    • Absolute $ Opportunity Analysis By Sweetener Type, 2025 to 2035
  12. Global Market Analysis 2020 to 2024 and Forecast 2025 to 2035, By Dietary Preference
    • Introduction / Key Findings
    • Historical Market Size Value (USD Million) Analysis By Dietary Preference, 2020 to 2024
    • Current and Future Market Size Value (USD Million) Analysis and Forecast By Dietary Preference, 2025 to 2035
      • Vegan
      • Vegetarian
      • Non-Vegetarian (Gelatin-based)
      • Allergen-free (Gluten-free, Dairy-free, Nut-free)
    • Y-o-Y Growth Trend Analysis By Dietary Preference, 2020 to 2024
    • Absolute $ Opportunity Analysis By Dietary Preference, 2025 to 2035
  13. Global Market Analysis 2020 to 2024 and Forecast 2025 to 2035, By Region
    • Introduction
    • Historical Market Size Value (USD Million) Analysis By Region, 2020 to 2024
    • Current Market Size Value (USD Million) Analysis and Forecast By Region, 2025 to 2035
      • North America
      • Latin America
      • Europe
      • East Asia
      • South Asia & Pacific
      • Middle East and Africa
    • Market Attractiveness Analysis By Region
  14. North America Market Analysis 2020 to 2024 and Forecast 2025 to 2035, By Country
    • Historical Market Size Value (USD Million) Trend Analysis By Market Taxonomy, 2020 to 2024
    • Market Size Value (USD Million) Forecast By Market Taxonomy, 2025 to 2035
      • By Country
        • USA
        • Canada
      • By Dosage Strength
      • By Formulation
      • By Flavor
      • By Product Claim
      • By Target Demographic
      • By Sweetener Type
      • By Dietary Preference
    • Market Attractiveness Analysis
      • By Country
      • By Dosage Strength
      • By Formulation
      • By Flavor
      • By Product Claim
      • By Target Demographic
      • By Sweetener Type
      • By Dietary Preference
    • Key Takeaways
  15. Latin America Market Analysis 2020 to 2024 and Forecast 2025 to 2035, By Country
    • Historical Market Size Value (USD Million) Trend Analysis By Market Taxonomy, 2020 to 2024
    • Market Size Value (USD Million) Forecast By Market Taxonomy, 2025 to 2035
      • By Country
        • Brazil
        • Mexico
        • Colombia
        • Rest of Latin America
      • By Dosage Strength
      • By Formulation
      • By Flavor
      • By Product Claim
      • By Target Demographic
      • By Sweetener Type
      • By Dietary Preference
    • Market Attractiveness Analysis
      • By Country
      • By Dosage Strength
      • By Formulation
      • By Flavor
      • By Product Claim
      • By Target Demographic
      • By Sweetener Type
      • By Dietary Preference
    • Key Takeaways
  16. Europe Market Analysis 2020 to 2024 and Forecast 2025 to 2035, By Country
    • Historical Market Size Value (USD Million) Trend Analysis By Market Taxonomy, 2020 to 2024
    • Market Size Value (USD Million) Forecast By Market Taxonomy, 2025 to 2035
      • By Country
        • Germany
        • UK
        • France
        • Italy
        • Spain
        • Belgium
        • Netherlands
        • Nordic
        • Switzerland
        • Russia
        • Poland
        • Rest of Europe
      • By Dosage Strength
      • By Formulation
      • By Flavor
      • By Product Claim
      • By Target Demographic
      • By Sweetener Type
      • By Dietary Preference
    • Market Attractiveness Analysis
      • By Country
      • By Dosage Strength
      • By Formulation
      • By Flavor
      • By Product Claim
      • By Target Demographic
      • By Sweetener Type
      • By Dietary Preference
    • Key Takeaways
  17. East Asia Market Analysis 2020 to 2024 and Forecast 2025 to 2035, By Country
    • Historical Market Size Value (USD Million) Trend Analysis By Market Taxonomy, 2020 to 2024
    • Market Size Value (USD Million) Forecast By Market Taxonomy, 2025 to 2035
      • By Country
        • China
        • Japan
        • South Korea
      • By Dosage Strength
      • By Formulation
      • By Flavor
      • By Product Claim
      • By Target Demographic
      • By Sweetener Type
      • By Dietary Preference
    • Market Attractiveness Analysis
      • By Country
      • By Dosage Strength
      • By Formulation
      • By Flavor
      • By Product Claim
      • By Target Demographic
      • By Sweetener Type
      • By Dietary Preference
    • Key Takeaways
  18. South Asia & Pacific Market Analysis 2020 to 2024 and Forecast 2025 to 2035, By Country
    • Historical Market Size Value (USD Million) Trend Analysis By Market Taxonomy, 2020 to 2024
    • Market Size Value (USD Million) Forecast By Market Taxonomy, 2025 to 2035
      • By Country
        • India
        • Thailand
        • Malaysia
        • Indonesia
        • Singapore
        • Vietnam
        • Australia
        • New Zealand
        • Rest of South Asia
      • By Dosage Strength
      • By Formulation
      • By Flavor
      • By Product Claim
      • By Target Demographic
      • By Sweetener Type
      • By Dietary Preference
    • Market Attractiveness Analysis
      • By Country
      • By Dosage Strength
      • By Formulation
      • By Flavor
      • By Product Claim
      • By Target Demographic
      • By Sweetener Type
      • By Dietary Preference
    • Key Takeaways
  19. Middle East and Africa Market Analysis 2020 to 2024 and Forecast 2025 to 2035, By Country
    • Historical Market Size Value (USD Million) Trend Analysis By Market Taxonomy, 2020 to 2024
    • Market Size Value (USD Million) Forecast By Market Taxonomy, 2025 to 2035
      • By Country
        • Turkey
        • UAE
        • Saudi Arabia
        • Israel
        • Other GCC Countries
        • North Africa
        • South Africa
      • By Dosage Strength
      • By Formulation
      • By Flavor
      • By Product Claim
      • By Target Demographic
      • By Sweetener Type
      • By Dietary Preference
    • Market Attractiveness Analysis
      • By Country
      • By Dosage Strength
      • By Formulation
      • By Flavor
      • By Product Claim
      • By Target Demographic
      • By Sweetener Type
      • By Dietary Preference
    • Key Takeaways
  20. Key Countries Market Analysis
    • USA
      • Pricing Analysis
      • Market Share Analysis, 2024
        • By Dosage Strength
        • By Formulation
        • By Flavor
        • By Product Claim
        • By Target Demographic
        • By Sweetener Type
        • By Dietary Preference
    • Canada
      • Pricing Analysis
      • Market Share Analysis, 2024
        • By Dosage Strength
        • By Formulation
        • By Flavor
        • By Product Claim
        • By Target Demographic
        • By Sweetener Type
        • By Dietary Preference
    • Brazil
      • Pricing Analysis
      • Market Share Analysis, 2024
        • By Dosage Strength
        • By Formulation
        • By Flavor
        • By Product Claim
        • By Target Demographic
        • By Sweetener Type
        • By Dietary Preference
    • Mexico
      • Pricing Analysis
      • Market Share Analysis, 2024
        • By Dosage Strength
        • By Formulation
        • By Flavor
        • By Product Claim
        • By Target Demographic
        • By Sweetener Type
        • By Dietary Preference
    • Colombia
      • Pricing Analysis
      • Market Share Analysis, 2024
        • By Dosage Strength
        • By Formulation
        • By Flavor
        • By Product Claim
        • By Target Demographic
        • By Sweetener Type
        • By Dietary Preference
    • Rest of Latin America
      • Pricing Analysis
      • Market Share Analysis, 2024
        • By Dosage Strength
        • By Formulation
        • By Flavor
        • By Product Claim
        • By Target Demographic
        • By Sweetener Type
        • By Dietary Preference
    • Germany
      • Pricing Analysis
      • Market Share Analysis, 2024
        • By Dosage Strength
        • By Formulation
        • By Flavor
        • By Product Claim
        • By Target Demographic
        • By Sweetener Type
        • By Dietary Preference
    • UK
      • Pricing Analysis
      • Market Share Analysis, 2024
        • By Dosage Strength
        • By Formulation
        • By Flavor
        • By Product Claim
        • By Target Demographic
        • By Sweetener Type
        • By Dietary Preference
    • France
      • Pricing Analysis
      • Market Share Analysis, 2024
        • By Dosage Strength
        • By Formulation
        • By Flavor
        • By Product Claim
        • By Target Demographic
        • By Sweetener Type
        • By Dietary Preference
    • Italy
      • Pricing Analysis
      • Market Share Analysis, 2024
        • By Dosage Strength
        • By Formulation
        • By Flavor
        • By Product Claim
        • By Target Demographic
        • By Sweetener Type
        • By Dietary Preference
    • Spain
      • Pricing Analysis
      • Market Share Analysis, 2024
        • By Dosage Strength
        • By Formulation
        • By Flavor
        • By Product Claim
        • By Target Demographic
        • By Sweetener Type
        • By Dietary Preference
    • Belgium
      • Pricing Analysis
      • Market Share Analysis, 2024
        • By Dosage Strength
        • By Formulation
        • By Flavor
        • By Product Claim
        • By Target Demographic
        • By Sweetener Type
        • By Dietary Preference
    • Netherlands
      • Pricing Analysis
      • Market Share Analysis, 2024
        • By Dosage Strength
        • By Formulation
        • By Flavor
        • By Product Claim
        • By Target Demographic
        • By Sweetener Type
        • By Dietary Preference
    • Nordic
      • Pricing Analysis
      • Market Share Analysis, 2024
        • By Dosage Strength
        • By Formulation
        • By Flavor
        • By Product Claim
        • By Target Demographic
        • By Sweetener Type
        • By Dietary Preference
    • Switzerland
      • Pricing Analysis
      • Market Share Analysis, 2024
        • By Dosage Strength
        • By Formulation
        • By Flavor
        • By Product Claim
        • By Target Demographic
        • By Sweetener Type
        • By Dietary Preference
    • Russia
      • Pricing Analysis
      • Market Share Analysis, 2024
        • By Dosage Strength
        • By Formulation
        • By Flavor
        • By Product Claim
        • By Target Demographic
        • By Sweetener Type
        • By Dietary Preference
    • Poland
      • Pricing Analysis
      • Market Share Analysis, 2024
        • By Dosage Strength
        • By Formulation
        • By Flavor
        • By Product Claim
        • By Target Demographic
        • By Sweetener Type
        • By Dietary Preference
    • Rest of Europe
      • Pricing Analysis
      • Market Share Analysis, 2024
        • By Dosage Strength
        • By Formulation
        • By Flavor
        • By Product Claim
        • By Target Demographic
        • By Sweetener Type
        • By Dietary Preference
    • China
      • Pricing Analysis
      • Market Share Analysis, 2024
        • By Dosage Strength
        • By Formulation
        • By Flavor
        • By Product Claim
        • By Target Demographic
        • By Sweetener Type
        • By Dietary Preference
    • Japan
      • Pricing Analysis
      • Market Share Analysis, 2024
        • By Dosage Strength
        • By Formulation
        • By Flavor
        • By Product Claim
        • By Target Demographic
        • By Sweetener Type
        • By Dietary Preference
    • South Korea
      • Pricing Analysis
      • Market Share Analysis, 2024
        • By Dosage Strength
        • By Formulation
        • By Flavor
        • By Product Claim
        • By Target Demographic
        • By Sweetener Type
        • By Dietary Preference
    • India
      • Pricing Analysis
      • Market Share Analysis, 2024
        • By Dosage Strength
        • By Formulation
        • By Flavor
        • By Product Claim
        • By Target Demographic
        • By Sweetener Type
        • By Dietary Preference
    • Thailand
      • Pricing Analysis
      • Market Share Analysis, 2024
        • By Dosage Strength
        • By Formulation
        • By Flavor
        • By Product Claim
        • By Target Demographic
        • By Sweetener Type
        • By Dietary Preference
    • Malaysia
      • Pricing Analysis
      • Market Share Analysis, 2024
        • By Dosage Strength
        • By Formulation
        • By Flavor
        • By Product Claim
        • By Target Demographic
        • By Sweetener Type
        • By Dietary Preference
    • Indonesia
      • Pricing Analysis
      • Market Share Analysis, 2024
        • By Dosage Strength
        • By Formulation
        • By Flavor
        • By Product Claim
        • By Target Demographic
        • By Sweetener Type
        • By Dietary Preference
    • Singapore
      • Pricing Analysis
      • Market Share Analysis, 2024
        • By Dosage Strength
        • By Formulation
        • By Flavor
        • By Product Claim
        • By Target Demographic
        • By Sweetener Type
        • By Dietary Preference
    • Vietnam
      • Pricing Analysis
      • Market Share Analysis, 2024
        • By Dosage Strength
        • By Formulation
        • By Flavor
        • By Product Claim
        • By Target Demographic
        • By Sweetener Type
        • By Dietary Preference
    • Australia
      • Pricing Analysis
      • Market Share Analysis, 2024
        • By Dosage Strength
        • By Formulation
        • By Flavor
        • By Product Claim
        • By Target Demographic
        • By Sweetener Type
        • By Dietary Preference
    • New Zealand
      • Pricing Analysis
      • Market Share Analysis, 2024
        • By Dosage Strength
        • By Formulation
        • By Flavor
        • By Product Claim
        • By Target Demographic
        • By Sweetener Type
        • By Dietary Preference
    • Rest of South Asia
      • Pricing Analysis
      • Market Share Analysis, 2024
        • By Dosage Strength
        • By Formulation
        • By Flavor
        • By Product Claim
        • By Target Demographic
        • By Sweetener Type
        • By Dietary Preference
  21. Market Structure Analysis
    • Competition Dashboard
    • Competition Benchmarking
    • Market Share Analysis of Top Players
      • By Regional
      • By Dosage Strength
      • By Formulation
      • By Flavor
      • By Product Claim
      • By Target Demographic
      • By Sweetener Type
      • By Dietary Preference
  22. Competition Analysis
    • Competition Deep Dive
      • OLLY
        • Overview
        • Product Portfolio
        • Profitability by Market Segments (Product/Age /Sales Channel/Region)
        • Sales Footprint
        • Strategy Overview
        • Vitafusion
        • Sugarbear Hair
        • Nature Made
        • Nature’s Bounty
        • Pure Encapsulations
        • Nutrafol
        • Vegamour
        • Plant People
        • Mary Ruth’s
        • Others
    • Assumptions & Acronyms Used
    • Research Methodology

List of Tables

  • Table 1: Global Market Value (USD Million) Forecast by Region, 2020-2035
  • Table 2: Global Market Value (USD Million) Forecast by Dosage Strength, 2020-2035
  • Table 3: Global Market Value (USD Million) Forecast by Formulation, 2020-2035
  • Table 4: Global Market Value (USD Million) Forecast by Flavor, 2020-2035
  • Table 5: Global Market Value (USD Million) Forecast by Product Claim, 2020-2035
  • Table 6: Global Market Value (USD Million) Forecast by Target Demographic, 2020-2035
  • Table 7: Global Market Value (USD Million) Forecast by Sweetener Type, 2020-2035
  • Table 8: Global Market Value (USD Million) Forecast by Dietary Preference, 2020-2035
  • Table 9: North America Market Value (USD Million) Forecast by Country, 2020-2035
  • Table 10: North America Market Value (USD Million) Forecast by Dosage Strength, 2020-2035
  • Table 11: North America Market Value (USD Million) Forecast by Formulation, 2020-2035
  • Table 12: North America Market Value (USD Million) Forecast by Flavor, 2020-2035
  • Table 13: North America Market Value (USD Million) Forecast by Product Claim, 2020-2035
  • Table 14: North America Market Value (USD Million) Forecast by Target Demographic, 2020-2035
  • Table 15: North America Market Value (USD Million) Forecast by Sweetener Type, 2020-2035
  • Table 16: North America Market Value (USD Million) Forecast by Dietary Preference, 2020-2035
  • Table 17: Latin America Market Value (USD Million) Forecast by Country, 2020-2035
  • Table 18: Latin America Market Value (USD Million) Forecast by Dosage Strength, 2020-2035
  • Table 19: Latin America Market Value (USD Million) Forecast by Formulation, 2020-2035
  • Table 20: Latin America Market Value (USD Million) Forecast by Flavor, 2020-2035
  • Table 21: Latin America Market Value (USD Million) Forecast by Product Claim, 2020-2035
  • Table 22: Latin America Market Value (USD Million) Forecast by Target Demographic, 2020-2035
  • Table 23: Latin America Market Value (USD Million) Forecast by Sweetener Type, 2020-2035
  • Table 24: Latin America Market Value (USD Million) Forecast by Dietary Preference, 2020-2035
  • Table 25: Europe Market Value (USD Million) Forecast by Country, 2020-2035
  • Table 26: Europe Market Value (USD Million) Forecast by Dosage Strength, 2020-2035
  • Table 27: Europe Market Value (USD Million) Forecast by Formulation, 2020-2035
  • Table 28: Europe Market Value (USD Million) Forecast by Flavor, 2020-2035
  • Table 29: Europe Market Value (USD Million) Forecast by Product Claim, 2020-2035
  • Table 30: Europe Market Value (USD Million) Forecast by Target Demographic, 2020-2035
  • Table 31: Europe Market Value (USD Million) Forecast by Sweetener Type, 2020-2035
  • Table 32: Europe Market Value (USD Million) Forecast by Dietary Preference, 2020-2035
  • Table 33: East Asia Market Value (USD Million) Forecast by Country, 2020-2035
  • Table 34: East Asia Market Value (USD Million) Forecast by Dosage Strength, 2020-2035
  • Table 35: East Asia Market Value (USD Million) Forecast by Formulation, 2020-2035
  • Table 36: East Asia Market Value (USD Million) Forecast by Flavor, 2020-2035
  • Table 37: East Asia Market Value (USD Million) Forecast by Product Claim, 2020-2035
  • Table 38: East Asia Market Value (USD Million) Forecast by Target Demographic, 2020-2035
  • Table 39: East Asia Market Value (USD Million) Forecast by Sweetener Type, 2020-2035
  • Table 40: East Asia Market Value (USD Million) Forecast by Dietary Preference, 2020-2035
  • Table 41: South Asia & Pacific Market Value (USD Million) Forecast by Country, 2020-2035
  • Table 42: South Asia & Pacific Market Value (USD Million) Forecast by Dosage Strength, 2020-2035
  • Table 43: South Asia & Pacific Market Value (USD Million) Forecast by Formulation, 2020-2035
  • Table 44: South Asia & Pacific Market Value (USD Million) Forecast by Flavor, 2020-2035
  • Table 45: South Asia & Pacific Market Value (USD Million) Forecast by Product Claim, 2020-2035
  • Table 46: South Asia & Pacific Market Value (USD Million) Forecast by Target Demographic, 2020-2035
  • Table 47: South Asia & Pacific Market Value (USD Million) Forecast by Sweetener Type, 2020-2035
  • Table 48: South Asia & Pacific Market Value (USD Million) Forecast by Dietary Preference, 2020-2035
  • Table 49: Middle East and Africa Market Value (USD Million) Forecast by Country, 2020-2035
  • Table 50: Middle East and Africa Market Value (USD Million) Forecast by Dosage Strength, 2020-2035
  • Table 51: Middle East and Africa Market Value (USD Million) Forecast by Formulation, 2020-2035
  • Table 52: Middle East and Africa Market Value (USD Million) Forecast by Flavor, 2020-2035
  • Table 53: Middle East and Africa Market Value (USD Million) Forecast by Product Claim, 2020-2035
  • Table 54: Middle East and Africa Market Value (USD Million) Forecast by Target Demographic, 2020-2035
  • Table 55: Middle East and Africa Market Value (USD Million) Forecast by Sweetener Type, 2020-2035
  • Table 56: Middle East and Africa Market Value (USD Million) Forecast by Dietary Preference, 2020-2035

List of Figures

  • Figure 1: Global Market Pricing Analysis
  • Figure 2: Global Market Value (USD Million) Forecast 2020-2035
  • Figure 3: Global Market Value Share and BPS Analysis by Dosage Strength, 2025 and 2035
  • Figure 4: Global Market Y-o-Y Growth Comparison by Dosage Strength, 2025-2035
  • Figure 5: Global Market Attractiveness Analysis by Dosage Strength
  • Figure 6: Global Market Value Share and BPS Analysis by Formulation, 2025 and 2035
  • Figure 7: Global Market Y-o-Y Growth Comparison by Formulation, 2025-2035
  • Figure 8: Global Market Attractiveness Analysis by Formulation
  • Figure 9: Global Market Value Share and BPS Analysis by Flavor, 2025 and 2035
  • Figure 10: Global Market Y-o-Y Growth Comparison by Flavor, 2025-2035
  • Figure 11: Global Market Attractiveness Analysis by Flavor
  • Figure 12: Global Market Value Share and BPS Analysis by Product Claim, 2025 and 2035
  • Figure 13: Global Market Y-o-Y Growth Comparison by Product Claim, 2025-2035
  • Figure 14: Global Market Attractiveness Analysis by Product Claim
  • Figure 15: Global Market Value Share and BPS Analysis by Target Demographic, 2025 and 2035
  • Figure 16: Global Market Y-o-Y Growth Comparison by Target Demographic, 2025-2035
  • Figure 17: Global Market Attractiveness Analysis by Target Demographic
  • Figure 18: Global Market Value Share and BPS Analysis by Sweetener Type, 2025 and 2035
  • Figure 19: Global Market Y-o-Y Growth Comparison by Sweetener Type, 2025-2035
  • Figure 20: Global Market Attractiveness Analysis by Sweetener Type
  • Figure 21: Global Market Value Share and BPS Analysis by Dietary Preference, 2025 and 2035
  • Figure 22: Global Market Y-o-Y Growth Comparison by Dietary Preference, 2025-2035
  • Figure 23: Global Market Attractiveness Analysis by Dietary Preference
  • Figure 24: Global Market Value (USD Million) Share and BPS Analysis by Region, 2025 and 2035
  • Figure 25: Global Market Y-o-Y Growth Comparison by Region, 2025-2035
  • Figure 26: Global Market Attractiveness Analysis by Region
  • Figure 27: North America Market Incremental $ Opportunity, 2025-2035
  • Figure 28: Latin America Market Incremental $ Opportunity, 2025-2035
  • Figure 29: Europe Market Incremental $ Opportunity, 2025-2035
  • Figure 30: East Asia Market Incremental $ Opportunity, 2025-2035
  • Figure 31: South Asia & Pacific Market Incremental $ Opportunity, 2025-2035
  • Figure 32: Middle East and Africa Market Incremental $ Opportunity, 2025-2035
  • Figure 33: North America Market Value Share and BPS Analysis by Country, 2025 and 2035
  • Figure 34: North America Market Value Share and BPS Analysis by Dosage Strength, 2025 and 2035
  • Figure 35: North America Market Y-o-Y Growth Comparison by Dosage Strength, 2025-2035
  • Figure 36: North America Market Attractiveness Analysis by Dosage Strength
  • Figure 37: North America Market Value Share and BPS Analysis by Formulation, 2025 and 2035
  • Figure 38: North America Market Y-o-Y Growth Comparison by Formulation, 2025-2035
  • Figure 39: North America Market Attractiveness Analysis by Formulation
  • Figure 40: North America Market Value Share and BPS Analysis by Flavor, 2025 and 2035
  • Figure 41: North America Market Y-o-Y Growth Comparison by Flavor, 2025-2035
  • Figure 42: North America Market Attractiveness Analysis by Flavor
  • Figure 43: North America Market Value Share and BPS Analysis by Product Claim, 2025 and 2035
  • Figure 44: North America Market Y-o-Y Growth Comparison by Product Claim, 2025-2035
  • Figure 45: North America Market Attractiveness Analysis by Product Claim
  • Figure 46: North America Market Value Share and BPS Analysis by Target Demographic, 2025 and 2035
  • Figure 47: North America Market Y-o-Y Growth Comparison by Target Demographic, 2025-2035
  • Figure 48: North America Market Attractiveness Analysis by Target Demographic
  • Figure 49: North America Market Value Share and BPS Analysis by Sweetener Type, 2025 and 2035
  • Figure 50: North America Market Y-o-Y Growth Comparison by Sweetener Type, 2025-2035
  • Figure 51: North America Market Attractiveness Analysis by Sweetener Type
  • Figure 52: North America Market Value Share and BPS Analysis by Dietary Preference, 2025 and 2035
  • Figure 53: North America Market Y-o-Y Growth Comparison by Dietary Preference, 2025-2035
  • Figure 54: North America Market Attractiveness Analysis by Dietary Preference
  • Figure 55: Latin America Market Value Share and BPS Analysis by Country, 2025 and 2035
  • Figure 56: Latin America Market Value Share and BPS Analysis by Dosage Strength, 2025 and 2035
  • Figure 57: Latin America Market Y-o-Y Growth Comparison by Dosage Strength, 2025-2035
  • Figure 58: Latin America Market Attractiveness Analysis by Dosage Strength
  • Figure 59: Latin America Market Value Share and BPS Analysis by Formulation, 2025 and 2035
  • Figure 60: Latin America Market Y-o-Y Growth Comparison by Formulation, 2025-2035
  • Figure 61: Latin America Market Attractiveness Analysis by Formulation
  • Figure 62: Latin America Market Value Share and BPS Analysis by Flavor, 2025 and 2035
  • Figure 63: Latin America Market Y-o-Y Growth Comparison by Flavor, 2025-2035
  • Figure 64: Latin America Market Attractiveness Analysis by Flavor
  • Figure 65: Latin America Market Value Share and BPS Analysis by Product Claim, 2025 and 2035
  • Figure 66: Latin America Market Y-o-Y Growth Comparison by Product Claim, 2025-2035
  • Figure 67: Latin America Market Attractiveness Analysis by Product Claim
  • Figure 68: Latin America Market Value Share and BPS Analysis by Target Demographic, 2025 and 2035
  • Figure 69: Latin America Market Y-o-Y Growth Comparison by Target Demographic, 2025-2035
  • Figure 70: Latin America Market Attractiveness Analysis by Target Demographic
  • Figure 71: Latin America Market Value Share and BPS Analysis by Sweetener Type, 2025 and 2035
  • Figure 72: Latin America Market Y-o-Y Growth Comparison by Sweetener Type, 2025-2035
  • Figure 73: Latin America Market Attractiveness Analysis by Sweetener Type
  • Figure 74: Latin America Market Value Share and BPS Analysis by Dietary Preference, 2025 and 2035
  • Figure 75: Latin America Market Y-o-Y Growth Comparison by Dietary Preference, 2025-2035
  • Figure 76: Latin America Market Attractiveness Analysis by Dietary Preference
  • Figure 77: Europe Market Value Share and BPS Analysis by Country, 2025 and 2035
  • Figure 78: Europe Market Value Share and BPS Analysis by Dosage Strength, 2025 and 2035
  • Figure 79: Europe Market Y-o-Y Growth Comparison by Dosage Strength, 2025-2035
  • Figure 80: Europe Market Attractiveness Analysis by Dosage Strength
  • Figure 81: Europe Market Value Share and BPS Analysis by Formulation, 2025 and 2035
  • Figure 82: Europe Market Y-o-Y Growth Comparison by Formulation, 2025-2035
  • Figure 83: Europe Market Attractiveness Analysis by Formulation
  • Figure 84: Europe Market Value Share and BPS Analysis by Flavor, 2025 and 2035
  • Figure 85: Europe Market Y-o-Y Growth Comparison by Flavor, 2025-2035
  • Figure 86: Europe Market Attractiveness Analysis by Flavor
  • Figure 87: Europe Market Value Share and BPS Analysis by Product Claim, 2025 and 2035
  • Figure 88: Europe Market Y-o-Y Growth Comparison by Product Claim, 2025-2035
  • Figure 89: Europe Market Attractiveness Analysis by Product Claim
  • Figure 90: Europe Market Value Share and BPS Analysis by Target Demographic, 2025 and 2035
  • Figure 91: Europe Market Y-o-Y Growth Comparison by Target Demographic, 2025-2035
  • Figure 92: Europe Market Attractiveness Analysis by Target Demographic
  • Figure 93: Europe Market Value Share and BPS Analysis by Sweetener Type, 2025 and 2035
  • Figure 94: Europe Market Y-o-Y Growth Comparison by Sweetener Type, 2025-2035
  • Figure 95: Europe Market Attractiveness Analysis by Sweetener Type
  • Figure 96: Europe Market Value Share and BPS Analysis by Dietary Preference, 2025 and 2035
  • Figure 97: Europe Market Y-o-Y Growth Comparison by Dietary Preference, 2025-2035
  • Figure 98: Europe Market Attractiveness Analysis by Dietary Preference
  • Figure 99: East Asia Market Value Share and BPS Analysis by Country, 2025 and 2035
  • Figure 100: East Asia Market Value Share and BPS Analysis by Dosage Strength, 2025 and 2035
  • Figure 101: East Asia Market Y-o-Y Growth Comparison by Dosage Strength, 2025-2035
  • Figure 102: East Asia Market Attractiveness Analysis by Dosage Strength
  • Figure 103: East Asia Market Value Share and BPS Analysis by Formulation, 2025 and 2035
  • Figure 104: East Asia Market Y-o-Y Growth Comparison by Formulation, 2025-2035
  • Figure 105: East Asia Market Attractiveness Analysis by Formulation
  • Figure 106: East Asia Market Value Share and BPS Analysis by Flavor, 2025 and 2035
  • Figure 107: East Asia Market Y-o-Y Growth Comparison by Flavor, 2025-2035
  • Figure 108: East Asia Market Attractiveness Analysis by Flavor
  • Figure 109: East Asia Market Value Share and BPS Analysis by Product Claim, 2025 and 2035
  • Figure 110: East Asia Market Y-o-Y Growth Comparison by Product Claim, 2025-2035
  • Figure 111: East Asia Market Attractiveness Analysis by Product Claim
  • Figure 112: East Asia Market Value Share and BPS Analysis by Target Demographic, 2025 and 2035
  • Figure 113: East Asia Market Y-o-Y Growth Comparison by Target Demographic, 2025-2035
  • Figure 114: East Asia Market Attractiveness Analysis by Target Demographic
  • Figure 115: East Asia Market Value Share and BPS Analysis by Sweetener Type, 2025 and 2035
  • Figure 116: East Asia Market Y-o-Y Growth Comparison by Sweetener Type, 2025-2035
  • Figure 117: East Asia Market Attractiveness Analysis by Sweetener Type
  • Figure 118: East Asia Market Value Share and BPS Analysis by Dietary Preference, 2025 and 2035
  • Figure 119: East Asia Market Y-o-Y Growth Comparison by Dietary Preference, 2025-2035
  • Figure 120: East Asia Market Attractiveness Analysis by Dietary Preference
  • Figure 121: South Asia & Pacific Market Value Share and BPS Analysis by Country, 2025 and 2035
  • Figure 122: South Asia & Pacific Market Value Share and BPS Analysis by Dosage Strength, 2025 and 2035
  • Figure 123: South Asia & Pacific Market Y-o-Y Growth Comparison by Dosage Strength, 2025-2035
  • Figure 124: South Asia & Pacific Market Attractiveness Analysis by Dosage Strength
  • Figure 125: South Asia & Pacific Market Value Share and BPS Analysis by Formulation, 2025 and 2035
  • Figure 126: South Asia & Pacific Market Y-o-Y Growth Comparison by Formulation, 2025-2035
  • Figure 127: South Asia & Pacific Market Attractiveness Analysis by Formulation
  • Figure 128: South Asia & Pacific Market Value Share and BPS Analysis by Flavor, 2025 and 2035
  • Figure 129: South Asia & Pacific Market Y-o-Y Growth Comparison by Flavor, 2025-2035
  • Figure 130: South Asia & Pacific Market Attractiveness Analysis by Flavor
  • Figure 131: South Asia & Pacific Market Value Share and BPS Analysis by Product Claim, 2025 and 2035
  • Figure 132: South Asia & Pacific Market Y-o-Y Growth Comparison by Product Claim, 2025-2035
  • Figure 133: South Asia & Pacific Market Attractiveness Analysis by Product Claim
  • Figure 134: South Asia & Pacific Market Value Share and BPS Analysis by Target Demographic, 2025 and 2035
  • Figure 135: South Asia & Pacific Market Y-o-Y Growth Comparison by Target Demographic, 2025-2035
  • Figure 136: South Asia & Pacific Market Attractiveness Analysis by Target Demographic
  • Figure 137: South Asia & Pacific Market Value Share and BPS Analysis by Sweetener Type, 2025 and 2035
  • Figure 138: South Asia & Pacific Market Y-o-Y Growth Comparison by Sweetener Type, 2025-2035
  • Figure 139: South Asia & Pacific Market Attractiveness Analysis by Sweetener Type
  • Figure 140: South Asia & Pacific Market Value Share and BPS Analysis by Dietary Preference, 2025 and 2035
  • Figure 141: South Asia & Pacific Market Y-o-Y Growth Comparison by Dietary Preference, 2025-2035
  • Figure 142: South Asia & Pacific Market Attractiveness Analysis by Dietary Preference
  • Figure 143: Middle East and Africa Market Value Share and BPS Analysis by Country, 2025 and 2035
  • Figure 144: Middle East and Africa Market Value Share and BPS Analysis by Dosage Strength, 2025 and 2035
  • Figure 145: Middle East and Africa Market Y-o-Y Growth Comparison by Dosage Strength, 2025-2035
  • Figure 146: Middle East and Africa Market Attractiveness Analysis by Dosage Strength
  • Figure 147: Middle East and Africa Market Value Share and BPS Analysis by Formulation, 2025 and 2035
  • Figure 148: Middle East and Africa Market Y-o-Y Growth Comparison by Formulation, 2025-2035
  • Figure 149: Middle East and Africa Market Attractiveness Analysis by Formulation
  • Figure 150: Middle East and Africa Market Value Share and BPS Analysis by Flavor, 2025 and 2035
  • Figure 151: Middle East and Africa Market Y-o-Y Growth Comparison by Flavor, 2025-2035
  • Figure 152: Middle East and Africa Market Attractiveness Analysis by Flavor
  • Figure 153: Middle East and Africa Market Value Share and BPS Analysis by Product Claim, 2025 and 2035
  • Figure 154: Middle East and Africa Market Y-o-Y Growth Comparison by Product Claim, 2025-2035
  • Figure 155: Middle East and Africa Market Attractiveness Analysis by Product Claim
  • Figure 156: Middle East and Africa Market Value Share and BPS Analysis by Target Demographic, 2025 and 2035
  • Figure 157: Middle East and Africa Market Y-o-Y Growth Comparison by Target Demographic, 2025-2035
  • Figure 158: Middle East and Africa Market Attractiveness Analysis by Target Demographic
  • Figure 159: Middle East and Africa Market Value Share and BPS Analysis by Sweetener Type, 2025 and 2035
  • Figure 160: Middle East and Africa Market Y-o-Y Growth Comparison by Sweetener Type, 2025-2035
  • Figure 161: Middle East and Africa Market Attractiveness Analysis by Sweetener Type
  • Figure 162: Middle East and Africa Market Value Share and BPS Analysis by Dietary Preference, 2025 and 2035
  • Figure 163: Middle East and Africa Market Y-o-Y Growth Comparison by Dietary Preference, 2025-2035
  • Figure 164: Middle East and Africa Market Attractiveness Analysis by Dietary Preference
  • Figure 165: Global Market - Tier Structure Analysis
  • Figure 166: Global Market - Company Share Analysis

Frequently Asked Questions

How big is the Biotin Gummies Market in 2025?

The global Biotin Gummies Market is estimated to be valued at USD 1.89 billion in 2025, supported by rising demand for beauty-from-within and wellness supplements.

What will be the size of the Biotin Gummies Market in 2035?

The Biotin Gummies Market is projected to reach USD 3.29 billion by 2035, reflecting sustained consumer adoption across hair, skin, and nail health applications.

How much will the Biotin Gummies Market grow between 2025 and 2035?

The Biotin Gummies Market is expected to grow at a CAGR of 6.7% between 2025 and 2035, driven by innovation in sugar-free, vegan, and fortified formulations.

What are the key product types in the Biotin Gummies Market?

Key product types include sugar-free gummies, collagen-infused gummies, vegan plant-based gummies, fortified multivitamin gummies (with biotin), and other specialty formulations.

Which segment will contribute a significant share in the Biotin Gummies Market in 2025?

In 2025, sugar-free gummies are expected to hold the leading share, accounting for 64% of the South Korea market, highlighting consumer preference for clean-label and low-calorie options.

Explore Similar Insights

Future Market Insights

Biotin Gummies Market