Ectoin Gummies Market Size and Share Forecast Outlook 2025 to 2035

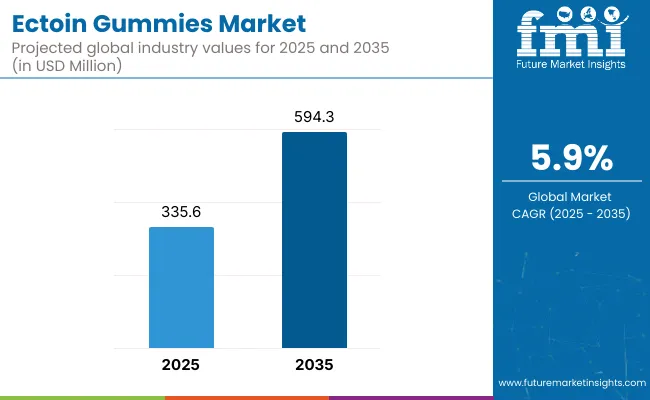
By 2035, the Ectoin Gummies Market is poised to surpass USD 594.3 million, growing from an estimated base of USD 335.6 million in 2025. This transition reflects a cumulative value addition of USD 258.7 million, marking a robust 77% increase in a ten-year span. A steady compound annual growth rate (CAGR) of 5.9% is expected to characterize this trajectory, underlining long-term resilience and growing consumer affinity toward science-backed ingestible skincare.
Quick Stats for Ectoin Gummies Market

  • Ectoin Gummies Market Value (2025): USD 335.6 million
  • Ectoin Gummies Market Forecast Value (2035): USD 594.3 million
  • Ectoin Gummies Market Forecast CAGR: 5.9%
  • Leading Segment in 2025 (Product Type): Immune Support Gummies (25%)
  • Key Growth Regions: Asia-Pacific, North America, Europe
  • Top Key Players: Mibelle Biochemistry, Lonza Group, Ingredia S.A., BASF (Nutraceuticals), Gelita AG, Nutraceutix, Goli Nutrition, Nature’s Way, SmartyPants Vitamins, MaryRuth Organics

Ectoin Gummies Market

Ectoin Gummies Market Key Takeaways

Metric Value
Estimated Value in (2025E) USD 335.6 million
Forecast Value in (2035F) USD 594.3 million
Forecast CAGR (2025 to 2035) 5.9%

The market’s doubling trend signals a growing recognition of ectoin’s cellular protection properties, particularly across wellness-focused consumers and preventative healthcare enthusiasts.

During the initial five-year phase (2025-2030), approximately USD 104 million in value is projected to be added accounting for 40.2% of the total decade growth. This early surge is likely to be fueled by rising demand across online retail channels, with preventive skincare and general wellness trends being rapidly mainstreamed. Ectoin gummies are expected to find strong resonance among digitally native consumers, supported by the influence of functional nutrition and clean-label positioning.

The second half of the forecast period (2030-2035) is anticipated to contribute USD 154.7 million, or 59.8% of total market expansion. Accelerated growth will likely be underpinned by clinical endorsements, regulatory validation across high-income countries, and integration of ectoin into personalized nutrition platforms. Subscription-based delivery models, practitioner-led channels, and neurodermatological use cases are expected to strengthen commercial maturity and long-term consumer retention for ectoin-based nutraceutical formats, particularly gummies.

From 2020 to 2024, the Ectoin Gummies Market evolved from an ingredient-centric innovation cycle into a consumer-facing nutraceutical format, with global awareness around ectoin’s cellular protection properties fueling early-stage growth. During this period, active ingredient suppliers and CDMO partnerships accounted for over 75% of value generation, driven by formulation development and early-phase product commercialization. Competitive differentiation centered on scientific validation, safety claims, and bioavailability, while brand-led consumer marketing remained limited to early adopters.

Demand is expected to rise to USD 335.6 million by 2025, with the revenue mix shifting toward consumer brands and personalized supplement platforms. By 2035, value creation will increasingly be driven by AI-curated stacks, beauty-from-within personalization, and clean-label formulation ecosystems. Traditional raw material leaders are adapting through co-branding and B2B2C models, while emerging D2C players are capturing share through subscription models, adaptive dosing, and lifestyle-led positioning.

Competitive advantage will continue to transition from ingredient purity alone to integrated offerings that emphasize regulatory transparency, clinical utility, and consumer personalization defining a new standard for performance-linked nutraceuticals.

Why the Ectoin Gummies Market is growing?

Significant momentum has been observed in the Ectoin Gummies Market, primarily driven by growing consumer awareness regarding cellular health and oxidative stress protection. The increasing preference for oral skincare and ingestible beauty supplements has been influenced by the broader wellness convergence between nutrition and dermatology.

Ectoin, known for its cytoprotective and anti-inflammatory properties, has been positioned as a next-generation bioactive, particularly in regions where preventive health has gained mainstream adoption.

Clinical validation of ectoin's efficacy in reducing cellular damage, especially under environmental stressors like UV exposure and pollution, has been extensively highlighted in dermatological research. In parallel, online retail ecosystems have amplified product accessibility and education, fostering rapid adoption among tech-savvy and health-conscious consumers.

Innovation in gummy supplement delivery formats offering both taste and therapeutic appeal has further reinforced market traction. As regulatory frameworks evolve to support functional nutraceutical claims, a stronger foothold for ectoin-based products is expected across global healthcare and wellness sectors.

Segmental Analysis

The Ectoin Gummies Market has been comprehensively segmented across product type, formulation type, and sales channel, reflecting a nuanced understanding of consumer health preferences and delivery innovations. The product type segmentation captures therapeutic intent, including immune support, beauty enhancement, anti-inflammatory functions, and cellular protection.

Formulation type distinguishes between consumer lifestyle preferences and dietary restrictions addressing needs for vegan, sugar-free, and organic formats. Meanwhile, sales channel segmentation identifies access points, from physical pharmacies and supermarkets to digital-first platforms such as online retail and direct-to-consumer (D2C) models. Each segment highlights the evolving consumer expectations and commercialization strategies that are shaping the trajectory of ectoin-based supplement delivery systems.
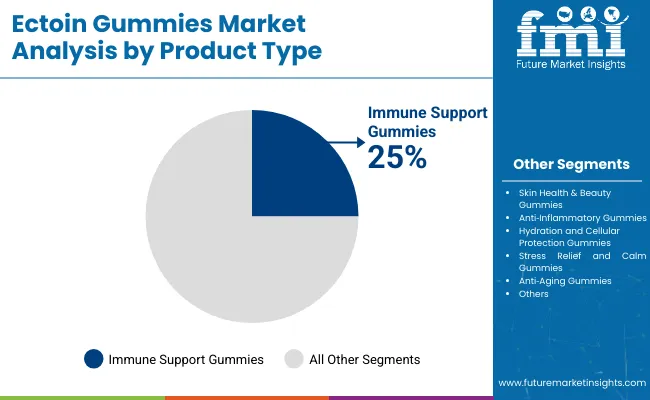
Insights into the Product Type Segment with Immune Support Leading

Ectoin Gummies Market By Product

Product Type 2025 Share %
Immune Support Gummies 25%
Skin Health & Beauty Gummies 20%
Anti Inflammatory Gummies 15%
Hydration & Cellular Protection Gummies 10%
Stress Relief & Calm Gummies 15%
Anti Aging Gummies 15%

The immune support gummies segment is expected to command 25% of market value in 2025, establishing itself as the dominant product type. Growth within this category has been influenced by heightened health consciousness post-pandemic and sustained demand for supplements that reinforce innate immunity.

Ectoin’s clinically studied protective effects against cellular stress and inflammation have positioned it favorably in immune-enhancing formats. The segment is likely to benefit from dual-function formulations that merge immune support with daily wellness, providing both preventative and therapeutic appeal. Continued innovation in flavor masking, dosing accuracy, and shelf-life stability is expected to sustain consumer trust and repeat purchase behavior.
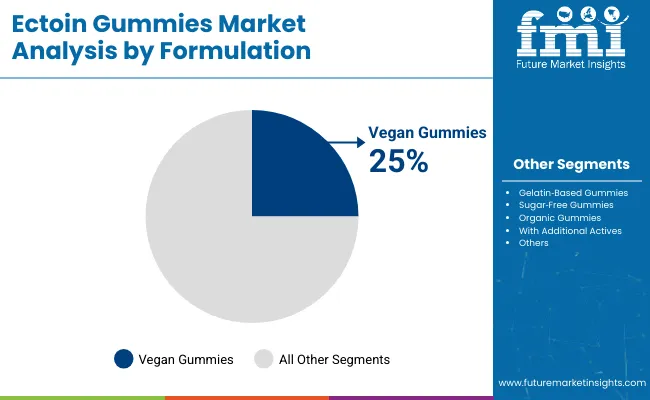
Insights into the Formulation Segment with Gelatin-Based Gummies in the Lead

Ectoin Gummies Market By Formulation

Formulation Type 2025 Share %
Vegan Gummies 25%
Gelatin Based Gummies 30%
Sugar Free Gummies 15%
Organic Gummies 10%
With Additional Actives 20%

The gelatin-based formulation is projected to dominate with a 30% share in 2025, supported by its widespread manufacturing scalability and consumer familiarity. This formulation type has been widely adopted due to its flexibility in shaping, chewability, and active ingredient stability.

As ectoin remains sensitive to processing conditions, gelatin matrices have provided a reliable medium to ensure bioavailability and structural integrity. However, rising ethical and dietary shifts are encouraging reformulation efforts. Despite this, the gelatin-based segment is expected to remain relevant due to its cost-effectiveness, product stability, and broad consumer acceptance in both developed and emerging markets.
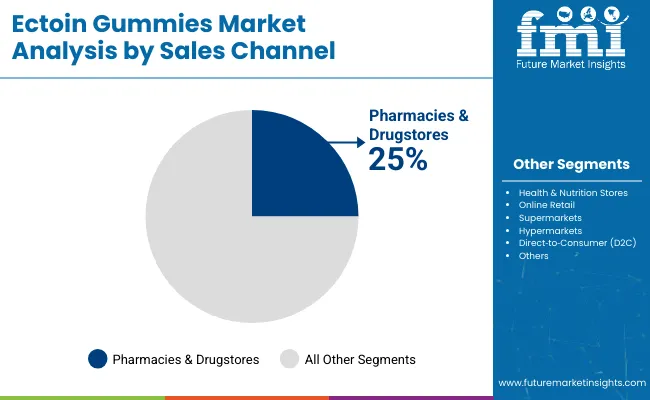
Insights into the Sales Channel Segment with Online Retail Taking the Lead

Ectoin Gummies Market By Sales

Sales Channel 2025 Share %
Pharmacies & Drugstores 25%
Health & Nutrition Stores 20%
Online Retail 30%
Supermarkets & Hypermarkets 15%
Direct to Consumer (D2C) 10%

Online retail is forecasted to capture the largest market share at 30% in 2025, emerging as the preferred distribution channel for ectoin gummies. The rapid adoption of e-commerce platforms has been enabled by consumers’ increasing comfort with self-care purchases, particularly those associated with skincare, immunity, and relaxation. Enhanced product education through digital content, influencer-led testimonials, and algorithm-driven personalization has further accelerated demand.

Subscription models, bundling offers, and auto-refill mechanisms are also supporting market retention. As transparency, lab-certification access, and ingredient traceability become standard, online platforms are expected to play a pivotal role in democratizing access to premium nutraceuticals like ectoin.

What are the Drivers, Restraints, and Key Trends of the Ectoin Gummies Market?

Although ectoin gummies are gaining attention for their skin health and cellular resilience benefits, market expansion continues to be shaped by evolving consumer expectations, regulatory scrutiny, and innovation pacing across supplement formats, personalization platforms, and wellness-driven retail ecosystems.

Integration of Ectoin into Personalized Nutritional Platforms

Demand has been shaped by the rising convergence of ectoin formulations with personalized nutrition diagnostics and DNA-based supplement recommendations. Ectoin’s ability to modulate stress proteins and cellular responses has been positioned as ideal for preventive care routines tailored to individual biochemistry.

Forward-thinking supplement brands have already embedded ectoin into AI-curated regimens that adjust dosage frequency based on real-time biomarker readings. This trend is being accelerated by increasing adoption of at-home blood tests and microbiome kits, enabling data-driven delivery of targeted actives.

The credibility of ectoin in both dermatological and systemic wellness applications has allowed it to stand apart in the bioactive hierarchy. As consumer expectations shift toward evidence-based and precision-oriented wellness solutions, platforms integrating ectoin are expected to expand significantly.

Convergence of Ectoin with Neurodermatology and Stress-Cognition Interventions

A key market trend has emerged from ectoin’s repositioning in neurodermatological applications, linking skin health with emotional well-being. Ectoin’s role in reducing cortisol-related skin sensitivity and maintaining cellular hydration under psychological stress has attracted formulators focusing on stress-adaptive nutrition.

Gummies combining ectoin with nootropic ingredients such as L-theanine and GABA are already being piloted for users facing chronic anxiety and burnout. This psycho-dermatological convergence is being actively explored in functional food R&D pipelines. Given rising mental health concerns globally, this dual-action model is expected to unlock new verticals for ectoin gummies especially in workplace wellness, academic performance, and adolescent stress management spaces.
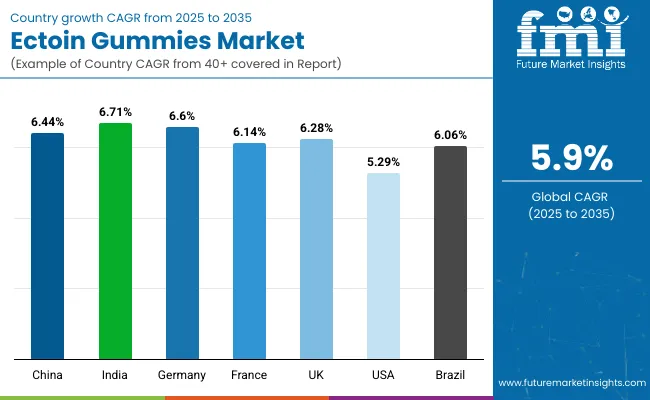
Analysis of Ectoin Gummies Market By Key Countries

Ectoin Gummies Market By Country

Countries CAGR (2025 to 2035)
China 6.44%
India 6.71%
Germany 6.60%
France 6.14%
UK 6.28%
USA 5.29%
Brazil 6.06%

The global Ectoin Gummies Market is experiencing varied growth trajectories across key economies, shaped by differences in nutraceutical regulation, preventive health uptake, and functional ingredient innovation pipelines. Regional momentum has been notably influenced by consumer access to premium wellness products, public health positioning of oral skincare, and digitized supplement delivery models.

India is expected to lead with a CAGR of 6.71%, supported by its rapidly growing urban wellness economy and increased investments in ingredient-backed nutraceuticals by D2C brands. Ectoin gummies are being adopted as lifestyle-focused, anti-pollution formats in high-density metros, where skin barrier protection has gained clinical and cosmetic attention.

Germany (CAGR: 6.60%) and the UK (6.28%) are forecasted to remain central to Europe’s growth narrative, due to their rigorous skincare supplement validation protocols and high demand for vegan, dermatologically endorsed formulations. Market penetration is further advanced through pharmacy-led consumer education and practitioner-guided trials.

China, at a CAGR of 6.44%, reflects strategic scale-up driven by TCM-modernization synergies, while France (6.14%) shows strong alignment with cosmeceutical crossover applications. Brazil (6.06%) and the USA (5.29%) are projected to deliver steady growth, fueled by evolving regulatory clarity and increasing premium shelf space for multifunctional gummies. A differentiated mix of science-driven branding and clean-label innovation will be critical in sustaining momentum across these diverse markets.

Sales Outlook for Ectoin Gummies in the United States

Years 2025 2026 2027 2028 2029 2030 2031 2032 2033 2034 2035
USA 80.54 85.5 89.9 95.9 101.6 106.7 112.1 119.0 126.1 134.5 141.8

The Ectoin Gummies Market in the United States is projected to expand from USD 80.54 million in 2025 to USD 141.80 million in 2035, advancing at a CAGR of 5.8%. Growth is being shaped by clinical interest in ectoin’s cellular stress mitigation, as well as its ability to support dermal health under environmental pressure. This market’s progression has been bolstered by innovation in multi-functional nutraceuticals, with stress-relief, skin hydration, and immunity being bundled in a single daily format.

Widespread adoption of ectoin gummies has been increasingly observed within practitioner-led anti-aging clinics, where dermatologists and functional medicine professionals are recommending these products as part of long-term skin barrier management.

Additionally, dental wellness platforms and tele-nutrition services have started incorporating ectoin supplements into subscription kits targeted at oral mucosa hydration and systemic inflammation reduction. Partnerships between clinical labs and e-commerce players have further enabled tailored offerings based on skin sensitivity biomarkers.

  • Ectoin gummies are being endorsed by USA dermatologists as preventive interventions against urban pollution.
  • Functional D2C startups are bundling ectoin into stress-beauty hybrid formats for subscription delivery.
  • Pharmacies are scaling shelf space allocation to ectoin SKUs backed by USA clinical claims.

Growth and Expansion Outlook for Ectoin Gummies Market in the United Kingdom

A CAGR of 6.28% is forecasted for the UK’s Ectoin Gummies Market between 2025 and 2035, reflecting robust alignment with cosmeceutical wellness trends and dermatological supplementation. Growth is being supported by clinical preference for oral skin-barrier protection and consumer trust in bioactive-driven skincare formats.

  • Ectoin gummies are being positioned as daily-use formulations for urban professionals facing environmental stress and skin fatigue.
  • UK-based nutraceutical startups are embedding ectoin in personalized health kits, often bundled with collagen, biotin, and adaptogens.
  • Retail pharmacists and nutritionists have begun actively endorsing ectoin-based products, given their dual-action skin-hydration and inflammation-reduction benefits.
  • The presence of advanced clean-label regulatory frameworks is encouraging transparent sourcing, allowing ectoin to gain credibility faster than other newer actives.

Growth and Expansion Outlook for Ectoin Gummies Market in India

India’s Ectoin Gummies Market is projected to grow at a CAGR of 6.71%, driven by increasing urban exposure to skin stressors and rising disposable income among wellness-conscious millennials. The functional gummies format has gained traction as a culturally palatable alternative to capsules or tablets.

  • Ectoin is being increasingly adopted in India’s premium anti-pollution nutraceuticals, especially in metro cities such as Delhi and Mumbai, where skin sensitivity is a growing concern.
  • Domestic D2C brands are integrating ectoin into Ayurveda-modernized SKUs, combining traditional adaptogens with science-backed actives for credibility and appeal.
  • Subscription commerce models are enabling high re-purchase rates, supported by influencer-led trust-building in the dermatology space.
  • Pharma-led supplement chains and skin clinics are piloting ectoin-based gummies in curated offerings, often co-branded with dermatologists.

Sales Outlook for Ectoin Gummies in China

With a CAGR of 6.44% forecasted between 2025 to 2035, China is expected to remain a pivotal player in shaping the global ectoin gummies landscape, particularly through scale and regulatory experimentation. The ingredient is being actively positioned within the next-gen TCM (Traditional Chinese Medicine) innovation framework.

  • High pollution levels and skin hypersensitivity across urban zones are reinforcing demand for cellular hydration-based supplements like ectoin.
  • Chinese OEMs are integrating ectoin into multi-layered gummy formats that blend Eastern herbal ingredients with European actives.
  • Cross-border e-commerce platforms are facilitating the import of EU-approved ectoin formulations, accelerating consumer education.
  • Regulatory pilots under China’s functional food schemes are being explored to classify ectoin under skin-protective nutraceuticals, enabling new claim categories.

In-depth Analysis of Ectoin Gummies in Germany

Countries 2025 2035
UK 18.72% 18.24%
Germany 20.90% 20.41%
Italy 9.18% 10.31%
France 14.65% 12.20%
Spain 10.50% 11.44%
BENELUX 6.74% 5.92%
Nordic 5.81% 5.20%
Rest of Europe 13% 16%

A CAGR of 6.60% is projected for Germany’s Ectoin Gummies Market, supported by the country’s well-established footprint in both skincare innovation and high-purity nutraceutical manufacturing. Growth is expected to be strongly pharmacy-led, with physician trust playing a central role in adoption.

  • Ectoin has been integrated into clinical-grade wellness programs, targeting patients with skin inflammation, sun intolerance, or dermatological sensitivities.
  • German biotech firms are collaborating with supplement manufacturers to co-develop targeted ectoin delivery systems with improved bioavailability.
  • The vegan formulation trend has catalyzed the use of ectoin in sugar-free, plant-based gummy formats, aligned with clean-label demands.
  • Pharmacist endorsements and inclusion in dermatology-backed subscription kits are helping maintain consumer trust and recurring usage patterns.

Growth Outlook for Ectoin Gummies Market in Japan

Product Type 2025 Share %
Immune Support Gummies 26%
Skin Health & Beauty Gummies 22%
Anti Inflammatory Gummies 14%
Hydration & Cellular Protection Gummies 10%
Stress Relief & Calm Gummies 14%
Anti Aging Gummies 14%

The ectoin gummies market in South Korea is projected to reach a valuation of US$ 3.22 million by 2025. Among the leading product formats, gelatin-based gummies are expected to maintain the top position, capturing approximately 30% of the market share due to their established formulation base and consumer familiarity. Close behind, vegan gummies are gaining rapid momentum, accounting for nearly 28% of the market, and expanding at an impressive compound annual growth rate (CAGR) of 9.8%.

The vegan gummy segment, forecasted to expand at a CAGR of 9.8%, is expected to gain further momentum as plant-based and cruelty-free claims become central to consumer purchase decisions. Meanwhile, gelatin-based gummies are projected to retain substantial market presence due to familiarity, superior chewability, and established formulation infrastructure.

Gummies with additional actives, capturing 19% share, are being increasingly adopted in multifunctional SKUs that combine ectoin with ceramides, probiotics, or adaptogens catering to consumers seeking synergy between beauty, stress resilience, and immune modulation. Rapid urbanization and digital wellness platforms are reshaping purchase behavior, with personalization and ingredient traceability emerging as critical drivers of brand loyalty.

  • The South Korea ectoin gummies market is projected to reach a value of US$ 3.22 million by 2025.
  • Gelatin-based gummies are expected to lead the market with a 30% share, driven by their established formulation infrastructure and consumer familiarity.
  • Vegan gummies are emerging as a strong alternative, expected to capture 28% of the market by 2025, while registering a CAGR of 9.8%.
  • Gummies formulated with additional active ingredients such as ceramides, adaptogens, or probiotics are projected to hold a 19% market share, expanding at a CAGR of 9.9%.

Opportunity Analysis of South Korea Ectoin Gummies Market

Formulation Type 2025 Share %
Vegan Gummies 28%
Gelatin Based Gummies 30%
Sugar Free Gummies 14%
Organic Gummies 9%
With Additional Actives 19%

The Ectoin Gummies Market in Japan is projected to reach USD 5.64 million in 2025, reflecting a strong orientation toward functional beauty, stress modulation, and graceful aging. The immune support segment, leading with 26% share, is expected to maintain its momentum through clinical positioning of ectoin as a cell-protective agent under oxidative and inflammatory stress. Meanwhile, skin health & beauty gummies, holding a 22% share, have seen rapid consumer adoption driven by Japan’s advanced dermaceutical culture, where oral beauty is considered an extension of topical regimens.

The anti-aging segment (14%) is supported by ectoin’s reputation for hydration retention and stress protein modulation, both highly valued in the country's wellness and longevity markets. Japanese consumers are displaying a strong preference for multi-functional nutraceuticals that align with aesthetic health goals, leading brands to focus on combining ectoin with collagen, hyaluronic acid, and plant-based antioxidants.

  • Japan accounts for approximately 1.7% share of the global market in 2025.
  • Immune support (26%) and skin beauty (22%) are the dominant categories.
  • Growth is driven by longevity-focused consumers and dermaceutical product alignment.
  • Innovation is expected to center on vegan, sugar-free formats with clinical-grade substantiation.

Competitive Landscape of Ectoin Gummies Market

Suppliers Global Value Share 2025
Bloomage Biotechnology 26%
Others 74%

The Ectoin Gummies Market is moderately fragmented, comprising active ingredient pioneers, contract manufacturers, and brand-forward nutraceutical players operating across functional health domains. Ingredient innovation is being led by suppliers such as Mibelle Biochemistry and Lonza Group, who have positioned ectoin as a premium stress-protective molecule through patented extraction methods and clinical validation pipelines. Their partnerships with formulation experts and private-label manufacturers are enabling broad-spectrum integration into gummy formats.

Mid-sized operators like Ingredia S.A., Gelita AG, and Nutraceutix are supporting market growth through contract development and manufacturing services (CDMOs), offering formulation support, stability testing, and compliance advisory for functional confectionery. Their ability to tailor dosage forms and preserve bioactivity during thermal processing is viewed as a strategic advantage in a crowded delivery format space.

Brand-focused consumer players such as Goli Nutrition, Nature’s Way, SmartyPants Vitamins, and MaryRuth Organics are actively incorporating ectoin into beauty-from-within and stress-calm portfolios, leveraging influencer-led positioning and clean-label narratives. Innovation pipelines are increasingly focused on multi-ingredient stacking, sugar-free matrix engineering, and subscription-based distribution models.

Competitive advantage is expected to shift from standalone ingredient claims to ecosystem-led differentiation including personalized dosing platforms, biomarker-linked user feedback loops, and transparent sourcing protocols for next-gen nutraceuticals.

Key Developments in Ectoin Gummies Market

  • In January 2025, ectoin was formally identified by leading skincare publications as one of the major ingredient trends of the year, with anticipation that its use across functional cosmetics and ingestibles would rise dramatically.
  • In April 2025, a detailed expert feature in PopSugar UK described ectoin as “an ingredient on the rise,” especially beneficial for stressed, irritated, and sensitive skin, signaling broader validation and expected uptick in incorporation into nutraceutical formats like gummies.

Scope of the Report

Item Value
Quantitative Units USD 594.3 million (by 2035)
Product Type Immune Support, Skin Health & Beauty, Anti-Inflammatory, Hydration & Cellular Protection, Stress Relief & Calm, Anti-Aging
Formulation Type Gelatin-Based Gummies, Vegan Gummies, Sugar-Free, Organic, With Additional Actives
Sales Channel Pharmacies & Drugstores, Health & Nutrition Stores, Online Retail, Supermarkets & Hypermarkets, Direct-to-Consumer (D2C)
Application Focus Skin Barrier Protection, Anti-Stress Supplementation, Anti-Aging Support, Hydration Therapy, Immune System Modulation
Consumer Segments Urban Millennials, Aging Adults, Beauty-Driven Consumers, Stress-Prone Professionals, Clean-Label Seekers
Regions Covered North America, Europe, Asia-Pacific, Latin America, Middle East & Africa
Countries Covered United States, Canada, United Kingdom, Germany, France, China, Japan, India, Brazil, South Korea
Key Companies Profiled Mibelle Biochemistry, Lonza Group, Ingredia S.A., BASF (Nutraceuticals), Gelita AG, Nutraceutix, Goli Nutrition, Nature’s Way, SmartyPants Vitamins, MaryRuth Organics
Additional Attributes Ingredient sourcing trends (biotech-origin ectoin), consumer shift toward vegan & sugar-free formats, functional layering (ectoin + adaptogens), rise of personalized gummy subscriptions, clean-label compliance, regulatory support in Europe and Asia, K-beauty and J-beauty influence on product design, ectoin’s proven dermal stress protection in nutraceutical use cases

Key Segments

By Product Type:

  • Immune Support Gummies
  • Skin Health & Beauty Gummies
  • Anti-Inflammatory Gummies
  • Hydration & Cellular Protection Gummies
  • Stress Relief & Calm Gummies
  • Anti-Aging Gummies

By Ectoin Concentration:

  • Low Dose (up to 50 mg per serving)
  • Medium Dose (50–150 mg per serving)
  • High Dose (150 mg and above per serving)

By Formulation:

  • Vegan Gummies
  • Gelatin-Based Gummies
  • Sugar-Free Gummies
  • Organic Gummies
  • With Additional Actives (Vitamin C, Zinc, Hyaluronic Acid, Collagen, etc.)

By Target Consumer:

  • Adults
  • Children
  • Seniors

By Sales Channel:

  • Pharmacies & Drugstores
  • Health & Nutrition Stores
  • Online Retail
  • Supermarkets & Hypermarkets
  • Direct-to-Consumer (D2C)

By Packaging Type:

  • Bottles (30, 60, 90 count)
  • Sachets/Single-Serve Packs
  • Multi-Pack Bundles

By Region:

  • North America
  • Latin America
  • Europe
  • East Asia
  • South Asia & Pacific
  • MEA

Table of Content

  1. Executive Summary
    • Global Market Outlook
    • Demand-side Trends
    • Supply-side Trends
    • Technology Roadmap Analysis
    • Analysis and Recommendations
  2. Market Overview
    • Market Coverage / Taxonomy
    • Market Definition / Scope / Limitations
  3. Market Background
    • Market Dynamics
      • Drivers
      • Restraints
      • Opportunity
      • Trends
    • Scenario Forecast
      • Demand in Optimistic Scenario
      • Demand in Likely Scenario
      • Demand in Conservative Scenario
    • Opportunity Map Analysis
    • Product Life Cycle Analysis
    • Supply Chain Analysis
      • Supply Side Participants and their Roles
        • Producers
        • Mid-Level Participants (Traders/ Agents/ Brokers)
        • Wholesalers and Distributors
      • Value Added and Value Created at Node in the Supply Chain
      • List of Raw Material Suppliers
      • List of Existing and Potential Buyer’s
    • Investment Feasibility Matrix
    • Value Chain Analysis
      • Profit Margin Analysis
      • Wholesalers and Distributors
      • Retailers
    • PESTLE and Porter’s Analysis
    • Regulatory Landscape
      • By Key Regions
      • By Key Countries
    • Regional Parent Market Outlook
    • Production and Consumption Statistics
    • Import and Export Statistics
  4. Global Analysis 2020 to 2024 and Forecast, 2025 to 2035
    • Historical Market Size Value (USD Million) & Volume (Units) Analysis, 2020 to 2024
    • Current and Future Market Size Value (USD Million) & Volume (Units) Projections, 2025 to 2035
      • Y-o-Y Growth Trend Analysis
      • Absolute $ Opportunity Analysis
  5. Global Analysis 2020 to 2024 and Forecast 2025 to 2035, By Product Type
    • Introduction / Key Findings
    • Historical Market Size Value (USD Million) & Volume (Units) Analysis By Product Type, 2020 to 2024
    • Current and Future Market Size Value (USD Million) & Volume (Units) Analysis and Forecast By Product Type, 2025 to 2035
      • Immune Support Gummies
      • Skin Health & Beauty Gummies
      • Anti-Inflammatory Gummies
      • Hydration & Cellular Protection Gummies
      • Stress Relief & Calm Gummies
      • Anti-Aging Gummies
    • Y-o-Y Growth Trend Analysis By Product Type, 2020 to 2024
    • Absolute $ Opportunity Analysis By Product Type, 2025 to 2035
  6. Global Analysis 2020 to 2024 and Forecast 2025 to 2035, By Ectoin Concentration
    • Introduction / Key Findings
    • Historical Market Size Value (USD Million) & Volume (Units) Analysis By Ectoin Concentration, 2020 to 2024
    • Current and Future Market Size Value (USD Million) & Volume (Units) Analysis and Forecast By Ectoin Concentration, 2025 to 2035
      • Low Dose (up to 50 mg per serving)
      • Medium Dose (50–150 mg per serving)
      • High Dose (150 mg and above per serving)
    • Y-o-Y Growth Trend Analysis By Ectoin Concentration, 2020 to 2024
    • Absolute $ Opportunity Analysis By Ectoin Concentration, 2025 to 2035
  7. Global Analysis 2020 to 2024 and Forecast 2025 to 2035, By Formulation
    • Introduction / Key Findings
    • Historical Market Size Value (USD Million) & Volume (Units) Analysis By Formulation, 2020 to 2024
    • Current and Future Market Size Value (USD Million) & Volume (Units) Analysis and Forecast By Formulation, 2025 to 2035
      • Vegan Gummies
      • Gelatin-Based Gummies
      • Sugar-Free Gummies
      • Organic Gummies
      • With Additional Actives (Vitamin C, Zinc, Hyaluronic Acid, Collagen, etc.)
    • Y-o-Y Growth Trend Analysis By Formulation, 2020 to 2024
    • Absolute $ Opportunity Analysis By Formulation, 2025 to 2035
  8. Global Analysis 2020 to 2024 and Forecast 2025 to 2035, By Target Consumer
    • Introduction / Key Findings
    • Historical Market Size Value (USD Million) & Volume (Units) Analysis By Target Consumer, 2020 to 2024
    • Current and Future Market Size Value (USD Million) & Volume (Units) Analysis and Forecast By Target Consumer, 2025 to 2035
      • Adults
      • Children
      • Seniors
    • Y-o-Y Growth Trend Analysis By Target Consumer, 2020 to 2024
    • Absolute $ Opportunity Analysis By Target Consumer, 2025 to 2035
  9. Global Analysis 2020 to 2024 and Forecast 2025 to 2035, By Sales Channel
    • Introduction / Key Findings
    • Historical Market Size Value (USD Million) & Volume (Units) Analysis By Sales Channel, 2020 to 2024
    • Current and Future Market Size Value (USD Million) & Volume (Units) Analysis and Forecast By Sales Channel, 2025 to 2035
      • Pharmacies & Drugstores
      • Health & Nutrition Stores
      • Online Retail
      • Supermarkets & Hypermarkets
      • Direct-to-Consumer (D2C)
    • Y-o-Y Growth Trend Analysis By Sales Channel, 2020 to 2024
    • Absolute $ Opportunity Analysis By Sales Channel, 2025 to 2035
  10. Global Analysis 2020 to 2024 and Forecast 2025 to 2035, By Packaging Type
    • Introduction / Key Findings
    • Historical Market Size Value (USD Million) & Volume (Units) Analysis By Packaging Type, 2020 to 2024
    • Current and Future Market Size Value (USD Million) & Volume (Units) Analysis and Forecast By Packaging Type, 2025 to 2035
      • Bottles (30, 60, 90 count)
      • Sachets/Single-Serve Packs
      • Multi-Pack Bundles
    • Y-o-Y Growth Trend Analysis By Packaging Type, 2020 to 2024
    • Absolute $ Opportunity Analysis By Packaging Type, 2025 to 2035
  11. Global Analysis 2020 to 2024 and Forecast 2025 to 2035, By Region
    • Introduction
    • Historical Market Size Value (USD Million) & Volume (Units) Analysis By Region, 2020 to 2024
    • Current Market Size Value (USD Million) & Volume (Units) Analysis and Forecast By Region, 2025 to 2035
      • North America
      • Latin America
      • Europe
      • East Asia
      • South Asia & Pacific
      • MEA
    • Market Attractiveness Analysis By Region
  12. North America Analysis 2020 to 2024 and Forecast 2025 to 2035, By Country
    • Historical Market Size Value (USD Million) & Volume (Units) Trend Analysis By Market Taxonomy, 2020 to 2024
    • Market Size Value (USD Million) & Volume (Units) Forecast By Market Taxonomy, 2025 to 2035
      • By Country
        • USA
        • Canada
      • By Product Type
      • By Ectoin Concentration
      • By Formulation
      • By Target Consumer
      • By Sales Channel
      • By Packaging Type
    • Market Attractiveness Analysis
      • By Country
      • By Product Type
      • By Ectoin Concentration
      • By Formulation
      • By Target Consumer
      • By Sales Channel
      • By Packaging Type
    • Key Takeaways
  13. Latin America Analysis 2020 to 2024 and Forecast 2025 to 2035, By Country
    • Historical Market Size Value (USD Million) & Volume (Units) Trend Analysis By Market Taxonomy, 2020 to 2024
    • Market Size Value (USD Million) & Volume (Units) Forecast By Market Taxonomy, 2025 to 2035
      • By Country
        • Brazil
        • Mexico
        • Colombia
        • Rest of Latin America
      • By Product Type
      • By Ectoin Concentration
      • By Formulation
      • By Target Consumer
      • By Sales Channel
      • By Packaging Type
    • Market Attractiveness Analysis
      • By Country
      • By Product Type
      • By Ectoin Concentration
      • By Formulation
      • By Target Consumer
      • By Sales Channel
      • By Packaging Type
    • Key Takeaways
  14. Europe Analysis 2020 to 2024 and Forecast 2025 to 2035, By Country
    • Historical Market Size Value (USD Million) & Volume (Units) Trend Analysis By Market Taxonomy, 2020 to 2024
    • Market Size Value (USD Million) & Volume (Units) Forecast By Market Taxonomy, 2025 to 2035
      • By Country
        • Germany
        • UK
        • France
        • Italy
        • Spain
        • Belgium
        • Netherlands
        • Nordic
        • Switzerland
        • Russia
        • Poland
        • Rest of Europe
      • By Product Type
      • By Ectoin Concentration
      • By Formulation
      • By Target Consumer
      • By Sales Channel
      • By Packaging Type
    • Market Attractiveness Analysis
      • By Country
      • By Product Type
      • By Ectoin Concentration
      • By Formulation
      • By Target Consumer
      • By Sales Channel
      • By Packaging Type
    • Key Takeaways
  15. East Asia Analysis 2020 to 2024 and Forecast 2025 to 2035, By Country
    • Historical Market Size Value (USD Million) & Volume (Units) Trend Analysis By Market Taxonomy, 2020 to 2024
    • Market Size Value (USD Million) & Volume (Units) Forecast By Market Taxonomy, 2025 to 2035
      • By Country
        • China
        • Japan
        • South Korea
      • By Product Type
      • By Ectoin Concentration
      • By Formulation
      • By Target Consumer
      • By Sales Channel
      • By Packaging Type
    • Market Attractiveness Analysis
      • By Country
      • By Product Type
      • By Ectoin Concentration
      • By Formulation
      • By Target Consumer
      • By Sales Channel
      • By Packaging Type
    • Key Takeaways
  16. South Asia & Pacific Analysis 2020 to 2024 and Forecast 2025 to 2035, By Country
    • Historical Market Size Value (USD Million) & Volume (Units) Trend Analysis By Market Taxonomy, 2020 to 2024
    • Market Size Value (USD Million) & Volume (Units) Forecast By Market Taxonomy, 2025 to 2035
      • By Country
        • India
        • Thailand
        • Malaysia
        • Indonesia
        • Singapore
        • Vietnam
        • Australia
        • New Zealand
        • Rest of South Asia
      • By Product Type
      • By Ectoin Concentration
      • By Formulation
      • By Target Consumer
      • By Sales Channel
      • By Packaging Type
    • Market Attractiveness Analysis
      • By Country
      • By Product Type
      • By Ectoin Concentration
      • By Formulation
      • By Target Consumer
      • By Sales Channel
      • By Packaging Type
    • Key Takeaways
  17. MEA Analysis 2020 to 2024 and Forecast 2025 to 2035, By Country
    • Historical Market Size Value (USD Million) & Volume (Units) Trend Analysis By Market Taxonomy, 2020 to 2024
    • Market Size Value (USD Million) & Volume (Units) Forecast By Market Taxonomy, 2025 to 2035
      • By Country
        • Turkey
        • UAE
        • Saudi Arabia
        • Israel
        • Other GCC Countries
        • North Africa
        • South Africa
        • Central Africa
        • Rest of MEA
      • By Product Type
      • By Ectoin Concentration
      • By Formulation
      • By Target Consumer
      • By Sales Channel
      • By Packaging Type
    • Market Attractiveness Analysis
      • By Country
      • By Product Type
      • By Ectoin Concentration
      • By Formulation
      • By Target Consumer
      • By Sales Channel
      • By Packaging Type
    • Key Takeaways
  18. Key Countries Analysis
    • USA
      • Pricing Analysis
      • Market Share Analysis, 2024
        • By Product Type
        • By Ectoin Concentration
        • By Formulation
        • By Target Consumer
        • By Sales Channel
        • By Packaging Type
    • Canada
      • Pricing Analysis
      • Market Share Analysis, 2024
        • By Product Type
        • By Ectoin Concentration
        • By Formulation
        • By Target Consumer
        • By Sales Channel
        • By Packaging Type
    • Brazil
      • Pricing Analysis
      • Market Share Analysis, 2024
        • By Product Type
        • By Ectoin Concentration
        • By Formulation
        • By Target Consumer
        • By Sales Channel
        • By Packaging Type
    • Mexico
      • Pricing Analysis
      • Market Share Analysis, 2024
        • By Product Type
        • By Ectoin Concentration
        • By Formulation
        • By Target Consumer
        • By Sales Channel
        • By Packaging Type
    • Colombia
      • Pricing Analysis
      • Market Share Analysis, 2024
        • By Product Type
        • By Ectoin Concentration
        • By Formulation
        • By Target Consumer
        • By Sales Channel
        • By Packaging Type
    • Germany
      • Pricing Analysis
      • Market Share Analysis, 2024
        • By Product Type
        • By Ectoin Concentration
        • By Formulation
        • By Target Consumer
        • By Sales Channel
        • By Packaging Type
    • UK
      • Pricing Analysis
      • Market Share Analysis, 2024
        • By Product Type
        • By Ectoin Concentration
        • By Formulation
        • By Target Consumer
        • By Sales Channel
        • By Packaging Type
    • France
      • Pricing Analysis
      • Market Share Analysis, 2024
        • By Product Type
        • By Ectoin Concentration
        • By Formulation
        • By Target Consumer
        • By Sales Channel
        • By Packaging Type
    • Italy
      • Pricing Analysis
      • Market Share Analysis, 2024
        • By Product Type
        • By Ectoin Concentration
        • By Formulation
        • By Target Consumer
        • By Sales Channel
        • By Packaging Type
    • Spain
      • Pricing Analysis
      • Market Share Analysis, 2024
        • By Product Type
        • By Ectoin Concentration
        • By Formulation
        • By Target Consumer
        • By Sales Channel
        • By Packaging Type
    • Belgium
      • Pricing Analysis
      • Market Share Analysis, 2024
        • By Product Type
        • By Ectoin Concentration
        • By Formulation
        • By Target Consumer
        • By Sales Channel
        • By Packaging Type
    • Netherlands
      • Pricing Analysis
      • Market Share Analysis, 2024
        • By Product Type
        • By Ectoin Concentration
        • By Formulation
        • By Target Consumer
        • By Sales Channel
        • By Packaging Type
    • Nordic
      • Pricing Analysis
      • Market Share Analysis, 2024
        • By Product Type
        • By Ectoin Concentration
        • By Formulation
        • By Target Consumer
        • By Sales Channel
        • By Packaging Type
    • Switzerland
      • Pricing Analysis
      • Market Share Analysis, 2024
        • By Product Type
        • By Ectoin Concentration
        • By Formulation
        • By Target Consumer
        • By Sales Channel
        • By Packaging Type
    • Russia
      • Pricing Analysis
      • Market Share Analysis, 2024
        • By Product Type
        • By Ectoin Concentration
        • By Formulation
        • By Target Consumer
        • By Sales Channel
        • By Packaging Type
    • Poland
      • Pricing Analysis
      • Market Share Analysis, 2024
        • By Product Type
        • By Ectoin Concentration
        • By Formulation
        • By Target Consumer
        • By Sales Channel
        • By Packaging Type
    • China
      • Pricing Analysis
      • Market Share Analysis, 2024
        • By Product Type
        • By Ectoin Concentration
        • By Formulation
        • By Target Consumer
        • By Sales Channel
        • By Packaging Type
    • Japan
      • Pricing Analysis
      • Market Share Analysis, 2024
        • By Product Type
        • By Ectoin Concentration
        • By Formulation
        • By Target Consumer
        • By Sales Channel
        • By Packaging Type
    • South Korea
      • Pricing Analysis
      • Market Share Analysis, 2024
        • By Product Type
        • By Ectoin Concentration
        • By Formulation
        • By Target Consumer
        • By Sales Channel
        • By Packaging Type
    • India
      • Pricing Analysis
      • Market Share Analysis, 2024
        • By Product Type
        • By Ectoin Concentration
        • By Formulation
        • By Target Consumer
        • By Sales Channel
        • By Packaging Type
    • Thailand
      • Pricing Analysis
      • Market Share Analysis, 2024
        • By Product Type
        • By Ectoin Concentration
        • By Formulation
        • By Target Consumer
        • By Sales Channel
        • By Packaging Type
    • Indonesia
      • Pricing Analysis
      • Market Share Analysis, 2024
        • By Product Type
        • By Ectoin Concentration
        • By Formulation
        • By Target Consumer
        • By Sales Channel
        • By Packaging Type
    • Australia
      • Pricing Analysis
      • Market Share Analysis, 2024
        • By Product Type
        • By Ectoin Concentration
        • By Formulation
        • By Target Consumer
        • By Sales Channel
        • By Packaging Type
    • New Zealand
      • Pricing Analysis
      • Market Share Analysis, 2024
        • By Product Type
        • By Ectoin Concentration
        • By Formulation
        • By Target Consumer
        • By Sales Channel
        • By Packaging Type
    • Turkey
      • Pricing Analysis
      • Market Share Analysis, 2024
        • By Product Type
        • By Ectoin Concentration
        • By Formulation
        • By Target Consumer
        • By Sales Channel
        • By Packaging Type
    • UAE
      • Pricing Analysis
      • Market Share Analysis, 2024
        • By Product Type
        • By Ectoin Concentration
        • By Formulation
        • By Target Consumer
        • By Sales Channel
        • By Packaging Type
    • Saudi Arabia
      • Pricing Analysis
      • Market Share Analysis, 2024
        • By Product Type
        • By Ectoin Concentration
        • By Formulation
        • By Target Consumer
        • By Sales Channel
        • By Packaging Type
    • Israel
      • Pricing Analysis
      • Market Share Analysis, 2024
        • By Product Type
        • By Ectoin Concentration
        • By Formulation
        • By Target Consumer
        • By Sales Channel
        • By Packaging Type
    • North Africa
      • Pricing Analysis
      • Market Share Analysis, 2024
        • By Product Type
        • By Ectoin Concentration
        • By Formulation
        • By Target Consumer
        • By Sales Channel
        • By Packaging Type
    • South Africa
      • Pricing Analysis
      • Market Share Analysis, 2024
        • By Product Type
        • By Ectoin Concentration
        • By Formulation
        • By Target Consumer
        • By Sales Channel
        • By Packaging Type
  19. Market Structure Analysis
    • Competition Dashboard
    • Competition Benchmarking
    • Market Share Analysis of Top Players
      • By Regional
      • By Product Type
      • By Ectoin Concentration
      • By Formulation
      • By Target Consumer
      • By Sales Channel
      • By Packaging Type
  20. Competition Analysis
    • Competition Deep Dive
      • Mibelle Biochemistry
        • Overview
        • Product Portfolio
        • Profitability by Market Segments (Product/Age /Sales Channel/Region)
        • Sales Footprint
        • Strategy Overview
          • Marketing Strategy
          • Product Strategy
          • Channel Strategy
      • Lonza Group
        • Overview
        • Product Portfolio
        • Profitability by Market Segments (Product/Age /Sales Channel/Region)
        • Sales Footprint
        • Strategy Overview
          • Marketing Strategy
          • Product Strategy
          • Channel Strategy
      • Ingredia S.A.
        • Overview
        • Product Portfolio
        • Profitability by Market Segments (Product/Age /Sales Channel/Region)
        • Sales Footprint
        • Strategy Overview
          • Marketing Strategy
          • Product Strategy
          • Channel Strategy
      • BASF
        • Overview
        • Product Portfolio
        • Profitability by Market Segments (Product/Age /Sales Channel/Region)
        • Sales Footprint
        • Strategy Overview
          • Marketing Strategy
          • Product Strategy
          • Channel Strategy
      • Gelita AG
        • Overview
        • Product Portfolio
        • Profitability by Market Segments (Product/Age /Sales Channel/Region)
        • Sales Footprint
        • Strategy Overview
          • Marketing Strategy
          • Product Strategy
          • Channel Strategy
      • Nutraceutix
        • Overview
        • Product Portfolio
        • Profitability by Market Segments (Product/Age /Sales Channel/Region)
        • Sales Footprint
        • Strategy Overview
          • Marketing Strategy
          • Product Strategy
          • Channel Strategy
      • Goli Nutrition
        • Overview
        • Product Portfolio
        • Profitability by Market Segments (Product/Age /Sales Channel/Region)
        • Sales Footprint
        • Strategy Overview
          • Marketing Strategy
          • Product Strategy
          • Channel Strategy
      • Nature’s Way
        • Overview
        • Product Portfolio
        • Profitability by Market Segments (Product/Age /Sales Channel/Region)
        • Sales Footprint
        • Strategy Overview
          • Marketing Strategy
          • Product Strategy
          • Channel Strategy
      • SmartyPants Vitamins
        • Overview
        • Product Portfolio
        • Profitability by Market Segments (Product/Age /Sales Channel/Region)
        • Sales Footprint
        • Strategy Overview
          • Marketing Strategy
          • Product Strategy
          • Channel Strategy
      • MaryRuth Organics
        • Overview
        • Product Portfolio
        • Profitability by Market Segments (Product/Age /Sales Channel/Region)
        • Sales Footprint
        • Strategy Overview
          • Marketing Strategy
          • Product Strategy
          • Channel Strategy
      • Others
        • Overview
        • Product Portfolio
        • Profitability by Market Segments (Product/Age /Sales Channel/Region)
        • Sales Footprint
        • Strategy Overview
          • Marketing Strategy
          • Product Strategy
          • Channel Strategy
  21. Assumptions & Acronyms Used
  22. Research Methodology

List of Tables

  • Table 1: Global Value (USD Million) Forecast by Region, 2020-2035
  • Table 2: Global Volume (Units) Forecast by Region, 2020-2035
  • Table 3: Global Value (USD Million) Forecast by Product Type, 2020-2035
  • Table 4: Global Volume (Units) Forecast by Product Type, 2020-2035
  • Table 5: Global Value (USD Million) Forecast by Ectoin Concentration, 2020-2035
  • Table 6: Global Volume (Units) Forecast by Ectoin Concentration, 2020-2035
  • Table 7: Global Value (USD Million) Forecast by Formulation, 2020-2035
  • Table 8: Global Volume (Units) Forecast by Formulation, 2020-2035
  • Table 9: Global Value (USD Million) Forecast by Target Consumer, 2020-2035
  • Table 10: Global Volume (Units) Forecast by Target Consumer, 2020-2035
  • Table 11: Global Value (USD Million) Forecast by Sales Channel, 2020-2035
  • Table 12: Global Volume (Units) Forecast by Sales Channel, 2020-2035
  • Table 13: Global Value (USD Million) Forecast by Packaging Type, 2020-2035
  • Table 14: Global Volume (Units) Forecast by Packaging Type, 2020-2035
  • Table 15: North America Value (USD Million) Forecast by Country, 2020-2035
  • Table 16: North America Volume (Units) Forecast by Country, 2020-2035
  • Table 17: North America Value (USD Million) Forecast by Product Type, 2020-2035
  • Table 18: North America Volume (Units) Forecast by Product Type, 2020-2035
  • Table 19: North America Value (USD Million) Forecast by Ectoin Concentration, 2020-2035
  • Table 20: North America Volume (Units) Forecast by Ectoin Concentration, 2020-2035
  • Table 21: North America Value (USD Million) Forecast by Formulation, 2020-2035
  • Table 22: North America Volume (Units) Forecast by Formulation, 2020-2035
  • Table 23: North America Value (USD Million) Forecast by Target Consumer, 2020-2035
  • Table 24: North America Volume (Units) Forecast by Target Consumer, 2020-2035
  • Table 25: North America Value (USD Million) Forecast by Sales Channel, 2020-2035
  • Table 26: North America Volume (Units) Forecast by Sales Channel, 2020-2035
  • Table 27: North America Value (USD Million) Forecast by Packaging Type, 2020-2035
  • Table 28: North America Volume (Units) Forecast by Packaging Type, 2020-2035
  • Table 29: Latin America Value (USD Million) Forecast by Country, 2020-2035
  • Table 30: Latin America Volume (Units) Forecast by Country, 2020-2035
  • Table 31: Latin America Value (USD Million) Forecast by Product Type, 2020-2035
  • Table 32: Latin America Volume (Units) Forecast by Product Type, 2020-2035
  • Table 33: Latin America Value (USD Million) Forecast by Ectoin Concentration, 2020-2035
  • Table 34: Latin America Volume (Units) Forecast by Ectoin Concentration, 2020-2035
  • Table 35: Latin America Value (USD Million) Forecast by Formulation, 2020-2035
  • Table 36: Latin America Volume (Units) Forecast by Formulation, 2020-2035
  • Table 37: Latin America Value (USD Million) Forecast by Target Consumer, 2020-2035
  • Table 38: Latin America Volume (Units) Forecast by Target Consumer, 2020-2035
  • Table 39: Latin America Value (USD Million) Forecast by Sales Channel, 2020-2035
  • Table 40: Latin America Volume (Units) Forecast by Sales Channel, 2020-2035
  • Table 41: Latin America Value (USD Million) Forecast by Packaging Type, 2020-2035
  • Table 42: Latin America Volume (Units) Forecast by Packaging Type, 2020-2035
  • Table 43: Europe Value (USD Million) Forecast by Country, 2020-2035
  • Table 44: Europe Volume (Units) Forecast by Country, 2020-2035
  • Table 45: Europe Value (USD Million) Forecast by Product Type, 2020-2035
  • Table 46: Europe Volume (Units) Forecast by Product Type, 2020-2035
  • Table 47: Europe Value (USD Million) Forecast by Ectoin Concentration, 2020-2035
  • Table 48: Europe Volume (Units) Forecast by Ectoin Concentration, 2020-2035
  • Table 49: Europe Value (USD Million) Forecast by Formulation, 2020-2035
  • Table 50: Europe Volume (Units) Forecast by Formulation, 2020-2035
  • Table 51: Europe Value (USD Million) Forecast by Target Consumer, 2020-2035
  • Table 52: Europe Volume (Units) Forecast by Target Consumer, 2020-2035
  • Table 53: Europe Value (USD Million) Forecast by Sales Channel, 2020-2035
  • Table 54: Europe Volume (Units) Forecast by Sales Channel, 2020-2035
  • Table 55: Europe Value (USD Million) Forecast by Packaging Type, 2020-2035
  • Table 56: Europe Volume (Units) Forecast by Packaging Type, 2020-2035
  • Table 57: East Asia Value (USD Million) Forecast by Country, 2020-2035
  • Table 58: East Asia Volume (Units) Forecast by Country, 2020-2035
  • Table 59: East Asia Value (USD Million) Forecast by Product Type, 2020-2035
  • Table 60: East Asia Volume (Units) Forecast by Product Type, 2020-2035
  • Table 61: East Asia Value (USD Million) Forecast by Ectoin Concentration, 2020-2035
  • Table 62: East Asia Volume (Units) Forecast by Ectoin Concentration, 2020-2035
  • Table 63: East Asia Value (USD Million) Forecast by Formulation, 2020-2035
  • Table 64: East Asia Volume (Units) Forecast by Formulation, 2020-2035
  • Table 65: East Asia Value (USD Million) Forecast by Target Consumer, 2020-2035
  • Table 66: East Asia Volume (Units) Forecast by Target Consumer, 2020-2035
  • Table 67: East Asia Value (USD Million) Forecast by Sales Channel, 2020-2035
  • Table 68: East Asia Volume (Units) Forecast by Sales Channel, 2020-2035
  • Table 69: East Asia Value (USD Million) Forecast by Packaging Type, 2020-2035
  • Table 70: East Asia Volume (Units) Forecast by Packaging Type, 2020-2035
  • Table 71: South Asia & Pacific Value (USD Million) Forecast by Country, 2020-2035
  • Table 72: South Asia & Pacific Volume (Units) Forecast by Country, 2020-2035
  • Table 73: South Asia & Pacific Value (USD Million) Forecast by Product Type, 2020-2035
  • Table 74: South Asia & Pacific Volume (Units) Forecast by Product Type, 2020-2035
  • Table 75: South Asia & Pacific Value (USD Million) Forecast by Ectoin Concentration, 2020-2035
  • Table 76: South Asia & Pacific Volume (Units) Forecast by Ectoin Concentration, 2020-2035
  • Table 77: South Asia & Pacific Value (USD Million) Forecast by Formulation, 2020-2035
  • Table 78: South Asia & Pacific Volume (Units) Forecast by Formulation, 2020-2035
  • Table 79: South Asia & Pacific Value (USD Million) Forecast by Target Consumer, 2020-2035
  • Table 80: South Asia & Pacific Volume (Units) Forecast by Target Consumer, 2020-2035
  • Table 81: South Asia & Pacific Value (USD Million) Forecast by Sales Channel, 2020-2035
  • Table 82: South Asia & Pacific Volume (Units) Forecast by Sales Channel, 2020-2035
  • Table 83: South Asia & Pacific Value (USD Million) Forecast by Packaging Type, 2020-2035
  • Table 84: South Asia & Pacific Volume (Units) Forecast by Packaging Type, 2020-2035
  • Table 85: MEA Value (USD Million) Forecast by Country, 2020-2035
  • Table 86: MEA Volume (Units) Forecast by Country, 2020-2035
  • Table 87: MEA Value (USD Million) Forecast by Product Type, 2020-2035
  • Table 88: MEA Volume (Units) Forecast by Product Type, 2020-2035
  • Table 89: MEA Value (USD Million) Forecast by Ectoin Concentration, 2020-2035
  • Table 90: MEA Volume (Units) Forecast by Ectoin Concentration, 2020-2035
  • Table 91: MEA Value (USD Million) Forecast by Formulation, 2020-2035
  • Table 92: MEA Volume (Units) Forecast by Formulation, 2020-2035
  • Table 93: MEA Value (USD Million) Forecast by Target Consumer, 2020-2035
  • Table 94: MEA Volume (Units) Forecast by Target Consumer, 2020-2035
  • Table 95: MEA Value (USD Million) Forecast by Sales Channel, 2020-2035
  • Table 96: MEA Volume (Units) Forecast by Sales Channel, 2020-2035
  • Table 97: MEA Value (USD Million) Forecast by Packaging Type, 2020-2035
  • Table 98: MEA Volume (Units) Forecast by Packaging Type, 2020-2035

List of Figures

  • Figure 1: Global Value (USD Million) by Product Type, 2025-2035
  • Figure 2: Global Value (USD Million) by Ectoin Concentration, 2025-2035
  • Figure 3: Global Value (USD Million) by Formulation, 2025-2035
  • Figure 4: Global Value (USD Million) by Target Consumer, 2025-2035
  • Figure 5: Global Value (USD Million) by Sales Channel, 2025-2035
  • Figure 6: Global Value (USD Million) by Packaging Type, 2025-2035
  • Figure 7: Global Value (USD Million) by Region, 2025-2035
  • Figure 8: Global Value (USD Million) Analysis by Region, 2020-2035
  • Figure 9: Global Volume (Units) Analysis by Region, 2020-2035
  • Figure 10: Global Value Share (%) and BPS Analysis by Region, 2025-2035
  • Figure 11: Global Y-o-Y Growth (%) Projections by Region, 2025-2035
  • Figure 12: Global Value (USD Million) Analysis by Product Type, 2020-2035
  • Figure 13: Global Volume (Units) Analysis by Product Type, 2020-2035
  • Figure 14: Global Value Share (%) and BPS Analysis by Product Type, 2025-2035
  • Figure 15: Global Y-o-Y Growth (%) Projections by Product Type, 2025-2035
  • Figure 16: Global Value (USD Million) Analysis by Ectoin Concentration, 2020-2035
  • Figure 17: Global Volume (Units) Analysis by Ectoin Concentration, 2020-2035
  • Figure 18: Global Value Share (%) and BPS Analysis by Ectoin Concentration, 2025-2035
  • Figure 19: Global Y-o-Y Growth (%) Projections by Ectoin Concentration, 2025-2035
  • Figure 20: Global Value (USD Million) Analysis by Formulation, 2020-2035
  • Figure 21: Global Volume (Units) Analysis by Formulation, 2020-2035
  • Figure 22: Global Value Share (%) and BPS Analysis by Formulation, 2025-2035
  • Figure 23: Global Y-o-Y Growth (%) Projections by Formulation, 2025-2035
  • Figure 24: Global Value (USD Million) Analysis by Target Consumer, 2020-2035
  • Figure 25: Global Volume (Units) Analysis by Target Consumer, 2020-2035
  • Figure 26: Global Value Share (%) and BPS Analysis by Target Consumer, 2025-2035
  • Figure 27: Global Y-o-Y Growth (%) Projections by Target Consumer, 2025-2035
  • Figure 28: Global Value (USD Million) Analysis by Sales Channel, 2020-2035
  • Figure 29: Global Volume (Units) Analysis by Sales Channel, 2020-2035
  • Figure 30: Global Value Share (%) and BPS Analysis by Sales Channel, 2025-2035
  • Figure 31: Global Y-o-Y Growth (%) Projections by Sales Channel, 2025-2035
  • Figure 32: Global Value (USD Million) Analysis by Packaging Type, 2020-2035
  • Figure 33: Global Volume (Units) Analysis by Packaging Type, 2020-2035
  • Figure 34: Global Value Share (%) and BPS Analysis by Packaging Type, 2025-2035
  • Figure 35: Global Y-o-Y Growth (%) Projections by Packaging Type, 2025-2035
  • Figure 36: Global Attractiveness by Product Type, 2025-2035
  • Figure 37: Global Attractiveness by Ectoin Concentration, 2025-2035
  • Figure 38: Global Attractiveness by Formulation, 2025-2035
  • Figure 39: Global Attractiveness by Target Consumer, 2025-2035
  • Figure 40: Global Attractiveness by Sales Channel, 2025-2035
  • Figure 41: Global Attractiveness by Packaging Type, 2025-2035
  • Figure 42: Global Attractiveness by Region, 2025-2035
  • Figure 43: North America Value (USD Million) by Product Type, 2025-2035
  • Figure 44: North America Value (USD Million) by Ectoin Concentration, 2025-2035
  • Figure 45: North America Value (USD Million) by Formulation, 2025-2035
  • Figure 46: North America Value (USD Million) by Target Consumer, 2025-2035
  • Figure 47: North America Value (USD Million) by Sales Channel, 2025-2035
  • Figure 48: North America Value (USD Million) by Packaging Type, 2025-2035
  • Figure 49: North America Value (USD Million) by Country, 2025-2035
  • Figure 50: North America Value (USD Million) Analysis by Country, 2020-2035
  • Figure 51: North America Volume (Units) Analysis by Country, 2020-2035
  • Figure 52: North America Value Share (%) and BPS Analysis by Country, 2025-2035
  • Figure 53: North America Y-o-Y Growth (%) Projections by Country, 2025-2035
  • Figure 54: North America Value (USD Million) Analysis by Product Type, 2020-2035
  • Figure 55: North America Volume (Units) Analysis by Product Type, 2020-2035
  • Figure 56: North America Value Share (%) and BPS Analysis by Product Type, 2025-2035
  • Figure 57: North America Y-o-Y Growth (%) Projections by Product Type, 2025-2035
  • Figure 58: North America Value (USD Million) Analysis by Ectoin Concentration, 2020-2035
  • Figure 59: North America Volume (Units) Analysis by Ectoin Concentration, 2020-2035
  • Figure 60: North America Value Share (%) and BPS Analysis by Ectoin Concentration, 2025-2035
  • Figure 61: North America Y-o-Y Growth (%) Projections by Ectoin Concentration, 2025-2035
  • Figure 62: North America Value (USD Million) Analysis by Formulation, 2020-2035
  • Figure 63: North America Volume (Units) Analysis by Formulation, 2020-2035
  • Figure 64: North America Value Share (%) and BPS Analysis by Formulation, 2025-2035
  • Figure 65: North America Y-o-Y Growth (%) Projections by Formulation, 2025-2035
  • Figure 66: North America Value (USD Million) Analysis by Target Consumer, 2020-2035
  • Figure 67: North America Volume (Units) Analysis by Target Consumer, 2020-2035
  • Figure 68: North America Value Share (%) and BPS Analysis by Target Consumer, 2025-2035
  • Figure 69: North America Y-o-Y Growth (%) Projections by Target Consumer, 2025-2035
  • Figure 70: North America Value (USD Million) Analysis by Sales Channel, 2020-2035
  • Figure 71: North America Volume (Units) Analysis by Sales Channel, 2020-2035
  • Figure 72: North America Value Share (%) and BPS Analysis by Sales Channel, 2025-2035
  • Figure 73: North America Y-o-Y Growth (%) Projections by Sales Channel, 2025-2035
  • Figure 74: North America Value (USD Million) Analysis by Packaging Type, 2020-2035
  • Figure 75: North America Volume (Units) Analysis by Packaging Type, 2020-2035
  • Figure 76: North America Value Share (%) and BPS Analysis by Packaging Type, 2025-2035
  • Figure 77: North America Y-o-Y Growth (%) Projections by Packaging Type, 2025-2035
  • Figure 78: North America Attractiveness by Product Type, 2025-2035
  • Figure 79: North America Attractiveness by Ectoin Concentration, 2025-2035
  • Figure 80: North America Attractiveness by Formulation, 2025-2035
  • Figure 81: North America Attractiveness by Target Consumer, 2025-2035
  • Figure 82: North America Attractiveness by Sales Channel, 2025-2035
  • Figure 83: North America Attractiveness by Packaging Type, 2025-2035
  • Figure 84: North America Attractiveness by Country, 2025-2035
  • Figure 85: Latin America Value (USD Million) by Product Type, 2025-2035
  • Figure 86: Latin America Value (USD Million) by Ectoin Concentration, 2025-2035
  • Figure 87: Latin America Value (USD Million) by Formulation, 2025-2035
  • Figure 88: Latin America Value (USD Million) by Target Consumer, 2025-2035
  • Figure 89: Latin America Value (USD Million) by Sales Channel, 2025-2035
  • Figure 90: Latin America Value (USD Million) by Packaging Type, 2025-2035
  • Figure 91: Latin America Value (USD Million) by Country, 2025-2035
  • Figure 92: Latin America Value (USD Million) Analysis by Country, 2020-2035
  • Figure 93: Latin America Volume (Units) Analysis by Country, 2020-2035
  • Figure 94: Latin America Value Share (%) and BPS Analysis by Country, 2025-2035
  • Figure 95: Latin America Y-o-Y Growth (%) Projections by Country, 2025-2035
  • Figure 96: Latin America Value (USD Million) Analysis by Product Type, 2020-2035
  • Figure 97: Latin America Volume (Units) Analysis by Product Type, 2020-2035
  • Figure 98: Latin America Value Share (%) and BPS Analysis by Product Type, 2025-2035
  • Figure 99: Latin America Y-o-Y Growth (%) Projections by Product Type, 2025-2035
  • Figure 100: Latin America Value (USD Million) Analysis by Ectoin Concentration, 2020-2035
  • Figure 101: Latin America Volume (Units) Analysis by Ectoin Concentration, 2020-2035
  • Figure 102: Latin America Value Share (%) and BPS Analysis by Ectoin Concentration, 2025-2035
  • Figure 103: Latin America Y-o-Y Growth (%) Projections by Ectoin Concentration, 2025-2035
  • Figure 104: Latin America Value (USD Million) Analysis by Formulation, 2020-2035
  • Figure 105: Latin America Volume (Units) Analysis by Formulation, 2020-2035
  • Figure 106: Latin America Value Share (%) and BPS Analysis by Formulation, 2025-2035
  • Figure 107: Latin America Y-o-Y Growth (%) Projections by Formulation, 2025-2035
  • Figure 108: Latin America Value (USD Million) Analysis by Target Consumer, 2020-2035
  • Figure 109: Latin America Volume (Units) Analysis by Target Consumer, 2020-2035
  • Figure 110: Latin America Value Share (%) and BPS Analysis by Target Consumer, 2025-2035
  • Figure 111: Latin America Y-o-Y Growth (%) Projections by Target Consumer, 2025-2035
  • Figure 112: Latin America Value (USD Million) Analysis by Sales Channel, 2020-2035
  • Figure 113: Latin America Volume (Units) Analysis by Sales Channel, 2020-2035
  • Figure 114: Latin America Value Share (%) and BPS Analysis by Sales Channel, 2025-2035
  • Figure 115: Latin America Y-o-Y Growth (%) Projections by Sales Channel, 2025-2035
  • Figure 116: Latin America Value (USD Million) Analysis by Packaging Type, 2020-2035
  • Figure 117: Latin America Volume (Units) Analysis by Packaging Type, 2020-2035
  • Figure 118: Latin America Value Share (%) and BPS Analysis by Packaging Type, 2025-2035
  • Figure 119: Latin America Y-o-Y Growth (%) Projections by Packaging Type, 2025-2035
  • Figure 120: Latin America Attractiveness by Product Type, 2025-2035
  • Figure 121: Latin America Attractiveness by Ectoin Concentration, 2025-2035
  • Figure 122: Latin America Attractiveness by Formulation, 2025-2035
  • Figure 123: Latin America Attractiveness by Target Consumer, 2025-2035
  • Figure 124: Latin America Attractiveness by Sales Channel, 2025-2035
  • Figure 125: Latin America Attractiveness by Packaging Type, 2025-2035
  • Figure 126: Latin America Attractiveness by Country, 2025-2035
  • Figure 127: Europe Value (USD Million) by Product Type, 2025-2035
  • Figure 128: Europe Value (USD Million) by Ectoin Concentration, 2025-2035
  • Figure 129: Europe Value (USD Million) by Formulation, 2025-2035
  • Figure 130: Europe Value (USD Million) by Target Consumer, 2025-2035
  • Figure 131: Europe Value (USD Million) by Sales Channel, 2025-2035
  • Figure 132: Europe Value (USD Million) by Packaging Type, 2025-2035
  • Figure 133: Europe Value (USD Million) by Country, 2025-2035
  • Figure 134: Europe Value (USD Million) Analysis by Country, 2020-2035
  • Figure 135: Europe Volume (Units) Analysis by Country, 2020-2035
  • Figure 136: Europe Value Share (%) and BPS Analysis by Country, 2025-2035
  • Figure 137: Europe Y-o-Y Growth (%) Projections by Country, 2025-2035
  • Figure 138: Europe Value (USD Million) Analysis by Product Type, 2020-2035
  • Figure 139: Europe Volume (Units) Analysis by Product Type, 2020-2035
  • Figure 140: Europe Value Share (%) and BPS Analysis by Product Type, 2025-2035
  • Figure 141: Europe Y-o-Y Growth (%) Projections by Product Type, 2025-2035
  • Figure 142: Europe Value (USD Million) Analysis by Ectoin Concentration, 2020-2035
  • Figure 143: Europe Volume (Units) Analysis by Ectoin Concentration, 2020-2035
  • Figure 144: Europe Value Share (%) and BPS Analysis by Ectoin Concentration, 2025-2035
  • Figure 145: Europe Y-o-Y Growth (%) Projections by Ectoin Concentration, 2025-2035
  • Figure 146: Europe Value (USD Million) Analysis by Formulation, 2020-2035
  • Figure 147: Europe Volume (Units) Analysis by Formulation, 2020-2035
  • Figure 148: Europe Value Share (%) and BPS Analysis by Formulation, 2025-2035
  • Figure 149: Europe Y-o-Y Growth (%) Projections by Formulation, 2025-2035
  • Figure 150: Europe Value (USD Million) Analysis by Target Consumer, 2020-2035
  • Figure 151: Europe Volume (Units) Analysis by Target Consumer, 2020-2035
  • Figure 152: Europe Value Share (%) and BPS Analysis by Target Consumer, 2025-2035
  • Figure 153: Europe Y-o-Y Growth (%) Projections by Target Consumer, 2025-2035
  • Figure 154: Europe Value (USD Million) Analysis by Sales Channel, 2020-2035
  • Figure 155: Europe Volume (Units) Analysis by Sales Channel, 2020-2035
  • Figure 156: Europe Value Share (%) and BPS Analysis by Sales Channel, 2025-2035
  • Figure 157: Europe Y-o-Y Growth (%) Projections by Sales Channel, 2025-2035
  • Figure 158: Europe Value (USD Million) Analysis by Packaging Type, 2020-2035
  • Figure 159: Europe Volume (Units) Analysis by Packaging Type, 2020-2035
  • Figure 160: Europe Value Share (%) and BPS Analysis by Packaging Type, 2025-2035
  • Figure 161: Europe Y-o-Y Growth (%) Projections by Packaging Type, 2025-2035
  • Figure 162: Europe Attractiveness by Product Type, 2025-2035
  • Figure 163: Europe Attractiveness by Ectoin Concentration, 2025-2035
  • Figure 164: Europe Attractiveness by Formulation, 2025-2035
  • Figure 165: Europe Attractiveness by Target Consumer, 2025-2035
  • Figure 166: Europe Attractiveness by Sales Channel, 2025-2035
  • Figure 167: Europe Attractiveness by Packaging Type, 2025-2035
  • Figure 168: Europe Attractiveness by Country, 2025-2035
  • Figure 169: East Asia Value (USD Million) by Product Type, 2025-2035
  • Figure 170: East Asia Value (USD Million) by Ectoin Concentration, 2025-2035
  • Figure 171: East Asia Value (USD Million) by Formulation, 2025-2035
  • Figure 172: East Asia Value (USD Million) by Target Consumer, 2025-2035
  • Figure 173: East Asia Value (USD Million) by Sales Channel, 2025-2035
  • Figure 174: East Asia Value (USD Million) by Packaging Type, 2025-2035
  • Figure 175: East Asia Value (USD Million) by Country, 2025-2035
  • Figure 176: East Asia Value (USD Million) Analysis by Country, 2020-2035
  • Figure 177: East Asia Volume (Units) Analysis by Country, 2020-2035
  • Figure 178: East Asia Value Share (%) and BPS Analysis by Country, 2025-2035
  • Figure 179: East Asia Y-o-Y Growth (%) Projections by Country, 2025-2035
  • Figure 180: East Asia Value (USD Million) Analysis by Product Type, 2020-2035
  • Figure 181: East Asia Volume (Units) Analysis by Product Type, 2020-2035
  • Figure 182: East Asia Value Share (%) and BPS Analysis by Product Type, 2025-2035
  • Figure 183: East Asia Y-o-Y Growth (%) Projections by Product Type, 2025-2035
  • Figure 184: East Asia Value (USD Million) Analysis by Ectoin Concentration, 2020-2035
  • Figure 185: East Asia Volume (Units) Analysis by Ectoin Concentration, 2020-2035
  • Figure 186: East Asia Value Share (%) and BPS Analysis by Ectoin Concentration, 2025-2035
  • Figure 187: East Asia Y-o-Y Growth (%) Projections by Ectoin Concentration, 2025-2035
  • Figure 188: East Asia Value (USD Million) Analysis by Formulation, 2020-2035
  • Figure 189: East Asia Volume (Units) Analysis by Formulation, 2020-2035
  • Figure 190: East Asia Value Share (%) and BPS Analysis by Formulation, 2025-2035
  • Figure 191: East Asia Y-o-Y Growth (%) Projections by Formulation, 2025-2035
  • Figure 192: East Asia Value (USD Million) Analysis by Target Consumer, 2020-2035
  • Figure 193: East Asia Volume (Units) Analysis by Target Consumer, 2020-2035
  • Figure 194: East Asia Value Share (%) and BPS Analysis by Target Consumer, 2025-2035
  • Figure 195: East Asia Y-o-Y Growth (%) Projections by Target Consumer, 2025-2035
  • Figure 196: East Asia Value (USD Million) Analysis by Sales Channel, 2020-2035
  • Figure 197: East Asia Volume (Units) Analysis by Sales Channel, 2020-2035
  • Figure 198: East Asia Value Share (%) and BPS Analysis by Sales Channel, 2025-2035
  • Figure 199: East Asia Y-o-Y Growth (%) Projections by Sales Channel, 2025-2035
  • Figure 200: East Asia Value (USD Million) Analysis by Packaging Type, 2020-2035
  • Figure 201: East Asia Volume (Units) Analysis by Packaging Type, 2020-2035
  • Figure 202: East Asia Value Share (%) and BPS Analysis by Packaging Type, 2025-2035
  • Figure 203: East Asia Y-o-Y Growth (%) Projections by Packaging Type, 2025-2035
  • Figure 204: East Asia Attractiveness by Product Type, 2025-2035
  • Figure 205: East Asia Attractiveness by Ectoin Concentration, 2025-2035
  • Figure 206: East Asia Attractiveness by Formulation, 2025-2035
  • Figure 207: East Asia Attractiveness by Target Consumer, 2025-2035
  • Figure 208: East Asia Attractiveness by Sales Channel, 2025-2035
  • Figure 209: East Asia Attractiveness by Packaging Type, 2025-2035
  • Figure 210: East Asia Attractiveness by Country, 2025-2035
  • Figure 211: South Asia & Pacific Value (USD Million) by Product Type, 2025-2035
  • Figure 212: South Asia & Pacific Value (USD Million) by Ectoin Concentration, 2025-2035
  • Figure 213: South Asia & Pacific Value (USD Million) by Formulation, 2025-2035
  • Figure 214: South Asia & Pacific Value (USD Million) by Target Consumer, 2025-2035
  • Figure 215: South Asia & Pacific Value (USD Million) by Sales Channel, 2025-2035
  • Figure 216: South Asia & Pacific Value (USD Million) by Packaging Type, 2025-2035
  • Figure 217: South Asia & Pacific Value (USD Million) by Country, 2025-2035
  • Figure 218: South Asia & Pacific Value (USD Million) Analysis by Country, 2020-2035
  • Figure 219: South Asia & Pacific Volume (Units) Analysis by Country, 2020-2035
  • Figure 220: South Asia & Pacific Value Share (%) and BPS Analysis by Country, 2025-2035
  • Figure 221: South Asia & Pacific Y-o-Y Growth (%) Projections by Country, 2025-2035
  • Figure 222: South Asia & Pacific Value (USD Million) Analysis by Product Type, 2020-2035
  • Figure 223: South Asia & Pacific Volume (Units) Analysis by Product Type, 2020-2035
  • Figure 224: South Asia & Pacific Value Share (%) and BPS Analysis by Product Type, 2025-2035
  • Figure 225: South Asia & Pacific Y-o-Y Growth (%) Projections by Product Type, 2025-2035
  • Figure 226: South Asia & Pacific Value (USD Million) Analysis by Ectoin Concentration, 2020-2035
  • Figure 227: South Asia & Pacific Volume (Units) Analysis by Ectoin Concentration, 2020-2035
  • Figure 228: South Asia & Pacific Value Share (%) and BPS Analysis by Ectoin Concentration, 2025-2035
  • Figure 229: South Asia & Pacific Y-o-Y Growth (%) Projections by Ectoin Concentration, 2025-2035
  • Figure 230: South Asia & Pacific Value (USD Million) Analysis by Formulation, 2020-2035
  • Figure 231: South Asia & Pacific Volume (Units) Analysis by Formulation, 2020-2035
  • Figure 232: South Asia & Pacific Value Share (%) and BPS Analysis by Formulation, 2025-2035
  • Figure 233: South Asia & Pacific Y-o-Y Growth (%) Projections by Formulation, 2025-2035
  • Figure 234: South Asia & Pacific Value (USD Million) Analysis by Target Consumer, 2020-2035
  • Figure 235: South Asia & Pacific Volume (Units) Analysis by Target Consumer, 2020-2035
  • Figure 236: South Asia & Pacific Value Share (%) and BPS Analysis by Target Consumer, 2025-2035
  • Figure 237: South Asia & Pacific Y-o-Y Growth (%) Projections by Target Consumer, 2025-2035
  • Figure 238: South Asia & Pacific Value (USD Million) Analysis by Sales Channel, 2020-2035
  • Figure 239: South Asia & Pacific Volume (Units) Analysis by Sales Channel, 2020-2035
  • Figure 240: South Asia & Pacific Value Share (%) and BPS Analysis by Sales Channel, 2025-2035
  • Figure 241: South Asia & Pacific Y-o-Y Growth (%) Projections by Sales Channel, 2025-2035
  • Figure 242: South Asia & Pacific Value (USD Million) Analysis by Packaging Type, 2020-2035
  • Figure 243: South Asia & Pacific Volume (Units) Analysis by Packaging Type, 2020-2035
  • Figure 244: South Asia & Pacific Value Share (%) and BPS Analysis by Packaging Type, 2025-2035
  • Figure 245: South Asia & Pacific Y-o-Y Growth (%) Projections by Packaging Type, 2025-2035
  • Figure 246: South Asia & Pacific Attractiveness by Product Type, 2025-2035
  • Figure 247: South Asia & Pacific Attractiveness by Ectoin Concentration, 2025-2035
  • Figure 248: South Asia & Pacific Attractiveness by Formulation, 2025-2035
  • Figure 249: South Asia & Pacific Attractiveness by Target Consumer, 2025-2035
  • Figure 250: South Asia & Pacific Attractiveness by Sales Channel, 2025-2035
  • Figure 251: South Asia & Pacific Attractiveness by Packaging Type, 2025-2035
  • Figure 252: South Asia & Pacific Attractiveness by Country, 2025-2035
  • Figure 253: MEA Value (USD Million) by Product Type, 2025-2035
  • Figure 254: MEA Value (USD Million) by Ectoin Concentration, 2025-2035
  • Figure 255: MEA Value (USD Million) by Formulation, 2025-2035
  • Figure 256: MEA Value (USD Million) by Target Consumer, 2025-2035
  • Figure 257: MEA Value (USD Million) by Sales Channel, 2025-2035
  • Figure 258: MEA Value (USD Million) by Packaging Type, 2025-2035
  • Figure 259: MEA Value (USD Million) by Country, 2025-2035
  • Figure 260: MEA Value (USD Million) Analysis by Country, 2020-2035
  • Figure 261: MEA Volume (Units) Analysis by Country, 2020-2035
  • Figure 262: MEA Value Share (%) and BPS Analysis by Country, 2025-2035
  • Figure 263: MEA Y-o-Y Growth (%) Projections by Country, 2025-2035
  • Figure 264: MEA Value (USD Million) Analysis by Product Type, 2020-2035
  • Figure 265: MEA Volume (Units) Analysis by Product Type, 2020-2035
  • Figure 266: MEA Value Share (%) and BPS Analysis by Product Type, 2025-2035
  • Figure 267: MEA Y-o-Y Growth (%) Projections by Product Type, 2025-2035
  • Figure 268: MEA Value (USD Million) Analysis by Ectoin Concentration, 2020-2035
  • Figure 269: MEA Volume (Units) Analysis by Ectoin Concentration, 2020-2035
  • Figure 270: MEA Value Share (%) and BPS Analysis by Ectoin Concentration, 2025-2035
  • Figure 271: MEA Y-o-Y Growth (%) Projections by Ectoin Concentration, 2025-2035
  • Figure 272: MEA Value (USD Million) Analysis by Formulation, 2020-2035
  • Figure 273: MEA Volume (Units) Analysis by Formulation, 2020-2035
  • Figure 274: MEA Value Share (%) and BPS Analysis by Formulation, 2025-2035
  • Figure 275: MEA Y-o-Y Growth (%) Projections by Formulation, 2025-2035
  • Figure 276: MEA Value (USD Million) Analysis by Target Consumer, 2020-2035
  • Figure 277: MEA Volume (Units) Analysis by Target Consumer, 2020-2035
  • Figure 278: MEA Value Share (%) and BPS Analysis by Target Consumer, 2025-2035
  • Figure 279: MEA Y-o-Y Growth (%) Projections by Target Consumer, 2025-2035
  • Figure 280: MEA Value (USD Million) Analysis by Sales Channel, 2020-2035
  • Figure 281: MEA Volume (Units) Analysis by Sales Channel, 2020-2035
  • Figure 282: MEA Value Share (%) and BPS Analysis by Sales Channel, 2025-2035
  • Figure 283: MEA Y-o-Y Growth (%) Projections by Sales Channel, 2025-2035
  • Figure 284: MEA Value (USD Million) Analysis by Packaging Type, 2020-2035
  • Figure 285: MEA Volume (Units) Analysis by Packaging Type, 2020-2035
  • Figure 286: MEA Value Share (%) and BPS Analysis by Packaging Type, 2025-2035
  • Figure 287: MEA Y-o-Y Growth (%) Projections by Packaging Type, 2025-2035
  • Figure 288: MEA Attractiveness by Product Type, 2025-2035
  • Figure 289: MEA Attractiveness by Ectoin Concentration, 2025-2035
  • Figure 290: MEA Attractiveness by Formulation, 2025-2035
  • Figure 291: MEA Attractiveness by Target Consumer, 2025-2035
  • Figure 292: MEA Attractiveness by Sales Channel, 2025-2035
  • Figure 293: MEA Attractiveness by Packaging Type, 2025-2035
  • Figure 294: MEA Attractiveness by Country, 2025-2035

Frequently Asked Questions

How big is the Ectoin Gummies Market in 2025?

The global Ectoin Gummies Market is estimated to be valued at USD 335.6 million in 2025.

What will be the size of the Ectoin Gummies Market in 2035?

The market size for the Ectoin Gummies Market is projected to reach approximately USD 594.3 million by 2035.

How much will the Ectoin Gummies Market grow between 2025 and 2035?

The Ectoin Gummies Market is expected to grow at a CAGR of 5.9% between 2025 and 2035, reflecting a sustained demand for skin, stress, and immune health gummies.

What are the key product types in the Ectoin Gummies Market?

The key product types in the Ectoin Gummies Market include Immune Support, Skin Health & Beauty, Anti-Aging, Hydration & Cellular Protection, Anti-Inflammatory, and Stress Relief & Calm Gummies.

Which formulation type is expected to lead the Ectoin Gummies Market in 2025?

In terms of formulation, Gelatin-Based Gummies are projected to command the largest share at 30% of the Ectoin Gummies Market in 2025, followed closely by Vegan Gummies at 28%.

Explore Similar Insights

Future Market Insights

Ectoin Gummies Market