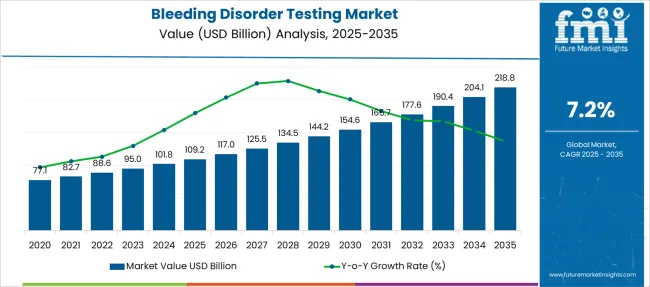
The Bleeding Disorder Testing Market is estimated to be valued at USD 109.2 billion in 2025 and is projected to reach USD 218.8 billion by 2035, registering a compound annual growth rate (CAGR) of 7.2% over the forecast period.
| Metric | Value |
|---|---|
| Bleeding Disorder Testing Market Estimated Value in (2025 E) | USD 109.2 billion |
| Bleeding Disorder Testing Market Forecast Value in (2035 F) | USD 218.8 billion |
| Forecast CAGR (2025 to 2035) | 7.2% |
The bleeding disorder testing market is expanding steadily due to the increasing prevalence of inherited and acquired coagulation conditions, improved diagnostic awareness, and advancements in laboratory testing technologies. Enhanced screening protocols and the availability of targeted therapies have driven the need for early and precise diagnosis, particularly in regions with strong healthcare infrastructure.
Healthcare providers are adopting specialized test panels for better differentiation of bleeding disorders and to monitor treatment response effectively. Innovations in coagulation analyzers and automated platforms have also improved testing speed and reliability.
The market is supported by public health programs, hemophilia registries, and the expansion of hematology services, which collectively create strong demand for comprehensive diagnostic solutions. As personalized medicine becomes more prominent in hematology, the bleeding disorder testing market is expected to benefit from deeper clinical integration and ongoing development of assay sensitivity and specificity.
The market is segmented by Product Type, Indication, and End User and region. By Product Type, the market is divided into Reagents & Consumables and Instruments. In terms of Indication, the market is classified into Hemophilia A, Hemophilia B, Von Willebrand Disease, Idiopathic Thrombocytopenic Purpura, and Others. Based on End User, the market is segmented into Hospitals & Clinics, Diagnostic Centers, and Others. Regionally, the market is classified into North America, Latin America, Western Europe, Eastern Europe, Balkan & Baltic Countries, Russia & Belarus, Central Asia, East Asia, South Asia & Pacific, and the Middle East & Africa.
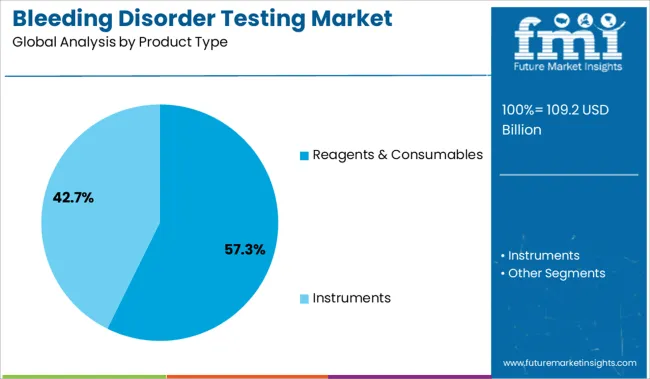
The reagents and consumables segment is projected to account for 57.30% of total market revenue by 2025, making it the leading product type. This segment's growth is supported by the recurring nature of reagent use in laboratory testing workflows and the increasing frequency of diagnostic procedures.
High demand for reliable and standardized test kits, along with their compatibility with automated analyzers, has led to widespread adoption across clinical laboratories. Innovations in reagent stability and shelf life are also enhancing usability in decentralized settings.
The critical role of reagents and consumables in facilitating accurate and reproducible results has reinforced their leadership position within the bleeding disorder testing market.
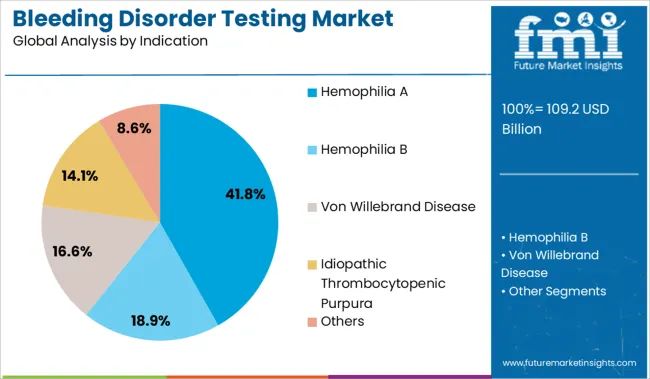
The hemophilia A segment is expected to represent 41.80% of total market share by 2025 within the indication category, positioning it as the most dominant indication. This is driven by the relatively high global prevalence of the condition and the emphasis on early detection to support timely intervention.
Increased availability of factor replacement therapies and gene therapy pipelines has also contributed to the rise in routine monitoring and diagnostic testing. Awareness programs and newborn screening initiatives are further amplifying diagnostic volumes.
As personalized treatment plans become standard in hemophilia care, the demand for precise and frequent diagnostic testing for hemophilia A remains strong, supporting the continued growth of this indication.
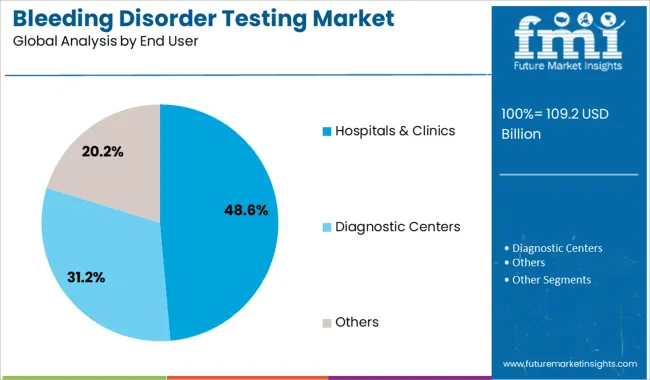
The hospitals and clinics segment is projected to hold 48.60% of total revenue by 2025, leading within the end user category. This dominance is driven by the accessibility of specialized testing infrastructure, skilled personnel, and integrated care pathways in hospital-based settings.
Hospitals are typically the first point of contact for patients experiencing bleeding symptoms, and comprehensive diagnostic services are often centralized within these facilities. Additionally, the availability of reimbursement frameworks, laboratory automation, and rapid diagnostic capabilities has further elevated the role of hospitals and clinics in managing bleeding disorders.
These advantages continue to position this segment at the forefront of testing services across global healthcare ecosystems.
The global demand for bleeding disorder testing is projected to increase at a CAGR of 7.2% during the forecast period between 2025 and 2035, reaching a total of USD 218.8 Billion in 2035, according to a report from Future Market Insights (FMI). From 2020 to 2025, sales witnessed significant growth, registering a CAGR of 6%.
The increased frequency of bleeding disorders among the general population, as well as the growing elderly population, which is more vulnerable to certain medical diseases, are among the primary drivers driving the global market. Additionally, the increasing acceptance of health insurance policies that give financial support for bleeding disorder treatment bleeding, testing, and lower healthcare costs is favorably affecting the market.
Increasing Prevalence of Blood Disorders to Improve Maintenance and Performance
Blood problems are a type of chronic sickness. They are also dangerous since they circulate throughout the blood. Disorders such as liver disease, anaemia, and other blood coagulation issues have grown, as has the need for bleeding disorders testing. These hereditary illnesses resulted in profitable market expansion.
Investments by the Government in Healthcare Interoperability Influencing the Market
The federal government's increased financing to drive the adoption of these solutions has an additional impact on the industry. Furthermore, the increase in healthcare spending, developments in healthcare infrastructure, and increasing demand for extended care delivery all have a beneficial impact on the bleeding disorders testing industry, supporting market expansion.
A Scarcity of Qualified Professionals to be a Major Obstacle for the Market Growth
The shortage of qualified experts and talented professionals would be a significant hindrance to the expansion of the bleeding disorders testing market. Medication prices will also hinder market expansion.
Inadequate reimbursement policies will limit the breadth as well. Unprofessional therapies can have serious consequences for the patient's health. This difficulty is impeding market expansion.
Low adherence to regulations to Impede Market Growth
The lack of attention of national organizations and other institutions in developing nations on raising awareness about these illnesses results in limited penetration of testing. This problem is impeding market expansion by preventing early diagnosis and effective patient care.
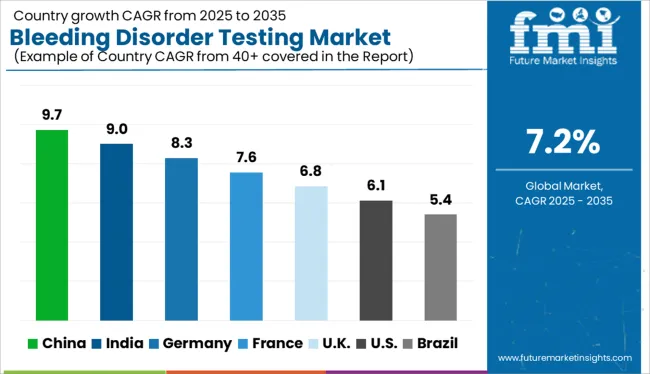
Government’s Initiative for Better Healthcare Infrastructure Widening Profit Margins
As a consequence of greater knowledge of bleeding disorders and treatment alternatives, Asia-Pacific is likely to see a significant CAGR in the future years, boosting the worldwide bleeding disorder testing market.
Furthermore, the government's push to develop healthcare infrastructure benefits the expansion of the bleeding disease testing business. As per Future Market Insights, the Asia Pacific is expected to grow at a CAGR of 6.5% in the assessment period 2025 to 2035.
Increased Availability of Testing Devices to Push Market Sales in the Region
North America is expected to have the highest CAGR over the projection period, owing to the increase that can be attributed to the increased availability of bleeding disorder testing instruments and the rising number of regulatory approvals.
The rising awareness about the bleeding disorders symptoms and diagnosis rate of bleeding disorders is expected to drive market expansion. North America is expected to grow at a CAGR of 7.1% in the assessment period 2025 to 2035.
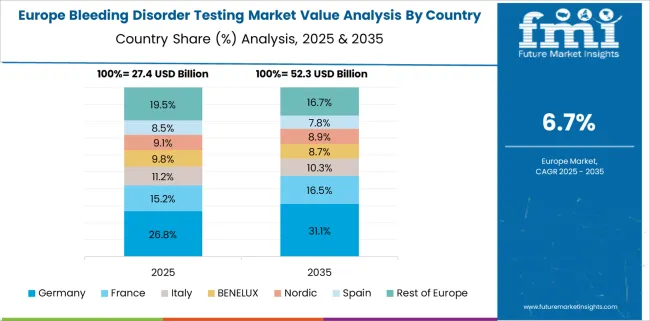
Increasing Frequency of Disorders in the Region fuelling Sales
The increasing frequency of bleeding disorders in Germany, the United Kingdom, and other nations is expected to drive the Europe bleeding disorder testing market share. The expanding patient population and rising adherence to recommendations boosted demand.
The testing tools and technologies in this region are quite advanced, which has increased the market share. Thus, owing to the aforementioned reasons, Europe is expected to grow at a CAGR of 6.9% in the forecast period 2025 to 2035.
The Reagents and Consumables segment will see Profitable Growth
The market is divided into two categories: reagents & consumables and instruments. Given the skyrocketing frequency of testing driven by healthcare access in emerging nations, the reagents and consumables industry is expected to rise significantly.
The Hemophilia A Segment share will Increase
The bleeding disorder testing market is divided into haemophilia A, haemophilia B, Von Willebrand disease, idiopathic thrombocytopenic purpura, and others. Over the projection period, the haemophilia A sector is expected to increase significantly. The increase can be attributed to the rising prevalence of bleeding disorders.
The Diagnostic Centers Segment will see a Commendable Increase
The market is split into hospitals & clinics, diagnostic centers, and others based on end-user. Over the forecast period, the diagnostic center's segment is expected to increase significantly. The rise can be attributed to an increase in the number of portable analyzers and rapid technological developments.
Key start-up players in the bleeding disorder testing are:
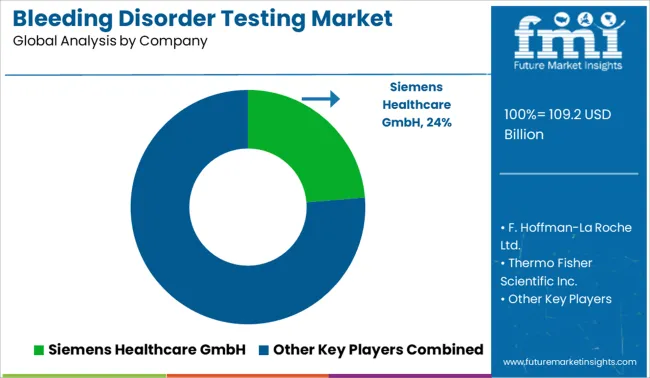
Prominent bleeding disease testing organizations are focusing on strategic strategies such as alliance development, acquisitions, mergers, and others. These actions are being done to strengthen the market position. Increasing involvement in trade shows is one of the extra strategies. Key players in the bleeding disorder testing market are Sysmex Corporation, Siemens Healthcare GmbH, F. Hoffmann-La Roche Ltd., HORIBA Ltd., and Abbott, Thermo Fisher Scientific Inc.
Recent Developments:
| Report Attribute | Details |
|---|---|
| Market Value in 2025 | USD 109.2 billion |
| Market Value in 2035 | USD 218.8 billion |
| Growth Rate | CAGR of 7.2% from 2025 to 2035 |
| Base Year for Estimation | 2025 |
| Historical Data | 2020 to 2025 |
| Forecast Period | 2025 to 2035 |
| Quantitative Units | Revenue in USD Billion and CAGR from 2025 to 2035 |
| Report Coverage | Revenue Forecast, Company Ranking, Competitive Landscape, Growth Factors, Trends, and Pricing Analysis |
| Segments Covered | Product Type, Indication, End User, Region |
| Regions Covered | North America; Latin America; Europe; South Asia & Pacific; East Asia; Middle East & Africa |
| Key Countries Profiled | USA, Canada, Brazil, Mexico, Germany, United Kingdom, France, Spain, Italy, China, Japan, South Korea, India, Malaysia, Singapore, Thailand, Australia, New Zealand, GCC Countries, South Africa, Israel |
| Key Companies Profiled | Siemens Healthcare GmbH; F. Hoffmann-La Roche Ltd.; Abbott Laboratories; Thermo Fisher Scientific Inc.; Atlas Medical GmbH; Horiba Ltd.; Hyphen Bio Med; Precision Biologics Incorporated; Pfizer Inc.; Baxter |
| Customization | Available Upon Request |
The global bleeding disorder testing market is estimated to be valued at USD 109.2 billion in 2025.
The market size for the bleeding disorder testing market is projected to reach USD 218.8 billion by 2035.
The bleeding disorder testing market is expected to grow at a 7.2% CAGR between 2025 and 2035.
The key product types in bleeding disorder testing market are reagents & consumables and instruments.
In terms of indication, hemophilia a segment to command 41.8% share in the bleeding disorder testing market in 2025.


Our Research Products

The "Full Research Suite" delivers actionable market intel, deep dives on markets or technologies, so clients act faster, cut risk, and unlock growth.

The Leaderboard benchmarks and ranks top vendors, classifying them as Established Leaders, Leading Challengers, or Disruptors & Challengers.

Locates where complements amplify value and substitutes erode it, forecasting net impact by horizon

We deliver granular, decision-grade intel: market sizing, 5-year forecasts, pricing, adoption, usage, revenue, and operational KPIs—plus competitor tracking, regulation, and value chains—across 60 countries broadly.

Spot the shifts before they hit your P&L. We track inflection points, adoption curves, pricing moves, and ecosystem plays to show where demand is heading, why it is changing, and what to do next across high-growth markets and disruptive tech

Real-time reads of user behavior. We track shifting priorities, perceptions of today’s and next-gen services, and provider experience, then pace how fast tech moves from trial to adoption, blending buyer, consumer, and channel inputs with social signals (#WhySwitch, #UX).

Partner with our analyst team to build a custom report designed around your business priorities. From analysing market trends to assessing competitors or crafting bespoke datasets, we tailor insights to your needs.
Supplier Intelligence
Discovery & Profiling
Capacity & Footprint
Performance & Risk
Compliance & Governance
Commercial Readiness
Who Supplies Whom
Scorecards & Shortlists
Playbooks & Docs
Category Intelligence
Definition & Scope
Demand & Use Cases
Cost Drivers
Market Structure
Supply Chain Map
Trade & Policy
Operating Norms
Deliverables
Buyer Intelligence
Account Basics
Spend & Scope
Procurement Model
Vendor Requirements
Terms & Policies
Entry Strategy
Pain Points & Triggers
Outputs
Pricing Analysis
Benchmarks
Trends
Should-Cost
Indexation
Landed Cost
Commercial Terms
Deliverables
Brand Analysis
Positioning & Value Prop
Share & Presence
Customer Evidence
Go-to-Market
Digital & Reputation
Compliance & Trust
KPIs & Gaps
Outputs
Full Research Suite comprises of:
Market outlook & trends analysis
Interviews & case studies
Strategic recommendations
Vendor profiles & capabilities analysis
5-year forecasts
8 regions and 60+ country-level data splits
Market segment data splits
12 months of continuous data updates
DELIVERED AS:
PDF EXCEL ONLINE
Bleeding Control Kit Market Size and Share Forecast Outlook 2025 to 2035
Bleeding Control Tablets Market Analysis - Growth, Applications & Outlook 2025 to 2035
Anxiety Disorders And Depression Treatment Market Size and Share Forecast Outlook 2025 to 2035
Bipolar Disorder Drugs and Treatment Market Overview – Trends & Forecast 2025 to 2035
Opioid Use Disorder Treatment Industry Analysis by Opioid Antagonists and Opioid Agonists and Partial Agonists through 2035
Market Positioning & Share in the Opioid Use Disorder Treatment Sector
Alcohol Use Disorder Treatment Market Growth - Demand & Innovations 2025 to 2035
Coagulation Disorders Market
Cannabis Use Disorder Treatment Market – Trends & Innovations 2025 to 2035
Substance Use Disorder Treatment Market Size and Share Forecast Outlook 2025 to 2035
Sleep Movement Disorders Market Size and Share Forecast Outlook 2025 to 2035
Frontotemporal Disorders Treatment Market Size and Share Forecast Outlook 2025 to 2035
Autism Spectrum Disorder Management Market Growth - Trends & Forecast 2025 to 2035
Major Depressive Disorder (MDD) Treatment Market Analysis – Growth & Forecast 2025 to 2035
Market Share Distribution Among Opioid Use Disorder Treatment Providers in Europe
Seasonal Affective Disorder Therapeutics Market Trends – Growth & Forecast 2025 to 2035
Zellweger Spectrum Disorder Market
Gene Therapy in CNS Disorder Market Analysis by Indication, Type, End User, and Region through 2035
Generalized Anxiety Disorder Treatment Market Insights by Drug Class, Therapies, Distribution Channel, and Region 2035
Lymphoproliferative Disorder Treatment Market

Thank you!
You will receive an email from our Business Development Manager. Please be sure to check your SPAM/JUNK folder too.
Chat With
MaRIA