Bleeding Control Kit Market Snapshot (2023 to 2033)

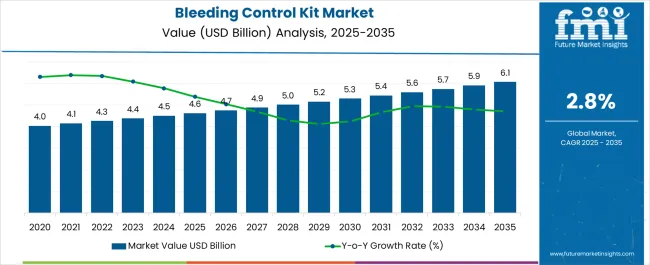
The estimated valuation of the bleeding control kit market in 2022 was USD 4,265.8 million and is anticipated to reach a valuation of USD 4,365.4 million in 2023.

An increase in the research and development initiatives required in the treatment of various types of blood disorders will also widen the scope for the growth of this market.

According to our researchers, the bleeding control kit market will be anticipated to expand at a CAGR of 2.9% between 2023 and 2033, totaling around USD 5,833.5 million by 2033.

The rising cases of accidents across the globe are set to propel the demand for bleeding control supplies in the upcoming years.

Bleeding control kits are specialized trauma kits that are mainly developed to provide professional responders with the products they require to stop life-threatening bleeding. These can help in controlling excessive bleeding caused by crushing, stabbing, or gunshot wounds.

These are specially designed to stop hemorrhaging and heavy bleeding. These are made to deliver rapid access to life-saving products that can control traumatic hemorrhaging and bleeding.

The rising usage of these kits to rescue workers injured on an assembly line, individuals injured in motorcycle accidents, victims of violent crimes, or hikers injured in remote locations is set to fuel the bleeding control kit market size.

These are expected to be increasingly adopted by municipal buildings, parks, office buildings, and educational institutions to treat victims of active shooter incidents and mass casualty events.

Attributes Details
Projected Forecast Value (2022) USD 4,265.8 million
Projected Forecast Value (2023) USD 4,365.4 million
Projected Forecast Value (2033) USD 5,833.5 million
Growth rate 2.9% CAGR
Forecast period 2023 to 2033

Global Bleeding Control Kit Market Historical Analysis (2017 to 2022) Vs. Forecast Outlook (2023 to 2033)

The global bleeding control kit market expanded at a CAGR of 1.9% between 2017 and 2022. Growth forecasts remain optimistic, with the market predicted to exhibit a CAGR of 2.9% between 2023 and 2033.

Rise in the funding by the federal government hence drives the adoption of bleeding control procedures and their solutions further by influencing the market.

Boost in healthcare expenditure, with the advancements in healthcare infrastructure, and growth in demand for expansion in the care for delivery positively affects the bleeding disorders treatment market.

Prominent Drivers Spearheading Bleeding Control Kit Market Growth

Increasing Number of Awareness Programs by Government Bodies

The increasing number of awareness programs by government bodies to make people understand the significance of bleeding control kits after an accident occurs is likely to drive the market.

The easy availability of such kits like first aid kits, and emergency kits in supermarkets and local medical stores is another factor that is expected to augur well for the market.

The rising cases of injuries resulting from trauma which may often lead to partial paralysis are anticipated to compel healthcare professionals to deliver quick treatment to patients. This is one of the major factors that is set to boost the sales of bleeding control kits in the near future.

Challenges Faced by the Bleeding Control Kit Industry

Lack of Skilled Healthcare Professionals

The inability of bleeding control kits to treat abrasions, frostbite, and burns may hinder their demand in specific areas. The lack of skilled healthcare professionals, especially in emerging economies is another vital factor that may hinder the growth in this market.

In addition to that, the expensive nature of state-of-the-art bleeding control procedures can decline their sales in these countries.

Region-wise Analysis

Region/Country The United States
Key Growth Factors
  • An increase in the number of accidents.
  • Presence of well-developed healthcare infrastructure in this region is also expected to augur well for the global market.
Key Statistic Captured a market share of 23.2% in 2022.
Region/Country North America
Key Growth Factors Favorable reimbursement policies and government support in terms of funding positively affect the regional market.
Key Statistic Estimated to record a value share of 27.8% in 2022.
Region/Country China
Key Growth Factors
  • Rapidly evolving healthcare sector in developing countries.
  • Boost in demand for quality and cost-effective healthcare.
  • Surge in penetration of health insurance.
  • Enlargement of medical tourism.
Key Statistic Anticipated to develop a 4.5% CAGR from 2023 to 2033.
Region/Country India
Key Growth Factors
  • Growth in the burden of new diseases.
  • The increase in the middle-class population is projected to augment the growth in this market.
Key Statistic Forecasted to record at 5.2% CAGR from 2023 to 2033.

Category-wise Analysis

Category Product
Sub Category Tourniquet
Key Growth Factors
  • Help in controlling bleeding by completely stopping the flow of blood to a wound.
  • Reserved for the worst bleeding as they mainly keep the patient from developing shocks.
  • Highly popular on the battlefield as they can be applied quickly.
  • Constant monitoring is not required.
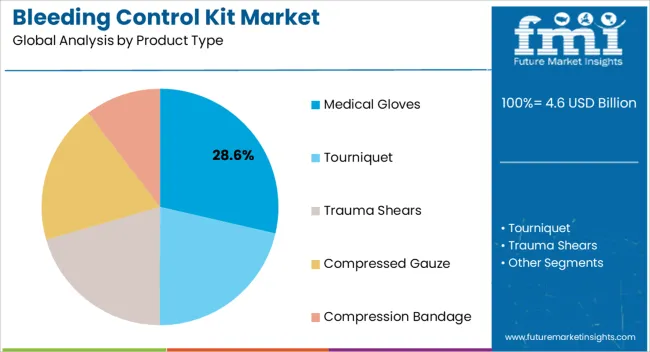
Key Statistics Attained a market share of 37.8% in 2022.
Category End-user
Sub Category Hospitals
Key Growth Factors
  • Presence of bleeding control kit facilities within a hospital positively affects various factors, like duration of hospital stay, total healthcare cost, quality of care, and availability of emergency care.
  • High admission rates of patients for proper treatment within hospital settings.
  • Pushing sales in this segment over the forecast period.
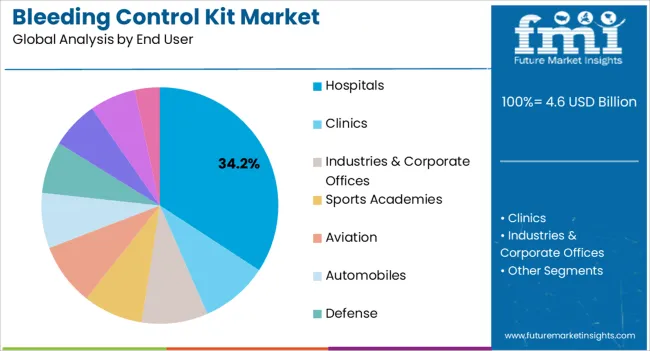
Key Statistics Captured a market share of 27.3%% in 2022.

Market Competition

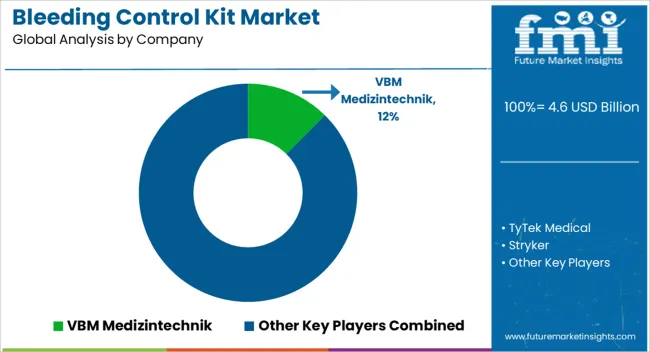
Some of the leading companies operating in the global bleeding control supplies market include VBM Medizintechnik, TyTek Medical, Stryker, Hammarplast Medical, Tactical Medical Solutions, Friedrich Bosch Medizintechnik, North American Rescue, Rudolf Riester, Zimmer Biomet, Cardinal Health, Delfi Medical, and Ulrich Medical among others.

The majority of the leading players are focusing on expanding their geographic presence by developing new manufacturing facilities, especially in the untapped regions. Meanwhile, a few other companies are aiming to launch novel products and engage in collaborations with local firms to gain a competitive edge in this market.

Some of the new developments are-

  • In January 2023, Tytek Medical Inc. manufactured medical supplies. The Company offered pre-hospital emergency medical supplies for trauma care such as bandages, shears, chest decompression needles, portable suction units, compressed gauze, and other clinical supplies.
  • In November 2022, Friedrich Bosch Medizintechnik aimed to grow with every technology in every region of the world and to be among the leading three suppliers in our relevant markets.

Scope of Report

Report Attribute Details
Growth Rate CAGR of 2.9% from 2023 to 2033
Base Year for Estimation 2022
Historical Data 2017 to 2022
Forecast Period 2023 to 2033
Quantitative Units Revenue in USD million and CAGR from 2023 to 2033
Report Coverage Revenue Forecast, Volume Forecast, Company Ranking, Competitive Landscape, Growth Factors, Trends and Pricing Analysis
Segments Covered Product Type, End User, Region
Regions Covered North America; Latin America; Western Europe; Eastern Europe; South Asia and Pacific; East Asia; The Middle East and Africa
Key Countries Profiled The United States, Canada, Brazil, Mexico, Rest of Latin America, Germany, The United Kingdom, France, Spain, Italy, Rest of Western Europe, Poland, Russia, Czech Republic, Romania, Rest of Eastern Europe, India, Bangladesh, Australia, New Zealand, Rest of South Asia and the Pacific, China, Japan, South Korea, GCC countries, South Africa, Israel, Rest of the Middle East and Africa
Key Companies Profiled VBM Medizintechnik; TyTek Medical; Stryker; Hammarplast Medical; Tactical Medical Solutions; Friedrich Bosch Medizintechnik; North American Rescue; Rudolf Riester; Zimmer Biomet; Cardinal Health

Key Segments Profiled in the Bleeding Control Kit Industry Survey

By Product Type:

  • Medical Gloves
  • Tourniquet
  • Trauma Shears
  • Compressed Gauze
  • Compression Bandage

By End User:

  • Clinics
  • Industries & Corporate Offices
  • Hospitals
  • Sports Academies
  • Aviation
  • Automobiles
  • Defense
  • Academic Institutes
  • Healthcare Facilities
  • Emergency Medical Services

By Region:

  • North America
  • Latin America
  • Western Europe
  • Eastern Europe
  • South Asia and Pacific
  • East Asia
  • The Middle East and Africa

Table of Content

  • 1. Executive Summary
  • 2. Market Overview
  • 3. Market Background
  • 4. Global Market Analysis 2017 to 2022 and Forecast, 2023 to 2033
  • 5. Global Market Analysis 2017 to 2022 and Forecast 2023 to 2033, By Product Type
    • 5.1. Medical Gloves
    • 5.2. Tourniquet
    • 5.3. Trauma Shears
    • 5.4. Compressed Gauze
    • 5.5. Compression Bandage
  • 6. Global Market Analysis 2017 to 2022 and Forecast 2023 to 2033, By End User
    • 6.1. Clinics
    • 6.2. Industries & Corporate Offices
    • 6.3. Hospitals
    • 6.4. Sports Academies
    • 6.5. Aviation
    • 6.6. Automobiles
    • 6.7. Defense
    • 6.8. Academic Institutes
    • 6.9. Healthcare Facilities
    • 6.10. Emergency Medical Services
  • 7. Global Market Analysis 2017 to 2022 and Forecast 2023 to 2033, By Region
    • 7.1. North America
    • 7.2. Latin America
    • 7.3. Western Europe
    • 7.4. Eastern Europe
    • 7.5. South Asia and Pacific
    • 7.6. East Asia
    • 7.7. Middle East and Africa
  • 8. North America Market Analysis 2017 to 2022 and Forecast 2023 to 2033, By Country
  • 9. Latin America Market Analysis 2017 to 2022 and Forecast 2023 to 2033, By Country
  • 10. Western Europe Market Analysis 2017 to 2022 and Forecast 2023 to 2033, By Country
  • 11. Eastern Europe Market Analysis 2017 to 2022 and Forecast 2023 to 2033, By Country
  • 12. South Asia and Pacific Market Analysis 2017 to 2022 and Forecast 2023 to 2033, By Country
  • 13. East Asia Market Analysis 2017 to 2022 and Forecast 2023 to 2033, By Country
  • 14. Middle East and Africa Market Analysis 2017 to 2022 and Forecast 2023 to 2033, By Country
  • 15. Key Countries Market Analysis
  • 16. Market Structure Analysis
  • 17. Competition Analysis
    • 17.1. VBM Medizintechnik
    • 17.2. TyTek Medical
    • 17.3. Stryker
    • 17.4. Hammarplast Medical
    • 17.5. Tactical Medical Solutions
    • 17.6. Friedrich Bosch Medizintechnik
    • 17.7. North American Rescue
    • 17.8. Rudolf Riester
    • 17.9. Zimmer Biomet
    • 17.10. Cardinal Health
    • 17.11. Delfi Medical
    • 17.12. Ulrich Medical
  • 18. Assumptions & Acronyms Used
  • 19. Research Methodology

List of Tables

Table 1: Global Market Value (US$ Million) Forecast by Region, 2018 to 2033

Table 2: Global Market Volume (Units) Forecast by Region, 2018 to 2033

Table 3: Global Market Value (US$ Million) Forecast by Product Type, 2018 to 2033

Table 4: Global Market Volume (Units) Forecast by Product Type, 2018 to 2033

Table 5: Global Market Value (US$ Million) Forecast by End User, 2018 to 2033

Table 6: Global Market Volume (Units) Forecast by End User, 2018 to 2033

Table 7: North America Market Value (US$ Million) Forecast by Country, 2018 to 2033

Table 8: North America Market Volume (Units) Forecast by Country, 2018 to 2033

Table 9: North America Market Value (US$ Million) Forecast by Product Type, 2018 to 2033

Table 10: North America Market Volume (Units) Forecast by Product Type, 2018 to 2033

Table 11: North America Market Value (US$ Million) Forecast by End User, 2018 to 2033

Table 12: North America Market Volume (Units) Forecast by End User, 2018 to 2033

Table 13: Latin America Market Value (US$ Million) Forecast by Country, 2018 to 2033

Table 14: Latin America Market Volume (Units) Forecast by Country, 2018 to 2033

Table 15: Latin America Market Value (US$ Million) Forecast by Product Type, 2018 to 2033

Table 16: Latin America Market Volume (Units) Forecast by Product Type, 2018 to 2033

Table 17: Latin America Market Value (US$ Million) Forecast by End User, 2018 to 2033

Table 18: Latin America Market Volume (Units) Forecast by End User, 2018 to 2033

Table 19: Western Europe Market Value (US$ Million) Forecast by Country, 2018 to 2033

Table 20: Western Europe Market Volume (Units) Forecast by Country, 2018 to 2033

Table 21: Western Europe Market Value (US$ Million) Forecast by Product Type, 2018 to 2033

Table 22: Western Europe Market Volume (Units) Forecast by Product Type, 2018 to 2033

Table 23: Western Europe Market Value (US$ Million) Forecast by End User, 2018 to 2033

Table 24: Western Europe Market Volume (Units) Forecast by End User, 2018 to 2033

Table 25: Eastern Europe Market Value (US$ Million) Forecast by Country, 2018 to 2033

Table 26: Eastern Europe Market Volume (Units) Forecast by Country, 2018 to 2033

Table 27: Eastern Europe Market Value (US$ Million) Forecast by Product Type, 2018 to 2033

Table 28: Eastern Europe Market Volume (Units) Forecast by Product Type, 2018 to 2033

Table 29: Eastern Europe Market Value (US$ Million) Forecast by End User, 2018 to 2033

Table 30: Eastern Europe Market Volume (Units) Forecast by End User, 2018 to 2033

Table 31: South Asia and Pacific Market Value (US$ Million) Forecast by Country, 2018 to 2033

Table 32: South Asia and Pacific Market Volume (Units) Forecast by Country, 2018 to 2033

Table 33: South Asia and Pacific Market Value (US$ Million) Forecast by Product Type, 2018 to 2033

Table 34: South Asia and Pacific Market Volume (Units) Forecast by Product Type, 2018 to 2033

Table 35: South Asia and Pacific Market Value (US$ Million) Forecast by End User, 2018 to 2033

Table 36: South Asia and Pacific Market Volume (Units) Forecast by End User, 2018 to 2033

Table 37: East Asia Market Value (US$ Million) Forecast by Country, 2018 to 2033

Table 38: East Asia Market Volume (Units) Forecast by Country, 2018 to 2033

Table 39: East Asia Market Value (US$ Million) Forecast by Product Type, 2018 to 2033

Table 40: East Asia Market Volume (Units) Forecast by Product Type, 2018 to 2033

Table 41: East Asia Market Value (US$ Million) Forecast by End User, 2018 to 2033

Table 42: East Asia Market Volume (Units) Forecast by End User, 2018 to 2033

Table 43: Middle East and Africa Market Value (US$ Million) Forecast by Country, 2018 to 2033

Table 44: Middle East and Africa Market Volume (Units) Forecast by Country, 2018 to 2033

Table 45: Middle East and Africa Market Value (US$ Million) Forecast by Product Type, 2018 to 2033

Table 46: Middle East and Africa Market Volume (Units) Forecast by Product Type, 2018 to 2033

Table 47: Middle East and Africa Market Value (US$ Million) Forecast by End User, 2018 to 2033

Table 48: Middle East and Africa Market Volume (Units) Forecast by End User, 2018 to 2033

List of Figures

Figure 1: Global Market Value (US$ Million) by Product Type, 2023 to 2033

Figure 2: Global Market Value (US$ Million) by End User, 2023 to 2033

Figure 3: Global Market Value (US$ Million) by Region, 2023 to 2033

Figure 4: Global Market Value (US$ Million) Analysis by Region, 2018 to 2033

Figure 5: Global Market Volume (Units) Analysis by Region, 2018 to 2033

Figure 6: Global Market Value Share (%) and BPS Analysis by Region, 2023 to 2033

Figure 7: Global Market Y-o-Y Growth (%) Projections by Region, 2023 to 2033

Figure 8: Global Market Value (US$ Million) Analysis by Product Type, 2018 to 2033

Figure 9: Global Market Volume (Units) Analysis by Product Type, 2018 to 2033

Figure 10: Global Market Value Share (%) and BPS Analysis by Product Type, 2023 to 2033

Figure 11: Global Market Y-o-Y Growth (%) Projections by Product Type, 2023 to 2033

Figure 12: Global Market Value (US$ Million) Analysis by End User, 2018 to 2033

Figure 13: Global Market Volume (Units) Analysis by End User, 2018 to 2033

Figure 14: Global Market Value Share (%) and BPS Analysis by End User, 2023 to 2033

Figure 15: Global Market Y-o-Y Growth (%) Projections by End User, 2023 to 2033

Figure 16: Global Market Attractiveness by Product Type, 2023 to 2033

Figure 17: Global Market Attractiveness by End User, 2023 to 2033

Figure 18: Global Market Attractiveness by Region, 2023 to 2033

Figure 19: North America Market Value (US$ Million) by Product Type, 2023 to 2033

Figure 20: North America Market Value (US$ Million) by End User, 2023 to 2033

Figure 21: North America Market Value (US$ Million) by Country, 2023 to 2033

Figure 22: North America Market Value (US$ Million) Analysis by Country, 2018 to 2033

Figure 23: North America Market Volume (Units) Analysis by Country, 2018 to 2033

Figure 24: North America Market Value Share (%) and BPS Analysis by Country, 2023 to 2033

Figure 25: North America Market Y-o-Y Growth (%) Projections by Country, 2023 to 2033

Figure 26: North America Market Value (US$ Million) Analysis by Product Type, 2018 to 2033

Figure 27: North America Market Volume (Units) Analysis by Product Type, 2018 to 2033

Figure 28: North America Market Value Share (%) and BPS Analysis by Product Type, 2023 to 2033

Figure 29: North America Market Y-o-Y Growth (%) Projections by Product Type, 2023 to 2033

Figure 30: North America Market Value (US$ Million) Analysis by End User, 2018 to 2033

Figure 31: North America Market Volume (Units) Analysis by End User, 2018 to 2033

Figure 32: North America Market Value Share (%) and BPS Analysis by End User, 2023 to 2033

Figure 33: North America Market Y-o-Y Growth (%) Projections by End User, 2023 to 2033

Figure 34: North America Market Attractiveness by Product Type, 2023 to 2033

Figure 35: North America Market Attractiveness by End User, 2023 to 2033

Figure 36: North America Market Attractiveness by Country, 2023 to 2033

Figure 37: Latin America Market Value (US$ Million) by Product Type, 2023 to 2033

Figure 38: Latin America Market Value (US$ Million) by End User, 2023 to 2033

Figure 39: Latin America Market Value (US$ Million) by Country, 2023 to 2033

Figure 40: Latin America Market Value (US$ Million) Analysis by Country, 2018 to 2033

Figure 41: Latin America Market Volume (Units) Analysis by Country, 2018 to 2033

Figure 42: Latin America Market Value Share (%) and BPS Analysis by Country, 2023 to 2033

Figure 43: Latin America Market Y-o-Y Growth (%) Projections by Country, 2023 to 2033

Figure 44: Latin America Market Value (US$ Million) Analysis by Product Type, 2018 to 2033

Figure 45: Latin America Market Volume (Units) Analysis by Product Type, 2018 to 2033

Figure 46: Latin America Market Value Share (%) and BPS Analysis by Product Type, 2023 to 2033

Figure 47: Latin America Market Y-o-Y Growth (%) Projections by Product Type, 2023 to 2033

Figure 48: Latin America Market Value (US$ Million) Analysis by End User, 2018 to 2033

Figure 49: Latin America Market Volume (Units) Analysis by End User, 2018 to 2033

Figure 50: Latin America Market Value Share (%) and BPS Analysis by End User, 2023 to 2033

Figure 51: Latin America Market Y-o-Y Growth (%) Projections by End User, 2023 to 2033

Figure 52: Latin America Market Attractiveness by Product Type, 2023 to 2033

Figure 53: Latin America Market Attractiveness by End User, 2023 to 2033

Figure 54: Latin America Market Attractiveness by Country, 2023 to 2033

Figure 55: Western Europe Market Value (US$ Million) by Product Type, 2023 to 2033

Figure 56: Western Europe Market Value (US$ Million) by End User, 2023 to 2033

Figure 57: Western Europe Market Value (US$ Million) by Country, 2023 to 2033

Figure 58: Western Europe Market Value (US$ Million) Analysis by Country, 2018 to 2033

Figure 59: Western Europe Market Volume (Units) Analysis by Country, 2018 to 2033

Figure 60: Western Europe Market Value Share (%) and BPS Analysis by Country, 2023 to 2033

Figure 61: Western Europe Market Y-o-Y Growth (%) Projections by Country, 2023 to 2033

Figure 62: Western Europe Market Value (US$ Million) Analysis by Product Type, 2018 to 2033

Figure 63: Western Europe Market Volume (Units) Analysis by Product Type, 2018 to 2033

Figure 64: Western Europe Market Value Share (%) and BPS Analysis by Product Type, 2023 to 2033

Figure 65: Western Europe Market Y-o-Y Growth (%) Projections by Product Type, 2023 to 2033

Figure 66: Western Europe Market Value (US$ Million) Analysis by End User, 2018 to 2033

Figure 67: Western Europe Market Volume (Units) Analysis by End User, 2018 to 2033

Figure 68: Western Europe Market Value Share (%) and BPS Analysis by End User, 2023 to 2033

Figure 69: Western Europe Market Y-o-Y Growth (%) Projections by End User, 2023 to 2033

Figure 70: Western Europe Market Attractiveness by Product Type, 2023 to 2033

Figure 71: Western Europe Market Attractiveness by End User, 2023 to 2033

Figure 72: Western Europe Market Attractiveness by Country, 2023 to 2033

Figure 73: Eastern Europe Market Value (US$ Million) by Product Type, 2023 to 2033

Figure 74: Eastern Europe Market Value (US$ Million) by End User, 2023 to 2033

Figure 75: Eastern Europe Market Value (US$ Million) by Country, 2023 to 2033

Figure 76: Eastern Europe Market Value (US$ Million) Analysis by Country, 2018 to 2033

Figure 77: Eastern Europe Market Volume (Units) Analysis by Country, 2018 to 2033

Figure 78: Eastern Europe Market Value Share (%) and BPS Analysis by Country, 2023 to 2033

Figure 79: Eastern Europe Market Y-o-Y Growth (%) Projections by Country, 2023 to 2033

Figure 80: Eastern Europe Market Value (US$ Million) Analysis by Product Type, 2018 to 2033

Figure 81: Eastern Europe Market Volume (Units) Analysis by Product Type, 2018 to 2033

Figure 82: Eastern Europe Market Value Share (%) and BPS Analysis by Product Type, 2023 to 2033

Figure 83: Eastern Europe Market Y-o-Y Growth (%) Projections by Product Type, 2023 to 2033

Figure 84: Eastern Europe Market Value (US$ Million) Analysis by End User, 2018 to 2033

Figure 85: Eastern Europe Market Volume (Units) Analysis by End User, 2018 to 2033

Figure 86: Eastern Europe Market Value Share (%) and BPS Analysis by End User, 2023 to 2033

Figure 87: Eastern Europe Market Y-o-Y Growth (%) Projections by End User, 2023 to 2033

Figure 88: Eastern Europe Market Attractiveness by Product Type, 2023 to 2033

Figure 89: Eastern Europe Market Attractiveness by End User, 2023 to 2033

Figure 90: Eastern Europe Market Attractiveness by Country, 2023 to 2033

Figure 91: South Asia and Pacific Market Value (US$ Million) by Product Type, 2023 to 2033

Figure 92: South Asia and Pacific Market Value (US$ Million) by End User, 2023 to 2033

Figure 93: South Asia and Pacific Market Value (US$ Million) by Country, 2023 to 2033

Figure 94: South Asia and Pacific Market Value (US$ Million) Analysis by Country, 2018 to 2033

Figure 95: South Asia and Pacific Market Volume (Units) Analysis by Country, 2018 to 2033

Figure 96: South Asia and Pacific Market Value Share (%) and BPS Analysis by Country, 2023 to 2033

Figure 97: South Asia and Pacific Market Y-o-Y Growth (%) Projections by Country, 2023 to 2033

Figure 98: South Asia and Pacific Market Value (US$ Million) Analysis by Product Type, 2018 to 2033

Figure 99: South Asia and Pacific Market Volume (Units) Analysis by Product Type, 2018 to 2033

Figure 100: South Asia and Pacific Market Value Share (%) and BPS Analysis by Product Type, 2023 to 2033

Figure 101: South Asia and Pacific Market Y-o-Y Growth (%) Projections by Product Type, 2023 to 2033

Figure 102: South Asia and Pacific Market Value (US$ Million) Analysis by End User, 2018 to 2033

Figure 103: South Asia and Pacific Market Volume (Units) Analysis by End User, 2018 to 2033

Figure 104: South Asia and Pacific Market Value Share (%) and BPS Analysis by End User, 2023 to 2033

Figure 105: South Asia and Pacific Market Y-o-Y Growth (%) Projections by End User, 2023 to 2033

Figure 106: South Asia and Pacific Market Attractiveness by Product Type, 2023 to 2033

Figure 107: South Asia and Pacific Market Attractiveness by End User, 2023 to 2033

Figure 108: South Asia and Pacific Market Attractiveness by Country, 2023 to 2033

Figure 109: East Asia Market Value (US$ Million) by Product Type, 2023 to 2033

Figure 110: East Asia Market Value (US$ Million) by End User, 2023 to 2033

Figure 111: East Asia Market Value (US$ Million) by Country, 2023 to 2033

Figure 112: East Asia Market Value (US$ Million) Analysis by Country, 2018 to 2033

Figure 113: East Asia Market Volume (Units) Analysis by Country, 2018 to 2033

Figure 114: East Asia Market Value Share (%) and BPS Analysis by Country, 2023 to 2033

Figure 115: East Asia Market Y-o-Y Growth (%) Projections by Country, 2023 to 2033

Figure 116: East Asia Market Value (US$ Million) Analysis by Product Type, 2018 to 2033

Figure 117: East Asia Market Volume (Units) Analysis by Product Type, 2018 to 2033

Figure 118: East Asia Market Value Share (%) and BPS Analysis by Product Type, 2023 to 2033

Figure 119: East Asia Market Y-o-Y Growth (%) Projections by Product Type, 2023 to 2033

Figure 120: East Asia Market Value (US$ Million) Analysis by End User, 2018 to 2033

Figure 121: East Asia Market Volume (Units) Analysis by End User, 2018 to 2033

Figure 122: East Asia Market Value Share (%) and BPS Analysis by End User, 2023 to 2033

Figure 123: East Asia Market Y-o-Y Growth (%) Projections by End User, 2023 to 2033

Figure 124: East Asia Market Attractiveness by Product Type, 2023 to 2033

Figure 125: East Asia Market Attractiveness by End User, 2023 to 2033

Figure 126: East Asia Market Attractiveness by Country, 2023 to 2033

Figure 127: Middle East and Africa Market Value (US$ Million) by Product Type, 2023 to 2033

Figure 128: Middle East and Africa Market Value (US$ Million) by End User, 2023 to 2033

Figure 129: Middle East and Africa Market Value (US$ Million) by Country, 2023 to 2033

Figure 130: Middle East and Africa Market Value (US$ Million) Analysis by Country, 2018 to 2033

Figure 131: Middle East and Africa Market Volume (Units) Analysis by Country, 2018 to 2033

Figure 132: Middle East and Africa Market Value Share (%) and BPS Analysis by Country, 2023 to 2033

Figure 133: Middle East and Africa Market Y-o-Y Growth (%) Projections by Country, 2023 to 2033

Figure 134: Middle East and Africa Market Value (US$ Million) Analysis by Product Type, 2018 to 2033

Figure 135: Middle East and Africa Market Volume (Units) Analysis by Product Type, 2018 to 2033

Figure 136: Middle East and Africa Market Value Share (%) and BPS Analysis by Product Type, 2023 to 2033

Figure 137: Middle East and Africa Market Y-o-Y Growth (%) Projections by Product Type, 2023 to 2033

Figure 138: Middle East and Africa Market Value (US$ Million) Analysis by End User, 2018 to 2033

Figure 139: Middle East and Africa Market Volume (Units) Analysis by End User, 2018 to 2033

Figure 140: Middle East and Africa Market Value Share (%) and BPS Analysis by End User, 2023 to 2033

Figure 141: Middle East and Africa Market Y-o-Y Growth (%) Projections by End User, 2023 to 2033

Figure 142: Middle East and Africa Market Attractiveness by Product Type, 2023 to 2033

Figure 143: Middle East and Africa Market Attractiveness by End User, 2023 to 2033

Figure 144: Middle East and Africa Market Attractiveness by Country, 2023 to 2033

Frequently Asked Questions

What is the market value in 2023?

The market in 2023 is valued at USD 4,365.4 million.

How was the market’s historical performance?

The market rose at a 1.9% CAGR from 2017 to 2022.

What will be the growth rate until 2033?

Until 2033, the market will experience a 2.9% CAGR.

What will be the market value in 2033?

The market shall reach USD 5,833.5 million in 2033.

What was the market value in 2022?

The market in 2022 was valued at USD 4,265.8 million.

Explore Similar Insights

Future Market Insights

Bleeding Control Kit Market