Microcontroller Unit Market Analysis – Size, Share, and Forecast 2023 to 2033

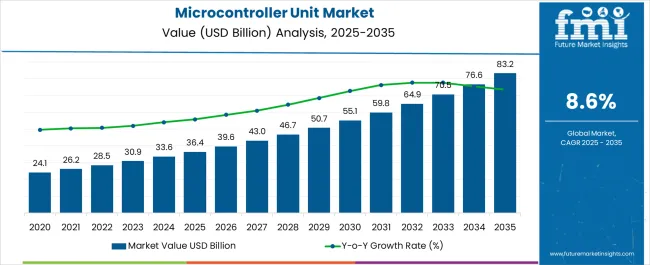
Global microcontroller unit sales in 2022 reached a high of USD 28.2 billion. Overall microcontroller unit demand will increase at 8.6% CAGR between 2023 and 2033. Accordingly, the global microcontroller unit market size is set to reach USD 70.6 billion by 2033.

In 2023, total market valuation will reach USD 30.9 billon. By product, 32-bit microcontroller units will remain the top revenue-generating segment. The target segment is likely to accelerate at 8.5% CAGR through 2033.

  • Rising demand for automatically controlled devices and products will boost the market
  • High penetration of digitalization across industries to elevate microcontrollers demand
  • Growing popularity of autonomous vehicles will create opportunities for microcontroller manufacturers
  • Increasing adoption of automation and emergence of industry 4.0 to propel IoT microcontrollers demand
  • Surging need for advanced medical devices will foster microcontroller sales
  • Escalating trend of miniaturization worldwide to trigger microcontroller unit sales
  • Emergence of smart grids coupled with rising awareness about smart energy management will spur growth

A microcontroller unit is a computer on a single very large scale Integrated (VLSI) chip. It has processing units, programmable memory, and input/output devices. Microcontroller units find applications in various industries. This includes automotive, medical, consumer electronics, and military industries.

Microcontrollers can act as microcomputers without having any digital parts. They reduce the cost and size of systems due to higher integration inside systems. They are easy to use and require less time to perform applications.

Microcontroller units or microcontrollers are being increasingly used in automatically controlled products and systems. This includes remote controls, automobile engine control systems, power tools, and other embedded systems.

Burgeoning demand for consumer electronics is set to boost microcontroller unit sales. Microcontrollers find applications in automatic home appliances such as washing machines, cameras, robots, ovens, etc. High production and usage of these devices will elevate demand in the global market.

Increasing applications in wireless fire detection systems, security equipment, medical instruments will bode well for the market. Besides this, rising usage in auto-braking systems, speedometers, and other vehicle components will create growth prospects.

North America is likely to retain its dominance in the global microcontroller unit industry. In 2023, North America microcontroller unit market size will be valued at USD 12.68 billion. By the end of 2033, North America market is set to reach USD 29.01 billion in 2033.

Rapid shift towards factory automation and rising popularity of autonomous vehicles are driving North America market. Further, increasing adoption of smart and advanced medical devices and home appliances will elevate demand. In addition, rising usage of advanced driver assistance systems (ADAS) fuel demand

Attributes Key Insights
Microcontroller Unit Market Estimated Size (2023) USD 30.9 billion
Projected Market Size (2033) USD 70.6 billion
Value-based CAGR (2023 to 2033) 8.6%
USA Market CAGR (2023 to 2033) 7.5%

2018 to 2022 Global Microcontroller Unit Sales Outlook Compared to Forecast from 2023 to 2033

As per Future Market Insights (FMI), sales of microcontroller units grew at around 9.5% CAGR from 2018 to 2022. Total market valuation reached USD 28.2 billion in 2022. Between 2023 and 2033, the global market will expand at 8.6% CAGR. This will create an absolute $ opportunity of USD 39.8 billion by 2033.

Growing adoption of microcontroller units across diverse industries is a prominent factor driving the global market forward.

In medical industry, microcontrollers are widely used in medical equipment. For instance, American Hospitals Association reports that 76% of hospitals are connected with patients through smart medical device technology.

In nebulizers that are used for asthma, cystic fibrosis, in Bluetooth connected thermometers; PIC18F-Q40 microcontrollers are used. Microcontrollers made by STMicroelectronics such as STM32 series units are used in medical applications such as blood pressure monitors, digital thermometers, glucose meters, and dialysis machines.

In automobile industry, microcontrollers such as Infineon tri-core, Atmel AVR, PIC microcontroller, and Renesas microcontroller are used. Infineon tri-core 32 microcontrollers are used in gearboxes to control the injection and in combustion engine ignition. They are also used in electrical and hybrid vehicle drives.

Atmel AVR microcontrollers are used to distribute the power and flexibility for vehicles and they increase performance. Renesas microcontrollers are used in vehicles as they deliver high performance and low power consumption. These microcontrollers are used in applications such as vehicle control, power train, and driver information.

Thus, applications of microcontrollers are in varied industries and this triggers the growth of the microcontroller unit market.
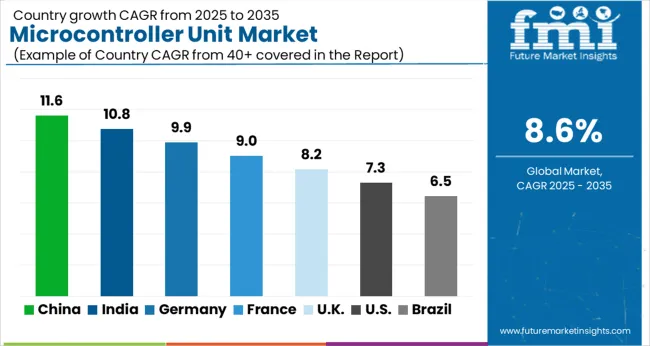
Top Countries Driving Development, Integration, and Deployment of Microcontroller Units

Country United States
Projected CAGR (2023 to 2033) 7.5%
Historical CAGR (2018 to 2022) 8.0%
Market Value (2033) USD 22.6 billion
Country United Kingdom
Projected CAGR (2023 to 2033) 7.8%
Historical CAGR (2018 to 2022) 8.3%
Market Value (2033) USD 3.6 billion
Country China
Projected CAGR (2023 to 2033) 9.6%
Historical CAGR (2018 to 2022) 11.0%
Market Value (2033) USD 6.1 billion
Country Japan
Projected CAGR (2023 to 2033) 8.1%
Historical CAGR (2018 to 2022) 8.7%
Market Value (2033) USD 5.2 billion
Country South Korea
Projected CAGR (2023 to 2033) 9.0%
Historical CAGR (2018 to 2022) 10.3%
Market Value (2033) USD 2.9 billion

What is the USA Considered a Prominent Market for Microcontroller Units?

Rising Popularity of Electric Vehicles and Increasing Government Spending Making the USA a Dominant Market

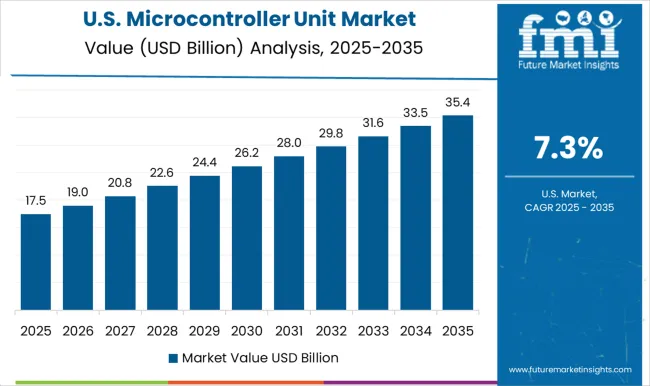
The United States microcontroller unit market is set to reach USD 22.6 billion by 2033. Over the next ten years, the USA market will create an absolute $ opportunity of USD 11.6 billion. Microcontroller unit sales in the United States increased at a CAGR of 8.0% from 2018 to 2022. However, between 2023 and 2033, sales will exhibit a CAGR of 7.5%.

Robust growth of automotive industry is a prominent factor driving microcontroller sales in the USA. In recent years, there has been a dramatic increase in the adoption of electric vehicles across the United States. This trend is expected to further escalate over the next ten years due to rising pollution levels.

Development of autonomous vehicles with ADAS systems will elevate microcontroller unit demand across China. Sales will also surge due to rising applications in defence & military, and medical device sectors

The United States government is striving to reduce the country’s dependence on exports. For instance, in 2022, President Joe Biden signed ‘Creating Helpful Incentives to Produce Semiconductors and Science Act (CHIPS Act)’. This will allocate USD 52.7 billion in grants to the chip manufacturing companies.

The new act will create many jobs in the region, and such initiatives will trigger the microcontrollers’ market demand across the United States. Further, surging popularity of portable medical devices is likely to boost the USA market.

What is Fueling Microcontroller Unit Sales in China?

Rising Demand for Consumer Electronics Spurring Microcontroller Unit Sales in China

China microcontroller unit market is forecast to expand at 9.6% CAGR between 2023 and 2033. Total sales of microcontroller units in China are likely to total a valuation of USD 6.1 billion by 2033.

Microcontroller unit industry in China grew at a CAGR of 11.0% from 2018 to 2022. Between 2023 and 2033, China’s market will create an absolute $ opportunity of USD 3.7 billion.

Escalating demand for consumer electronics is driving microcontroller unit sales in China. Further, expansion of automotive sector will create growth prospects for the market.

China has become one of the leading producers and consumers of electronic devices worldwide. Factors such as high penetration of digitalization have resulted in increasing adoption of various electronic devices. This includes home appliances and smartphones. Driven by this, sales of microcontroller units are rising across China and the trend is likely to continue through 2033.

Large presence of leading microcontroller unit manufacturers is also positively impacting China market. Various companies are preferring to get microcontrollers and other electronics items from China-based companies. This is because they provide advanced solutions at lower costs.

For instance, in November 2020, Tesla, USA automobile maker, signed a joint venture with a company- Annex which is based in Jinan, China. Under the agreement, the company will deliver microcontroller chips and electronic solutions.

Microcontroller Unit Industry Analysis by Architecture, Application, and End Use

Which Application will Generate Most Demand for Microcontroller Units?

Consumer Electronics to Generate Maximum Revenues Through 2033

Consumer electronics segment is likely to generate most demand for microcontroller units. During the historical period, consumer electronics segment grew at 9.1% CAGR. The consumer electronics segment will expand at 8.4% CAGR through 2033. This is due to increasing production of consumer electronics.

Use of microcontrollers in smartphones, smartwatches, and image sensing devices is immense. As of 2020, smartphone semiconductors’ revenue in the USA was USD 116 billion. By 2025, it is likely to reach USD 162 billion.

Such developments boost the demand of microcontroller units as they are of utmost importance in the manufacturing of smartphones. Thus, applications of microcontrollers in consumer electronics will boost the market.
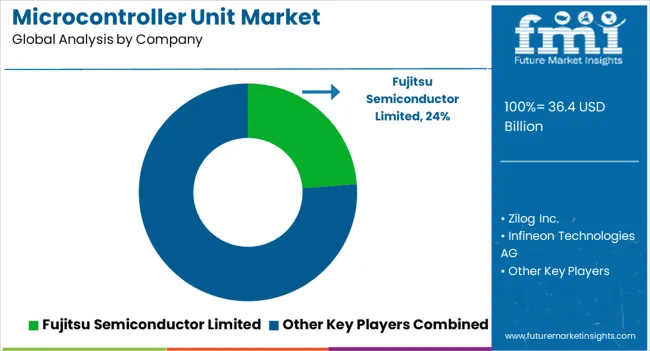
Leading Companies in the Microcontroller Unit Industry

Key companies in microcontroller unit market include Renesas Electronics Corporation, Microchip Technology Inc., Yamaichi Electronics Co., Ltd., Zilog, Inc., Infineon Technologies AG, Fujitsu Semiconductor Limited, Texas Instruments Incorporated, TE Connectivity Ltd., and STMicroelectronics, and NXP Semiconductors.

Microcontroller unit manufacturers are employing a variety of strategies to increase their sales. This includes new product launches, mergers, acquisitions, and research & development.

Recent Developments:

  • In November 2022, to accelerate the digital transformation of its trust Fujitsu Limited signed a strategic agreement with SettleMint NV.
  • In November 2022, Fujitsu limited, information and communications technology company announced that it will develop a research and development center in Tel Aviv. This will help the company expand its business in Israel with the help of researchers from Japan and Europe. The new centre will be a hub of artificial intelligence based on computer networks.
  • In November 2022, NXP Semiconductors, a Netherlands-based semiconductors manufacturing company announced that for modern electrification it has developed S32K39 series microcontrollers. The series S32K39 series of microcontrollers has been manufactured to be used in electrical vehicles. They offer high speed, high resolution, and increased power efficiency for electrical vehicles.
  • In August 2021, Analog devices- a United States-based semiconductor manufacturer acquired Maxim Integrated Products.

Report Scope and Coverage for Microcontroller Unit Market

Attribute Details
Estimated Market Size (2023) USD 30.9 billion
Projected Market Size (2033) USD 70.6 billion
Anticipated Growth Rate (2023 to 2033) 8.6% CAGR
Forecast Period 2023 to 2033
Historical Data Available for 2018 to 2022
Market Analysis USD Million for Value and MT for Volume
Key Regions Covered North America; Latin America; Europe; Asia Pacific; and the Middle East & Africa
Key Countries Covered United States, Canada, Brazil, Mexico, Germany, United Kingdom, France, Italy, Spain, Nordic, Russia, Poland, China, India, Thailand, Indonesia, Australia and New Zealand, Japan, GCC countries, North Africa, South Africa, and others.
Key Segments Covered Product, Application, and Region
Key Companies Profiled Fujitsu Semiconductor Limited; Zilog Inc.; Infineon Technologies AG; NXP Semiconductors; Microchip Technology Inc.; Renesas Electronics Corporation; TE Connectivity Ltd.; STMicroelectronics; Texas Instruments Incorporated; Yamaichi Electronics Co. Ltd.
Report Coverage Market Forecast, Company Share Analysis, Competition Intelligence, Drivers Restraints Opportunity Trends Analysis, Market Dynamics and Challenges, and Strategic Growth Initiatives

Top Investment Segments in the Microcontroller Unit Industry

By Product:

  • 32-bit
  • 16-bit
  • 08-bit

By Application:

  • Consumer Electronics
  • Automotive
  • Military and Defense
  • Medical Devices
  • Industrial

By Region:

  • North America
  • Europe
  • Asia Pacific
  • Latin America
  • Middle East & Africa

Table of Content

  • 1. Executive Summary | Microcontroller Unit Market
  • 2. Market Overview
  • 3. Market Background
  • 4. Global Market Analysis 2018 to 2022 and Forecast, 2023 to 2033
  • 5. Global Market Analysis 2018 to 2022 and Forecast 2023 to 2033, By Product
    • 5.1. 32-bit
    • 5.2. 16-bit
    • 5.3. 8-bit
  • 6. Global Market Analysis 2018 to 2022 and Forecast 2023 to 2033, By Application
    • 6.1. Consumer Electronics
    • 6.2. Automotive
    • 6.3. Military & Defense
    • 6.4. Medical Devices
    • 6.5. Industrial
  • 7. Global Market Analysis 2018 to 2022 and Forecast 2023 to 2033, By Region
    • 7.1. North America
    • 7.2. Latin America
    • 7.3. Europe
    • 7.4. Asia Pacific
    • 7.5. Middle East & Africa
  • 8. North America Market Analysis 2018 to 2022 and Forecast 2023 to 2033, By Country
  • 9. Latin America Market Analysis 2018 to 2022 and Forecast 2023 to 2033, By Country
  • 10. Europe Market Analysis 2018 to 2022 and Forecast 2023 to 2033, By Country
  • 11. Asia Pacific Market Analysis 2018 to 2022 and Forecast 2023 to 2033, By Country
  • 12. Middle East & Africa Market Analysis 2018 to 2022 and Forecast 2023 to 2033, By Country
  • 13. Key Countries Market Analysis
  • 14. Market Structure Analysis
  • 15. Competition Analysis
    • 15.1. Fujitsu Semiconductor Limited
    • 15.2. Zilog, Inc.
    • 15.3. Infineon Technologies AG
    • 15.4. NXP Semiconductors
    • 15.5. Microchip Technology Inc.
    • 15.6. Renesas Electronics Corporation
    • 15.7. TE Connectivity Ltd.
    • 15.8. STMicroelectronics
    • 15.9. Texas Instruments Incorporated
    • 15.10. Yamaichi Electronics Co., Ltd.
  • 16. Assumptions & Acronyms Used
  • 17. Research Methodology

List of Tables

Table 1: Global Market Value (US$ Million) Forecast by Region, 2018 to 2033

Table 2: Global Market Volume (Units) Forecast by Region, 2018 to 2033

Table 3: Global Market Value (US$ Million) Forecast by Product, 2018 to 2033

Table 4: Global Market Volume (Units) Forecast by Product, 2018 to 2033

Table 5: Global Market Value (US$ Million) Forecast by Application, 2018 to 2033

Table 6: Global Market Volume (Units) Forecast by Application, 2018 to 2033

Table 7: North America Market Value (US$ Million) Forecast by Country, 2018 to 2033

Table 8: North America Market Volume (Units) Forecast by Country, 2018 to 2033

Table 9: North America Market Value (US$ Million) Forecast by Product, 2018 to 2033

Table 10: North America Market Volume (Units) Forecast by Product, 2018 to 2033

Table 11: North America Market Value (US$ Million) Forecast by Application, 2018 to 2033

Table 12: North America Market Volume (Units) Forecast by Application, 2018 to 2033

Table 13: Latin America Market Value (US$ Million) Forecast by Country, 2018 to 2033

Table 14: Latin America Market Volume (Units) Forecast by Country, 2018 to 2033

Table 15: Latin America Market Value (US$ Million) Forecast by Product, 2018 to 2033

Table 16: Latin America Market Volume (Units) Forecast by Product, 2018 to 2033

Table 17: Latin America Market Value (US$ Million) Forecast by Application, 2018 to 2033

Table 18: Latin America Market Volume (Units) Forecast by Application, 2018 to 2033

Table 19: Europe Market Value (US$ Million) Forecast by Country, 2018 to 2033

Table 20: Europe Market Volume (Units) Forecast by Country, 2018 to 2033

Table 21: Europe Market Value (US$ Million) Forecast by Product, 2018 to 2033

Table 22: Europe Market Volume (Units) Forecast by Product, 2018 to 2033

Table 23: Europe Market Value (US$ Million) Forecast by Application, 2018 to 2033

Table 24: Europe Market Volume (Units) Forecast by Application, 2018 to 2033

Table 25: Asia Pacific Market Value (US$ Million) Forecast by Country, 2018 to 2033

Table 26: Asia Pacific Market Volume (Units) Forecast by Country, 2018 to 2033

Table 27: Asia Pacific Market Value (US$ Million) Forecast by Product, 2018 to 2033

Table 28: Asia Pacific Market Volume (Units) Forecast by Product, 2018 to 2033

Table 29: Asia Pacific Market Value (US$ Million) Forecast by Application, 2018 to 2033

Table 30: Asia Pacific Market Volume (Units) Forecast by Application, 2018 to 2033

Table 31: Middle East & Africa Market Value (US$ Million) Forecast by Country, 2018 to 2033

Table 32: Middle East & Africa Market Volume (Units) Forecast by Country, 2018 to 2033

Table 33: Middle East & Africa Market Value (US$ Million) Forecast by Product, 2018 to 2033

Table 34: Middle East & Africa Market Volume (Units) Forecast by Product, 2018 to 2033

Table 35: Middle East & Africa Market Value (US$ Million) Forecast by Application, 2018 to 2033

Table 36: Middle East & Africa Market Volume (Units) Forecast by Application, 2018 to 2033

List of Figures

Figure 1: Global Market Value (US$ Million) by Product, 2023 to 2033

Figure 2: Global Market Value (US$ Million) by Application, 2023 to 2033

Figure 3: Global Market Value (US$ Million) by Region, 2023 to 2033

Figure 4: Global Market Value (US$ Million) Analysis by Region, 2018 to 2033

Figure 5: Global Market Volume (Units) Analysis by Region, 2018 to 2033

Figure 6: Global Market Value Share (%) and BPS Analysis by Region, 2023 to 2033

Figure 7: Global Market Y-o-Y Growth (%) Projections by Region, 2023 to 2033

Figure 8: Global Market Value (US$ Million) Analysis by Product, 2018 to 2033

Figure 9: Global Market Volume (Units) Analysis by Product, 2018 to 2033

Figure 10: Global Market Value Share (%) and BPS Analysis by Product, 2023 to 2033

Figure 11: Global Market Y-o-Y Growth (%) Projections by Product, 2023 to 2033

Figure 12: Global Market Value (US$ Million) Analysis by Application, 2018 to 2033

Figure 13: Global Market Volume (Units) Analysis by Application, 2018 to 2033

Figure 14: Global Market Value Share (%) and BPS Analysis by Application, 2023 to 2033

Figure 15: Global Market Y-o-Y Growth (%) Projections by Application, 2023 to 2033

Figure 16: Global Market Attractiveness by Product, 2023 to 2033

Figure 17: Global Market Attractiveness by Application, 2023 to 2033

Figure 18: Global Market Attractiveness by Region, 2023 to 2033

Figure 19: North America Market Value (US$ Million) by Product, 2023 to 2033

Figure 20: North America Market Value (US$ Million) by Application, 2023 to 2033

Figure 21: North America Market Value (US$ Million) by Country, 2023 to 2033

Figure 22: North America Market Value (US$ Million) Analysis by Country, 2018 to 2033

Figure 23: North America Market Volume (Units) Analysis by Country, 2018 to 2033

Figure 24: North America Market Value Share (%) and BPS Analysis by Country,2023 to 2033

Figure 25: North America Market Y-o-Y Growth (%) Projections by Country, 2023 to 2033

Figure 26: North America Market Value (US$ Million) Analysis by Product, 2018 to 2033

Figure 27: North America Market Volume (Units) Analysis by Product, 2018 to 2033

Figure 28: North America Market Value Share (%) and BPS Analysis by Product,2023 to 2033

Figure 29: North America Market Y-o-Y Growth (%) Projections by Product, 2023 to 2033

Figure 30: North America Market Value (US$ Million) Analysis by Application, 2018 to 2033

Figure 31: North America Market Volume (Units) Analysis by Application, 2018 to 2033

Figure 32: North America Market Value Share (%) and BPS Analysis by Application,2023 to 2033

Figure 33: North America Market Y-o-Y Growth (%) Projections by Application,2023 to 2033

Figure 34: North America Market Attractiveness by Product, 2023 to 2033

Figure 35: North America Market Attractiveness by Application, 2023 to 2033

Figure 36: North America Market Attractiveness by Country, 2023 to 2033

Figure 37: Latin America Market Value (US$ Million) by Product, 2023 to 2033

Figure 38: Latin America Market Value (US$ Million) by Application, 2023 to 2033

Figure 39: Latin America Market Value (US$ Million) by Country, 2023 to 2033

Figure 40: Latin America Market Value (US$ Million) Analysis by Country, 2018 to 2033

Figure 41: Latin America Market Volume (Units) Analysis by Country, 2018 to 2033

Figure 42: Latin America Market Value Share (%) and BPS Analysis by Country,2023 to 2033

Figure 43: Latin America Market Y-o-Y Growth (%) Projections by Country, 2023 to 2033

Figure 44: Latin America Market Value (US$ Million) Analysis by Product, 2018 to 2033

Figure 45: Latin America Market Volume (Units) Analysis by Product, 2018 to 2033

Figure 46: Latin America Market Value Share (%) and BPS Analysis by Product,2023 to 2033

Figure 47: Latin America Market Y-o-Y Growth (%) Projections by Product, 2023 to 2033

Figure 48: Latin America Market Value (US$ Million) Analysis by Application, 2018 to 2033

Figure 49: Latin America Market Volume (Units) Analysis by Application, 2018 to 2033

Figure 50: Latin America Market Value Share (%) and BPS Analysis by Application,2023 to 2033

Figure 51: Latin America Market Y-o-Y Growth (%) Projections by Application,2023 to 2033

Figure 52: Latin America Market Attractiveness by Product, 2023 to 2033

Figure 53: Latin America Market Attractiveness by Application, 2023 to 2033

Figure 54: Latin America Market Attractiveness by Country, 2023 to 2033

Figure 55: Europe Market Value (US$ Million) by Product, 2023 to 2033

Figure 56: Europe Market Value (US$ Million) by Application, 2023 to 2033

Figure 57: Europe Market Value (US$ Million) by Country, 2023 to 2033

Figure 58: Europe Market Value (US$ Million) Analysis by Country, 2018 to 2033

Figure 59: Europe Market Volume (Units) Analysis by Country, 2018 to 2033

Figure 60: Europe Market Value Share (%) and BPS Analysis by Country, 2023 to 2033

Figure 61: Europe Market Y-o-Y Growth (%) Projections by Country, 2023 to 2033

Figure 62: Europe Market Value (US$ Million) Analysis by Product, 2018 to 2033

Figure 63: Europe Market Volume (Units) Analysis by Product, 2018 to 2033

Figure 64: Europe Market Value Share (%) and BPS Analysis by Product, 2023 to 2033

Figure 65: Europe Market Y-o-Y Growth (%) Projections by Product, 2023 to 2033

Figure 66: Europe Market Value (US$ Million) Analysis by Application, 2018 to 2033

Figure 67: Europe Market Volume (Units) Analysis by Application, 2018 to 2033

Figure 68: Europe Market Value Share (%) and BPS Analysis by Application, 2023 to 2033

Figure 69: Europe Market Y-o-Y Growth (%) Projections by Application, 2023 to 2033

Figure 70: Europe Market Attractiveness by Product, 2023 to 2033

Figure 71: Europe Market Attractiveness by Application, 2023 to 2033

Figure 72: Europe Market Attractiveness by Country, 2023 to 2033

Figure 73: Asia Pacific Market Value (US$ Million) by Product, 2023 to 2033

Figure 74: Asia Pacific Market Value (US$ Million) by Application, 2023 to 2033

Figure 75: Asia Pacific Market Value (US$ Million) by Country, 2023 to 2033

Figure 76: Asia Pacific Market Value (US$ Million) Analysis by Country, 2018 to 2033

Figure 77: Asia Pacific Market Volume (Units) Analysis by Country, 2018 to 2033

Figure 78: Asia Pacific Market Value Share (%) and BPS Analysis by Country, 2023 to 2033

Figure 79: Asia Pacific Market Y-o-Y Growth (%) Projections by Country, 2023 to 2033

Figure 80: Asia Pacific Market Value (US$ Million) Analysis by Product, 2018 to 2033

Figure 81: Asia Pacific Market Volume (Units) Analysis by Product, 2018 to 2033

Figure 82: Asia Pacific Market Value Share (%) and BPS Analysis by Product, 2023 to 2033

Figure 83: Asia Pacific Market Y-o-Y Growth (%) Projections by Product, 2023 to 2033

Figure 84: Asia Pacific Market Value (US$ Million) Analysis by Application, 2018 to 2033

Figure 85: Asia Pacific Market Volume (Units) Analysis by Application, 2018 to 2033

Figure 86: Asia Pacific Market Value Share (%) and BPS Analysis by Application,2023 to 2033

Figure 87: Asia Pacific Market Y-o-Y Growth (%) Projections by Application, 2023 to 2033

Figure 88: Asia Pacific Market Attractiveness by Product, 2023 to 2033

Figure 89: Asia Pacific Market Attractiveness by Application, 2023 to 2033

Figure 90: Asia Pacific Market Attractiveness by Country, 2023 to 2033

Figure 91: Middle East & Africa Market Value (US$ Million) by Product, 2023 to 2033

Figure 92: Middle East & Africa Market Value (US$ Million) by Application, 2023 to 2033

Figure 93: Middle East & Africa Market Value (US$ Million) by Country, 2023 to 2033

Figure 94: Middle East & Africa Market Value (US$ Million) Analysis by Country, 2018 to 2033

Figure 95: Middle East & Africa Market Volume (Units) Analysis by Country, 2018 to 2033

Figure 96: Middle East & Africa Market Value Share (%) and BPS Analysis by Country, 2023 to 2033

Figure 97: Middle East & Africa Market Y-o-Y Growth (%) Projections by Country, 2023 to 2033

Figure 98: Middle East & Africa Market Value (US$ Million) Analysis by Product, 2018 to 2033

Figure 99: Middle East & Africa Market Volume (Units) Analysis by Product, 2018 to 2033

Figure 100: Middle East & Africa Market Value Share (%) and BPS Analysis by Product, 2023 to 2033

Figure 101: Middle East & Africa Market Y-o-Y Growth (%) Projections by Product, 2023 to 2033

Figure 102: Middle East & Africa Market Value (US$ Million) Analysis by Application, 2018 to 2033

Figure 103: Middle East & Africa Market Volume (Units) Analysis by Application, 2018 to 2033

Figure 104: Middle East & Africa Market Value Share (%) and BPS Analysis by Application, 2023 to 2033

Figure 105: Middle East & Africa Market Y-o-Y Growth (%) Projections by Application, 2023 to 2033

Figure 106: Middle East & Africa Market Attractiveness by Product, 2023 to 2033

Figure 107: Middle East & Africa Market Attractiveness by Application, 2023 to 2033

Figure 108: Middle East & Africa Market Attractiveness by Country, 2023 to 2033

Frequently Asked Questions

How Big is the Microcontroller Unit Market?

The market is valued at USD 28.2 billion in 2023.

Who are the Key Microcontroller Unit Market Players?

Fujitsu Semiconductor Limited, Zilog Inc., and Infineon Technologies AG are the key market players.

What is the Growth Forecast for the Microcontroller Unit Market?

The market is forecast to register a CAGR of 8.6% through 2033.

What is the United States Expected Market Share in 2033?

The United States is forecast to register a CAGR of 7.5% through 2033.

What is the Projected Size of the Market by 2033?

The global market size is projected to reach USD 70.6 billion by 2033.

Explore Similar Insights

Future Market Insights

Microcontroller Unit Market