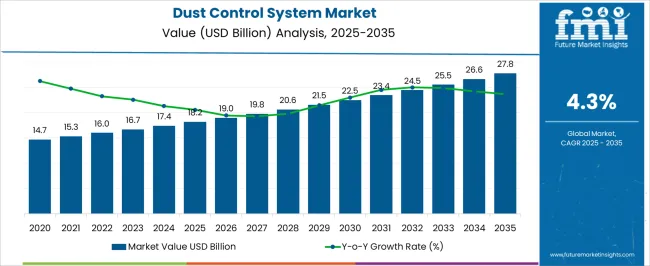
The Dust Control System market is witnessing steady growth, driven by increasing concerns over environmental pollution, occupational health, and safety standards in industrial and mining operations. Rising regulatory requirements for air quality and dust emissions are creating strong demand for effective dust suppression solutions. The market is supported by technological advancements in dust control systems, including automated monitoring, wet suppression, and misting technologies, which enhance operational efficiency while minimizing environmental impact.
Growing adoption of dust control measures in mining, metallurgy, construction, and manufacturing sectors is further fueling market expansion. Organizations are increasingly integrating these systems with environmental management and industrial automation platforms to ensure compliance and optimize operational processes.
Emphasis on sustainable operations and worker safety is prompting companies to invest in advanced dust control technologies As industrial activity intensifies in emerging and developed regions, the Dust Control System market is expected to experience sustained growth, with solutions that combine efficiency, regulatory compliance, and cost-effectiveness driving adoption and long-term market expansion.
| Metric | Value |
|---|---|
| Dust Control System Market Estimated Value in (2025 E) | USD 18.2 billion |
| Dust Control System Market Forecast Value in (2035 F) | USD 27.8 billion |
| Forecast CAGR (2025 to 2035) | 4.3% |
The market is segmented by Product and End User and region. By Product, the market is divided into Wet Suppression and Dry Collection. In terms of End User, the market is classified into Mining And Metallurgy, Energy, Food And Beverages, Chemicals, Pharmaceuticals, Oil And Gas, and Construction. Regionally, the market is classified into North America, Latin America, Western Europe, Eastern Europe, Balkan & Baltic Countries, Russia & Belarus, Central Asia, East Asia, South Asia & Pacific, and the Middle East & Africa.
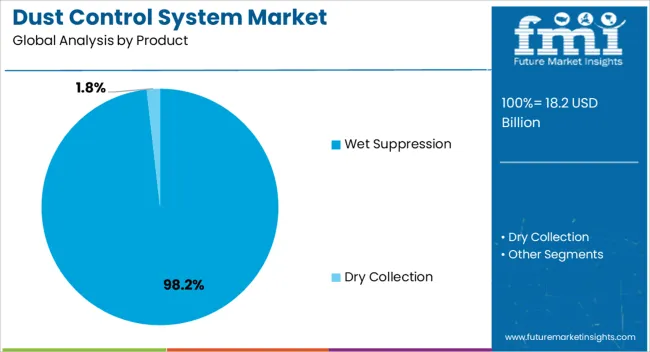
The wet suppression segment is projected to hold 98.2% of the market revenue in 2025, establishing it as the leading product type. Its dominance is driven by the ability to efficiently suppress dust in high-volume industrial operations, particularly in mining, metallurgy, and construction. Wet suppression systems use water sprays or mist to capture dust particles, significantly reducing airborne particulate matter and minimizing occupational hazards.
This method provides cost-effective and scalable solutions, which can be adapted to various operational environments. Integration with automated control systems enhances monitoring, performance, and resource management, further strengthening adoption. The efficiency in compliance with environmental regulations and reduction of dust-related downtime has reinforced preference for wet suppression.
Continuous improvements in nozzle design, water recycling, and control technology have optimized effectiveness while reducing operational costs With increasing environmental awareness, regulatory enforcement, and operational safety demands, wet suppression systems are expected to maintain their leading market position, supported by widespread industrial application and proven performance in high-dust environments.
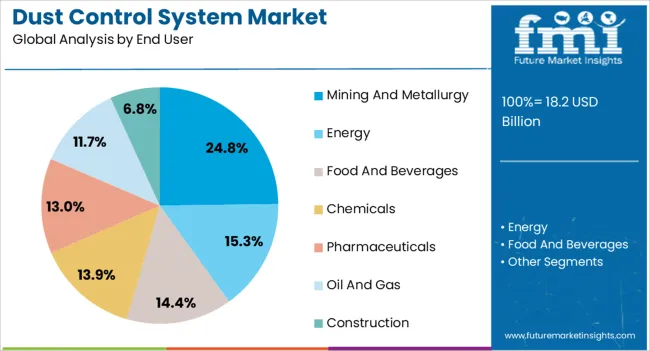
The mining and metallurgy segment is expected to account for 24.8% of the market revenue in 2025, making it the leading end-use industry. Growth in this segment is being driven by the significant dust generation associated with mining operations, ore handling, and metal processing activities. Effective dust control is critical to maintaining occupational health, ensuring regulatory compliance, and minimizing environmental impact in these industries.
The adoption of dust suppression systems, particularly wet suppression, provides operational efficiency by reducing airborne particulate matter and mitigating equipment wear. Integration of automated monitoring and control technologies allows real-time performance tracking and resource optimization. Increasing emphasis on sustainable mining practices, worker safety, and air quality standards has further accelerated adoption.
The ability to implement scalable solutions across open-pit mines, underground operations, and metallurgical facilities has reinforced the market position of dust control systems in this sector As mining and metallurgy operations expand globally, reliance on efficient and compliant dust control technologies is expected to drive continued growth and strengthen the segment’s leading revenue share.
| Historical CAGR (2020 to 2025) | 2.71% |
|---|---|
| Forecast CAGR (2025 to 2035) | 4.34% |
The dust control system market is in the middle of a drastic transformation. Even though the historical CAGR from 2020 to 2025 was accelerating at the rate of 2.71%. The prospect from 2025 to 2035 demonstrates a remarkable leap to the CAGR of 4.34%.
The increased pace can be chiefly credited to the changing of the direction of emphasis from reactive compliance to proactive risk management.
In the past, the role of regulations was the primary one in the process of dust control system adoption. At present, the role of clean air is being judged not just for its short-term benefits but also its long-term ones as the business environment becomes more conscious.
The use of dust control systems, as such, not only guarantees adherence to stricter air quality provisions but also results in a healthier workforce with reduced absenteeism and healthcare costs.
In addition, reducing the airborne dust particles ensures that the equipment and products run their full life cycle and don’t require premature replacement, leading to cost savings and better efficiency.
Niche Solutions for Specific Industries
The traditional approach of a one-for-all solution to dust control is becoming a thing of the past. One significant tendency is the design of dust control systems, especially for particular industries.
Besides the dust challenges in pharmaceutical cleanrooms and heavy-duty mining operations, companies are looking for specialized solutions customized to their needs and specific environments.
Biomimicry in Filtration, Nature Inspires Creativity
Nature is a treasure trove of incredible solutions to complex issues. The dust control industry is now going towards biomimicry for solutions.
manufacturers are experimenting in search of the materials and structures found in nature, like spider silk or plant cell walls, to develop next-gen filtration technologies with improved dust capture capability.
Focus on Nano Dust
Dust is not only a visible particle, but it can also be a microparticle. The increasing recognition of nanoparticle health risks lead to the development of filtration technology.
New filter materials and models are under development to capture these minute particles, thus providing cleaner air and a healthier working environment.
Dust Control as a Service, A Subscription Model for Clean Air
The idea of XaaS (Everything as a Service) is getting a grip on the dust control market. Companies may be able to subscribe to the dust control solutions with a monthly fee that covers equipment, installation, maintenance, and filter replacements.
This model makes sure that cost predictability is there and simplifies dust control management for businesses.
| Segment | Estimated Market Share in 2025 |
|---|---|
| Wet Filter | 98.2% |
| Mining | 24.80% |
Wet filtration systems still dominate the market, holding a 98.2% share in 2025. These systems use either water or a liquid solution to trap particles of dust, which makes them perfect for tasks that involve hazardous or fine dust.
Companies tend to adopt these due to the fact that they are more flexible as opposed to the dry filtration systems, making them stand out since they can deal with a wider spectrum of dust types.
The entailing need for processing hazardous and fine dust particles in multiple industries, which drives environmental regulations, is expected to boost the market share of the wet filtration segment.
Wet filtration systems, with their superior dust emission control, are a great option for companies wishing to meet the newly introduced stricter environmental standards.
The mining industry is unquestionably the top industry with the largest share of dust control system applications, about 24.8% in 2025. This dominance is rather logical due to the mining activities' dusty nature.
The dust control systems are a crucial element of safety and regulatory compliance in the mining sector.
With mining operations extending worldwide, the need for proper dust control solutions in this industry is expected to continue to increase.
Stricter health and safety regulations with dust control measures in the mining surroundings, plus the increasing mining activities across the globe, which leads to more dust production, are considered drivers of the dust control equipment market.
The analysis reveals that there exists a possibility for manufacturers and service providers of dust control systems in key developing countries.
The prediction is that Germany and India can give dust control equipment manufacturers a nice chance for extensive development. On the other hand, the dynamics of a mature market are set to be adopted by the United States, China, and Japan, which are technologically advanced.
| Countries | CAGR till 2035 |
|---|---|
| United States | 4.60% |
| India | 5.40% |
| China | 4.50% |
| Japan | 2.20% |
| Germany | 5.20% |
India is going to be a rapidly rising economy in the dust control system market expansion, by reaching a CAGR of 5.40% until 2035. Yet, this spectacular rise can be credited as the manifestation of the convergence of several factors that have coalesced for the first time.
In addition, the country's dust emission rate is increasing rapidly due to urbanization and industrialization.
Therefore, the best solutions to dust control are needed urgently. On top of that, the growing awareness of health and safety standards for the employees of the business is pushing them to prioritize worker well-being by offering different dust control measures.
Besides these variables, India’s thriving young populace supports an increase in the available income. This, in turn, means that the further development of the food industry, which largely depends on the use of dust control systems within food processing, is inevitable.
Driven by such forces, the Indian market is a reserve for those dust control system manufacturers who aspire to be in a fast-paced environment.
Germany takes a special place there in the dust control systems market. With a CAGR of 5.20% projected from 2025 onwards, on the other side, Germany still demonstrates a mature market with well-established key players. The interpretation of this phenomenon to a constant and predictive climate for manufacturers.
Nonetheless, Germany is not fully complacent; rather, it keeps on improving.
The country takes innovation development as the key priority and tries to look for new solutions to prevent dust dispersion.
The companies that take the industry to new materials, safety features, and environmental benefits and can meet the consumer needs in various regions of Germany have a high chance of being at the top of this market.
The curved trajectory might not be as steep as some of the developing markets, but Germany builds up trust and creativity for the dust control system enterprises.
Due to its status as a manufacturing hub, China provides a tempting chance for dust control system manufacturers. An estimated CAGR of 4.50% until 2035 signals a significant growth potential in the market. This is, however, a result of the growing industrial sector of China, which by its nature causes massive pollution.
With the environmental regulations getting tougher coupled with the safety of workers becoming paramount, there has been a corresponding increase in the need for efficient dust control systems.
Due to the rising number of China's middle class has pushed the demand for packaged goods, canned food, and other processed foods, which is similar to the trend in India.
Therefore, food processing industries need to step up the use of more efficient dust control systems. China's pace of development cannot be compared to that of India, but its enormous market size and ongoing industrial development have made it a sleeping giant that is so full of promise for the manufacturers of dust control systems.
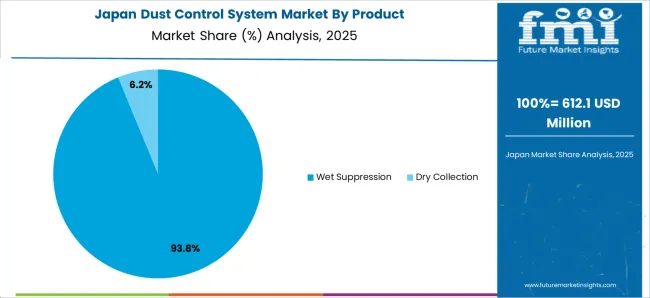
Japan, a developed country in the dust control system market, forecasts to grow at a CAGR of 2.20% throughout 2035. Although it is small compared to other emerging countries, such growth indicates another kind of possibility. Japan has a very sophisticated and advanced dust control system market.
Here, producers compete on the technical edge, offering dust control solutions with automated features, real-time monitoring, and upgraded filtering.
Companies that can reflect on being leaders in technology or energy efficiency or having solutions tailored for particular industries of Japan are the ones that are more likely to succeed.
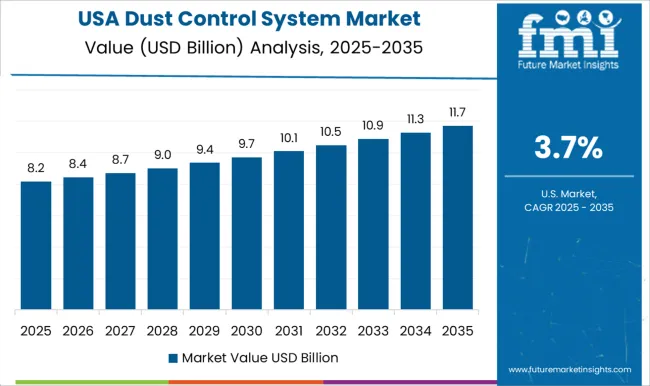
The United States, as a global leader in different sectors likely to maintain its position in the dust control system market with a projected CAGR of 4.60% until 2035. This expansion is the result of a range of conditions. The regulations on air quality and worker safety are already in place, which triggers the ongoing demand for dust control solutions.
Also, the increased automation in manufacturing requires dust control systems to be put in place in order to safeguard robots and other automated equipment from dust damage. In addition, the country has a multifaceted industrial structure that includes such industries as manufacturing and construction, pharmaceuticals, and food processing.
This type requires a multitude of dust control solutions, creating a chance for companies that produce a multiple range of products. Although not the fastest expanding market, the United States features a mature and stable environment with a great demand for tested and efficient dust control systems.
The dust control system industry is a highly competitive sector. Long-established industry players are still dominating the market with their accumulated experience and developed distribution channels.
These corporations for example - Donaldson Company and Nederman Holding provide all-in-one dust control equipment for many different industries. Their brand awareness and proven records mean they can provide their customers with consistent delivery of high-quality dust control systems.
Nevertheless, this prevailing system is increasingly being challenged by a new crop of rivals. Agile and innovative companies are invading the market with their niche applications and bleeding-edge technologies. They are the disruptors. These startups like Dust Control Technologies, are challenging the norm with "smart" dust control systems.
These systems are equipped with cutting-edge technologies such as real-time monitoring, automation and advanced filtration among others. Picture a unit that not only captures dust but also analyzes its composition and adjusts filtration settings automatically, maximizing efficiency and worker safety.
This emphasis on innovation has to be embraced by the already existing companies or they will end up losing their market share.
Recent Developments in the Dust Control System Industry:
The global dust control system market is estimated to be valued at USD 18.2 billion in 2025.
The market size for the dust control system market is projected to reach USD 27.8 billion by 2035.
The dust control system market is expected to grow at a 4.3% CAGR between 2025 and 2035.
The key product types in dust control system market are wet suppression and dry collection.
In terms of end user, mining and metallurgy segment to command 24.8% share in the dust control system market in 2025.


Full Research Suite comprises of:
Market outlook & trends analysis
Interviews & case studies
Strategic recommendations
Vendor profiles & capabilities analysis
5-year forecasts
8 regions and 60+ country-level data splits
Market segment data splits
12 months of continuous data updates
DELIVERED AS:
PDF EXCEL ONLINE
Dust Suppressant Market Size and Share Forecast Outlook 2025 to 2035
Dust Extractor Market Growth – Trends & Forecast 2025 to 2035
Dust Covers Market
Industrial Electronics Packaging Market Forecast and Outlook 2025 to 2035
Industrial Absorbent Market Forecast and Outlook 2025 to 2035
Industrial Furnace Industry Analysis in Europe Forecast and Outlook 2025 to 2035
Industrial Electronic Pressure Switch Market Size and Share Forecast Outlook 2025 to 2035
Industrial WiFi Module Market Size and Share Forecast Outlook 2025 to 2035
Industrial Film Market Forecast Outlook 2025 to 2035
Industrial Floor Mat Market Forecast Outlook 2025 to 2035
Industrial Insulation Market Forecast and Outlook 2025 to 2035
Industrial Process Water Coolers Market Forecast and Outlook 2025 to 2035
Industrial Grade Ammonium Hydrogen Fluoride Market Forecast and Outlook 2025 to 2035
Industrial Grade Sodium Bifluoride Market Forecast and Outlook 2025 to 2035
Industrial Evaporative Condenser Market Size and Share Forecast Outlook 2025 to 2035
Industrial Power Supply Market Size and Share Forecast Outlook 2025 to 2035
Industrial Crystallizer Market Size and Share Forecast Outlook 2025 to 2035
Industrial Counterweight Market Size and Share Forecast Outlook 2025 to 2035
Industry Analysis of Syringe and Needle in GCC Size and Share Forecast Outlook 2025 to 2035
Industrial Gas Market Size and Share Forecast Outlook 2025 to 2035

Thank you!
You will receive an email from our Business Development Manager. Please be sure to check your SPAM/JUNK folder too.
Chat With
MaRIA