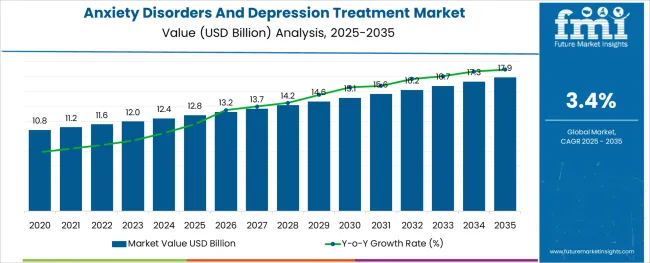
The Anxiety Disorders And Depression Treatment Market is estimated to be valued at USD 12.8 billion in 2025 and is projected to reach USD 17.9 billion by 2035, registering a compound annual growth rate (CAGR) of 3.4% over the forecast period.
The alginic acid market is undergoing consistent growth, propelled by rising demand from food processing, pharmaceutical formulations, and cosmetic applications. A growing focus on natural and sustainable ingredients in manufacturing processes has positioned alginic acid as a preferred biopolymer across industries.
The market is further supported by its diverse functional benefits, including water retention, gelling, and stabilizing properties, which make it indispensable in high-performance formulations. Increased regulatory acceptance of alginates as safe additives and the push towards cleaner labeling in food and personal care products have reinforced their adoption.
Ongoing innovation in extraction technologies and the utilization of algae as a renewable resource are paving the way for cost-effective production and expanded applications, ensuring sustained market expansion in the coming years.
The market is segmented by Drug Class, Indication, and Distribution Channel and region. By Drug Class, the market is divided into Antidepressants, Anxiolytics, Anticonvulsants, Noradrenergic Agents, and Atypical Antipsychotics. In terms of Indication, the market is classified into Anxiety and Depression. Based on Distribution Channel, the market is segmented into Hospital Pharmacy, Retail Pharmacy, and Online Pharmacy. Regionally, the market is classified into North America, Latin America, Western Europe, Eastern Europe, Balkan & Baltic Countries, Russia & Belarus, Central Asia, East Asia, South Asia & Pacific, and the Middle East & Africa.
When segmented by salts, sodium alginate is expected to command 27.5 % of the market revenue in 2025, marking it as the leading subsegment in this category. This leadership has been driven by its superior solubility, ease of incorporation into formulations, and versatility in a wide range of applications.
Its ability to form stable gels and maintain viscosity under varying conditions has made it highly sought after in both food and pharmaceutical sectors. Manufacturers have prioritized sodium alginate due to its consistent performance, cost-effectiveness, and regulatory acceptance, which have collectively strengthened its position.
The segment’s prominence has also been enhanced by its adaptability to evolving consumer preferences for plant-derived and sustainable ingredients, reinforcing its market share.
Segmented by end user industry, the food industry is projected to hold 33.0 % of the market revenue in 2025, positioning it as the most prominent sector. This dominance has been shaped by the industry’s increasing reliance on alginic acid and its derivatives to deliver desirable textures, stabilize emulsions, and improve shelf life of processed foods.
As consumer demand for clean label and natural additives has intensified, the food sector has responded by integrating alginates into bakery, dairy, and confectionery products. Enhanced production efficiency and compliance with food safety standards have further encouraged widespread use.
The segment’s leadership has also been supported by product differentiation strategies where alginates contribute to premium quality and innovation, securing their role in modern food formulations.
The global market for Anxiety Disorders and Depression Treatment Market expanded at a CAGR of 2.7% from 2020 to 2024. Around 12.4 million people worldwide suffer from anxiety, yet only 36% of them seek therapy, according to MindMed research.
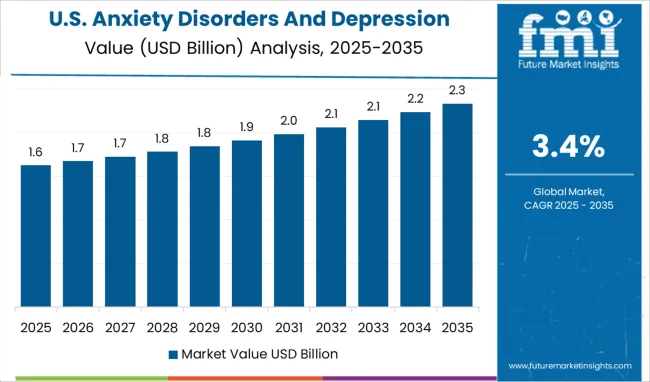
Sales of anxiety and depression-related disease products and clinical trials are increasing in the global market because of the demand for appropriate management of these disorders as well as strong outreach activities. The United States will continue to be the largest user of anxiety disorder and depression treatment products throughout the analysis period accounting for over USD 1.5 billion absolute dollar opportunity in the coming 10-year period.
Strong support for Research and Development (R&D) funding from the government and international healthcare organizations has spurred the revenue growth of the anxiety disorders and depression treatment market. Around 76 thousand grants for mental health were active between 2020 and 2024 from 345 funders in 38 nations.
About 5% of all registered grants and 4% of the overall research spending, or USD 18.5 billion, were related to mental health. With 89%, high-income nations received the majority of investments while the United States provided 39% of all grants. These investments are probably expected to help the market for treating anxiety disorders and depression in several ways.
Globally, patient care for mental health diseases is being enhanced through research and development. There are now more candidates for the treatment of anxiety disorders and depression in the pipeline owing to innovative research that has resulted in combination therapies using novel or existing medication molecules. For instance, the USA FDA recently approved LY03005, an antidepressant medicine manufactured by Luye Pharma.
High drug dosages used to treat damaged neurological cells typically cause harm to healthy cells in the body. Many people experience a variety of negative effects as a result of these, including weight gain, impaired vision, nausea, dizziness, and others.
As a result, these side effects from anxiety and depression medications are having a detrimental impact on the demand for therapy, and the unavailability of resources available is another issue impeding market expansion. For instance, according to WHO research, between 44% and 70% of patients in industrialized countries do not obtain treatment, whereas in developing countries the difference is significantly greater and is close to 90%.
Due to the availability of numerous branded formulations impacting the market dynamics, North America accounts for the largest market share of anxiety disorders and depression treatment accounting for over 45%. As a result of the present pandemic, the demand for therapies for anxiety disorders and depression has increased.
For instance, according to Bloomberg, the prescription rate for the anti-anxiety medication Zoloft increased by 12% in March 2024. Lockdowns, financial hardships, and a lack of physical contact have been cited as the main causes of a significant rise in depression and anxiety cases in North America.
The United States will account for USD 17.9 billion of the global Anxiety Disorders and Depression Treatment Market by 2035. Anxiety Disorders and Depression Treatment Market growth in the USA from 2020 to 2024 was estimated at 2.3% CAGR.
Researchers from Boston University found that half of the adults polled in the USA in September 2024 showed some symptoms of depression, such as feelings of helplessness and failure. These alarming statistics promise a further higher market for anxiety disorders and depression treatment market in the country.
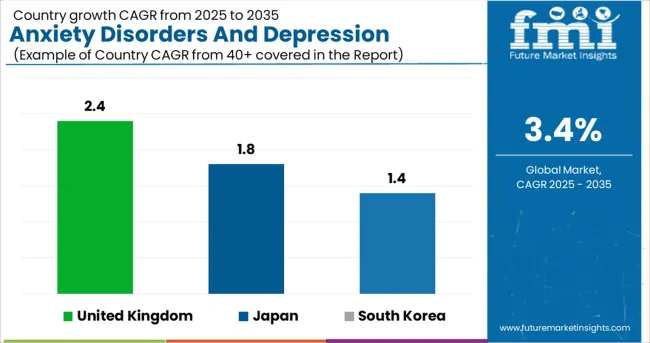
The anxiety Disorders and Depression market in the United Kingdom are expected to reach a valuation of USD 665.5 million by 2035. The market in the country is projected to gross an absolute dollar opportunity of USD 12.8 million from 2025 to 2035 and register a CAGR of 2.4%.
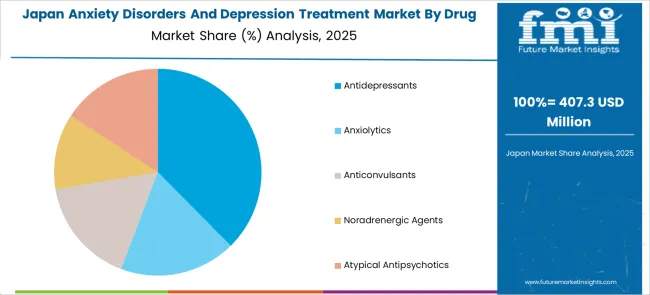
The market in Japan is expected to garner an absolute dollar opportunity of USD 151.8 million in 2025. The market in the country is expected to reach a valuation of USD 932.2 million by 2035, growing at a CAGR of 1.8% from 2025 to 2035.
The market in South Korea is expected to expand at a CAGR of 1.4% from 2025 to 2035. The market is expected to swell at an absolute dollar opportunity of USD 77.2 million from 2025 to 2035. By 2035, the market in the country is likely to reach a valuation of USD 566.8 million.
The market growth through the depression segment expanded at a CAGR of 2.4% from 2020 to 2024. According to WHO, depression affects an estimated 3.8% of the world's population, including 5% of adults and 5.7% of persons over the age of 60.
Suicide can result from depression at its worst. Every year, suicide claims the lives of more than 700 thousand people. For people aged 15 to 29, suicide is the fourth most common cause of death. More than 75.0% of people in low- and middle-income countries do not obtain treatment for mental problems despite the fact that there are well-established, efficient treatments.
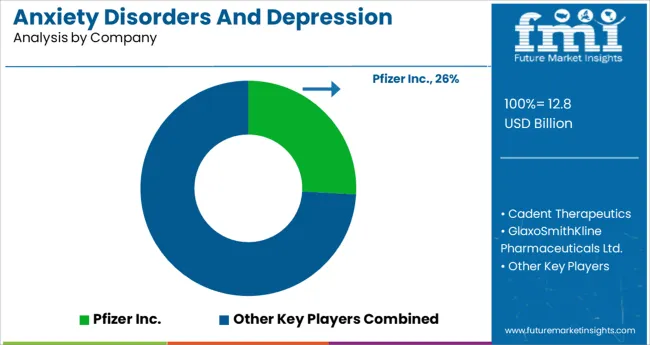
Companies that offer treatment for anxiety disorders and depression frequently form joint ventures, buy sister companies, and work to obtain the FDA to approve their treatments. There has also been a significant investment in R&D for some cutting-edge products.
The key companies operating in the Anxiety Disorders and Depression Treatment Market include Pfizer Inc, H. Lundbeck A/S, Glaxo SmithKline pharmaceuticals ltd, Merck & Co., Inc, Eli Lilly & Company, AstraZeneca, H. Lundbeck A/S, Bristol-Myers Squibb, Johnson & Johnson, AbbVie Inc., Sanofi, Novartis AG, Forest Laboratories, Inc., Alembic pharma, Janssen Pharmaceutical N.V., and Cadent Therapeutics.
Some of the recent developments by key providers of the Anxiety Disorders and Depression Treatment Market are as follows:
Similarly, recent developments related to companies providing services for Anxiety Disorders and Depression Treatment have been tracked by the team at Future Market Insights, which is available in the full report.
The global anxiety disorders and depression treatment market is estimated to be valued at USD 12.8 billion in 2025.
It is projected to reach USD 17.9 billion by 2035.
The market is expected to grow at a 3.4% CAGR between 2025 and 2035.
The key product types are antidepressants, anxiolytics, anticonvulsants, noradrenergic agents and atypical antipsychotics.
anxiety segment is expected to dominate with a 53.2% industry share in 2025.


Our Research Products

The "Full Research Suite" delivers actionable market intel, deep dives on markets or technologies, so clients act faster, cut risk, and unlock growth.

The Leaderboard benchmarks and ranks top vendors, classifying them as Established Leaders, Leading Challengers, or Disruptors & Challengers.

Locates where complements amplify value and substitutes erode it, forecasting net impact by horizon

We deliver granular, decision-grade intel: market sizing, 5-year forecasts, pricing, adoption, usage, revenue, and operational KPIs—plus competitor tracking, regulation, and value chains—across 60 countries broadly.

Spot the shifts before they hit your P&L. We track inflection points, adoption curves, pricing moves, and ecosystem plays to show where demand is heading, why it is changing, and what to do next across high-growth markets and disruptive tech

Real-time reads of user behavior. We track shifting priorities, perceptions of today’s and next-gen services, and provider experience, then pace how fast tech moves from trial to adoption, blending buyer, consumer, and channel inputs with social signals (#WhySwitch, #UX).

Partner with our analyst team to build a custom report designed around your business priorities. From analysing market trends to assessing competitors or crafting bespoke datasets, we tailor insights to your needs.
Supplier Intelligence
Discovery & Profiling
Capacity & Footprint
Performance & Risk
Compliance & Governance
Commercial Readiness
Who Supplies Whom
Scorecards & Shortlists
Playbooks & Docs
Category Intelligence
Definition & Scope
Demand & Use Cases
Cost Drivers
Market Structure
Supply Chain Map
Trade & Policy
Operating Norms
Deliverables
Buyer Intelligence
Account Basics
Spend & Scope
Procurement Model
Vendor Requirements
Terms & Policies
Entry Strategy
Pain Points & Triggers
Outputs
Pricing Analysis
Benchmarks
Trends
Should-Cost
Indexation
Landed Cost
Commercial Terms
Deliverables
Brand Analysis
Positioning & Value Prop
Share & Presence
Customer Evidence
Go-to-Market
Digital & Reputation
Compliance & Trust
KPIs & Gaps
Outputs
Full Research Suite comprises of:
Market outlook & trends analysis
Interviews & case studies
Strategic recommendations
Vendor profiles & capabilities analysis
5-year forecasts
8 regions and 60+ country-level data splits
Market segment data splits
12 months of continuous data updates
DELIVERED AS:
PDF EXCEL ONLINE
Generalized Anxiety Disorder Treatment Market Insights by Drug Class, Therapies, Distribution Channel, and Region 2035
Coagulation Disorders Market
Sleep Movement Disorders Market Size and Share Forecast Outlook 2025 to 2035
Frontotemporal Disorders Treatment Market Size and Share Forecast Outlook 2025 to 2035
Amino Acid Metabolism Disorders Treatment Market Growth – Trends & Forecast 2024-2034
Circadian Rhythm Sleep Disorders Market Size and Share Forecast Outlook 2025 to 2035
Inherited Orphan Blood Disorders Therapeutics Market Size and Share Forecast Outlook 2025 to 2035
Lipoprotein Metabolism Disorders Treatment Market
Paediatric Neuropsychiatric Disorders Treatment Market
Nucleic Acid and Gene Therapies in Neuromuscular Disorders Market Size and Share Forecast Outlook 2025 to 2035
Treatment-Resistant Hypertension Management Market Size and Share Forecast Outlook 2025 to 2035
Treatment Pumps Market Insights Growth & Demand Forecast 2025 to 2035
Pretreatment Coatings Market Size and Share Forecast Outlook 2025 to 2035
Air Treatment Ozone Generator Market Size and Share Forecast Outlook 2025 to 2035
Seed Treatment Materials Market Size and Share Forecast Outlook 2025 to 2035
Acne Treatment Solutions Market Size and Share Forecast Outlook 2025 to 2035
Scar Treatment Market Overview - Growth & Demand Forecast 2025 to 2035
Soil Treatment Chemicals Market
Water Treatment System Market Size and Share Forecast Outlook 2025 to 2035
Water Treatment Chemical Market Size and Share Forecast Outlook 2025 to 2035

Thank you!
You will receive an email from our Business Development Manager. Please be sure to check your SPAM/JUNK folder too.
Chat With
MaRIA