Bulk Container Packaging Market Size and Share Forecast Outlook 2025 to 2035

The bulk container packaging market is projected to grow from USD 21.8 billion in 2025 to USD 31.6 billion by 2035, registering a CAGR of 3.8% during the forecast period. Sales in 2024 reached USD 21.0 billion. Growth has been influenced by rising logistics efficiency demands in food, chemicals, and pharmaceutical exports.
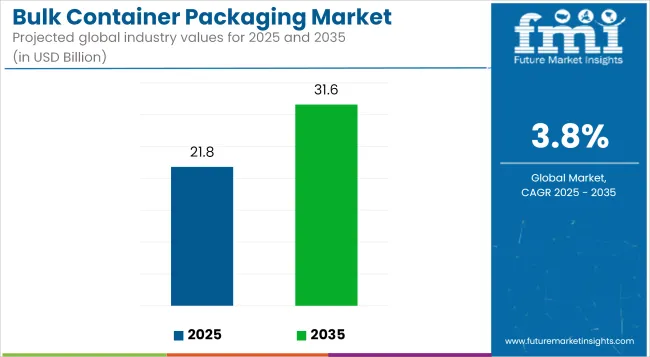
Quick Stats of Bulk Container Packaging Market

  • Market Value (2025): USD 21.8 billion
  • Forecast Value (2035): USD 31.6 billion
  • Forecast CAGR: 3.8%
  • Material Leader in 2025: Plastic (62.8% market share)
  • Top End Use: Industrial chemicals (38.5% share)
  • Key Growth Country: USA (USA is the fastest-growing market with 6.1% CAGR)

Bulk Container Packaging Market Industry Value Analysis

Metric Value
Market Size in 2025 USD 21.8 Billion
Projected Market Size in 2035 USD 31.6 Billion
CAGR (2025 to 2035) 3.8%

The demand for intermediate bulk containers (IBCs) and flexi tanks has risen across North America and Asia-Pacific due to expanded trade in liquid and granular commodities. Additionally, sustainability requirements have driven a transition toward recyclable container liners and bulk-ready refill systems.

In 2023, Mauser Packaging Solutions Opened New Reconditioning Site in Poland and Expands Infinity Series Capabilities. These investments support the collection and supply of reconditioned Intermediate Bulk Containers (IBCs) and plastic drums in the region and further promote the circular economy through the expanded use of PCR.

“The investments in Gliwice, Poland, are another milestone for Mauser Packaging Solutions. We are proud to expand our reconditioning capabilities and Infinity Series production capacity in Europe. We strive to create a more sustainable future for our customers and with our new capabilities in Poland, we are taking a big step forward,” supplemented Marcin Krzysteczko, Sales Director Poland.

Sustainable packaging solutions in the bulk segment have gained attention with a shift to recyclable polymer liners and reusable structures. Innovations in collapsible bulk packaging and temperature-stable materials have been adopted to meet circularity mandates.

Technologies enabling reduced CO₂ emissions during transport and extended product shelf life in pharma and agrochemicals have been implemented. Companies have introduced solvent-resistant liners for industrial liquids and food-safe coatings to comply with safety standards. Active partnerships between packaging firms and chemical producers have been witnessed to scale eco-friendly container adoption.

The bulk container packaging market is poised to see diversified demand across chemicals, beverages, and industrial raw materials due to global supply chain diversification. Long-term opportunities will likely stem from biodegradable composite containers and smart tracking systems integrated into flexitanks and IBCs.

Regional demand will be reinforced by investments in e-commerce fulfillment infrastructure requiring scalable and space-efficient bulk options. Regulatory alignment regarding safe handling of hazardous and edible liquids will drive innovation in valve systems and material traceability. Competitive strategies will center on speed-to-market, enhanced automation, and intelligent container lifecycle analytics

Analyzing Bulk Container Packaging Market by Top Investment Segments

The market is segmented based on product, material, end use, and region. By product, the market includes flexi tanks, bulk containers comprising flexible and rigid bulk containers and bulk container liners. In terms of material, the market is categorized into plastic (HDPE, LDPE, LLDPE, PP, PVC), metals, and others such as wood, fiber, and paper board.

By end use, the market comprises industrial chemicals, petroleum and lubricants, food and beverages, paints, inks, and dyes, pharmaceutical, and others. Regionally, the market is analyzed across North America, Latin America, East Asia, South Asia & Pacific, Eastern Europe, Western Europe, Oceania, and the Middle East & Africa.
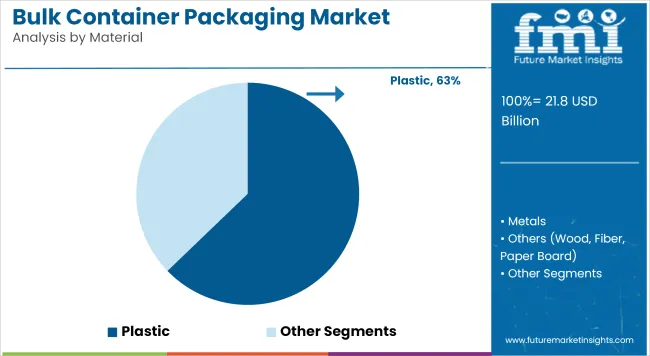
Plastic Preferred for Its Lightweight Durability and Chemical Compatibility

Bulk Container Packaging Market Analysis By Material

Plastic has been projected to account for 62.8% of the bulk container packaging market in 2025, due to its flexibility, strength, and resistance to corrosion. High-density polyethylene (HDPE) and polypropylene (PP) have been primarily used in drum and intermediate bulk container (IBC) formats. These materials have provided excellent performance against harsh chemicals and temperature variations. UV stabilization and food-grade compliance have further extended plastic’s utility across sectors.

Transport efficiency has been improved through the use of stackable and collapsible plastic containers. Returnable packaging systems have been designed using heavy-duty plastic frames and liners for reduced carbon footprints. Anti-static coatings and tamper-proof closures have been integrated for safe handling of volatile contents. Lightweight construction has led to savings in freight costs and easier manual handling.

Customization for branding, labeling, and regulatory compliance has been offered through molded-in design features and standardized dimensions. Enhanced reusability and recyclability have made plastic a sustainable alternative to metals in many industrial use cases. Cost-efficiency, especially in high-volume export operations, has reinforced its preference among manufacturers.

Automation-friendly handling with forklifts and pallet systems has also supported widespread plastic adoption. Global shipping standards such as UN/DOT approvals have been met more easily with molded plastic drums and IBCs.

Innovations in multilayer plastic structures have enabled barrier protection against oxygen, moisture, and UV light. With increasing demand for safe and cost-effective packaging, plastic containers are expected to remain dominant. Strategic focus is likely to remain on improving post-consumer recycling rates and circular supply chains.
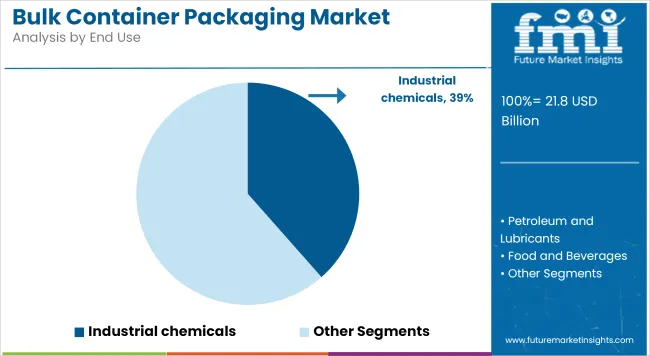
Industrial Chemicals Segment Leads with Specialized Safety and Regulatory Requirements

Bulk Container Packaging Market Analysis By End Use

The industrial chemicals segment has been estimated to capture 38.5% of the global bulk container packaging market in 2025, driven by stringent safety and regulatory protocols. Packaging used in this segment has needed to withstand reactive agents, high viscosity fluids, and extreme environmental conditions. Durable and inert materials such as HDPE, composite IBCs, and metal-reinforced bulk containers have been preferred.

Certifications such as ADR, IMDG, and UN markings have been routinely mandated. Leak-proof sealing, tamper resistance, and chemical compatibility have guided container design for corrosive liquids and industrial solvents.

Labels and documentation panels have been integrated to meet hazardous material handling guidelines. Demand from agrochemicals, cleaning solutions, and water treatment agents has continued to drive volume growth. Reusable and returnable systems have been increasingly used to reduce packaging waste and enhance safety.

Industrial automation and bulk dosing systems have been supported through the adoption of standardized container sizes and easy-flow outlets. Containers with top-load dispensing valves and bottom discharge mechanisms have enabled operational efficiencies. Custom liners, vented closures, and pressure relief valves have been engineered for materials requiring careful handling.

Transport through rail, sea, and road freight has favored robust and regulatory-compliant bulk packaging formats. As global chemical trade expands, especially across Asia and North America, the need for robust secondary containment solutions is expected to rise.

Industry consolidation and scale-driven supply chain requirements will continue to favor bulk container packaging. Compliance with REACH, GHS, and other international standards will shape product innovation. Safety, traceability, and transport optimization will remain key drivers for this leading segment.

Challenges and Opportunities in the Bulk Container Packaging Market

Challenges

Regulatory complexity and contamination risks Ensuring compliance with varying international safety and hygiene regulations is challenging. Additionally, cross-contamination risks, especially in food and chemical applications, demand stricter packaging standards.

Opportunities

Sustainability, automation, and material innovation The development of reusable, foldable, and lightweight bulk containers is opening new opportunities. Smart packaging with sensors and blockchain-enabled traceability is gaining momentum. Biodegradable and recyclable barrier films are creating avenues for sustainable packaging expansion.
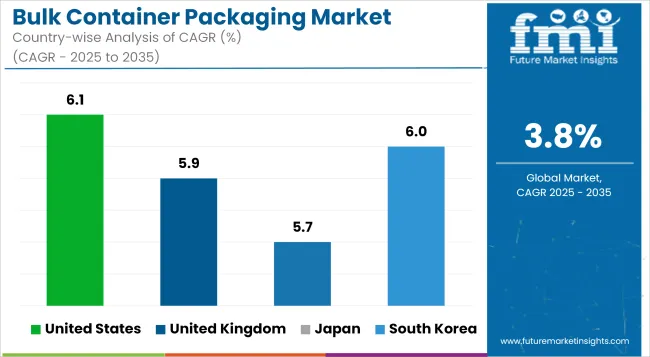
Country-wise Outlook - Bulk Container Packaging Market

Bulk Container Packaging Market Cagr Analysis By Country

United States

The United States leads the bulk container packaging market due to the high volume of exports in chemicals, agricultural products, and industrial goods. Manufacturers offer flexible intermediate bulk containers (FIBCs), rigid bulk boxes, and pallet containers that are optimized for automation and international logistics. USA companies are integrating IoT-enabled tags, RFID tracking, and tamper-evident closures to enhance traceability and supply chain security.

The demand for recyclable and collapsible bulk containers is growing across e-commerce and distribution hubs. AI-driven quality assurance systems are enhancing the reliability of container inspection processes. Companies are also adopting biodegradable liners and coatings to meet sustainability mandates. Additionally, automation in container handling is reducing labor costs and boosting operational throughput.

Country CAGR (2025 to 2035)
United States 6.1%

United Kingdom

The UK bulk container packaging market is expanding as industries adopt sustainable transport solutions and space-saving logistics systems. British manufacturers develop FIBCs and corrugated bulk boxes designed for high-stack stability and moisture resistance. Demand is increasing for custom-sized containers tailored to specific product types and transportation requirements.

Smart bulk packaging innovations, such as QR-coded labeling and GPS-enabled asset tracking, are supporting digital logistics transformations. Companies are investing in automation technologies to accelerate container assembly and reduce labor dependency. AI-powered condition monitoring is helping to track damage and wear across reusable container fleets. Furthermore, eco-design principles are guiding the development of fully recyclable, lightweight bulk containers tailored for export and warehouse use.

Country CAGR (2025 to 2035)
United Kingdom 5.9%

Japan

Japan’s bulk container packaging market continues to grow as automation and hygiene become central to industrial and food-grade packaging. Japanese manufacturers engineer lightweight, foldable containers with antimicrobial linings and high-load durability. The integration of automated filling systems and leak-proof technologies is improving operational efficiency and safety. Companies are focusing on modular container designs for streamlined inventory and export shipping.

Country CAGR (2025 to 2035)
Japan 5.7%

South Korea

South Korea’s market is advancing with the development of smart, eco-friendly bulk containers for electronics, cosmetics, and processed foods. Manufacturers deploy reusable packaging systems that reduce waste and transportation costs. Innovations include RFID-integrated stacking bins, automated collapsible containers, and bio-based polymer composites. Companies are also optimizing container geometry for improved warehouse space utilization.

Country CAGR (2025 to 2035)
South Korea 6.0%

Competitive Outlook

The bulk container packaging market is growing as logistics and sustainability become key to operational competitiveness. Packaging companies are launching standardized, modular, and automation-friendly bulk containers to optimize warehouse and shipping operations. Smart inventory systems are integrating with bulk containers to streamline supply chain visibility.

There's a rising trend in multi-trip containers designed for closed-loop logistics. Digital printing on bulk packaging is enhancing branding and tracking. Some firms are embedding QR codes and tamper-evident labels for traceability. Lightweight materials are being used to reduce freight costs while maintaining structural integrity. The industry is also exploring biodegradable bulk packaging options for environmental compliance. Innovations in collapsible containers are helping reduce storage space and transport emissions

Other Key Players

  • Flexcon Container
  • Bulk-Pack Inc
  • Sintex Industries
  • Conitex Sonoco
  • Arena Products

Key Segments

By Product:

  • Flexitanks
  • Bulk Containers
    • Flexible Bulk Containers
    • Rigid Bulk Containers
  • Bulk Container Liners

By Material:

  • Plastic
    • HDPE
    • LDPE
    • LLDPE
    • PP
    • PVC
    • Others
  • Metals
  • Others (Wood, Fiber, Paper Board)

By End Use:

  • Industrial Chemicals
  • Petroleum and Lubricants
  • Food and Beverages
  • Paints, Inks, and Dyes
  • Pharmaceutical
  • Others

By Region:

  • North America
  • Latin America
  • East Asia
  • South Asia & Pacific
  • Eastern Europe
  • Western Europe
  • Middle East & Africa

Table of Content

  1. Executive Summary
    • Global Market Outlook
    • Demand-side Trends
    • Supply-side Trends
    • Technology Roadmap Analysis
    • Analysis and Recommendations
  2. Market Overview
    • Market Coverage / Taxonomy
    • Market Definition / Scope / Limitations
  3. Market Background
    • Market Dynamics
      • Drivers
      • Restraints
      • Opportunity
      • Trends
    • Scenario Forecast
      • Demand in Optimistic Scenario
      • Demand in Likely Scenario
      • Demand in Conservative Scenario
    • Opportunity Map Analysis
    • Product Life Cycle Analysis
    • Supply Chain Analysis
      • Supply Side Participants and their Roles
        • Producers
        • Mid-Level Participants (Traders/ Agents/ Brokers)
        • Wholesalers and Distributors
      • Value Added and Value Created at Node in the Supply Chain
      • List of Raw Material Suppliers
      • List of Existing and Potential Buyer’s
    • Investment Feasibility Matrix
    • Value Chain Analysis
      • Profit Margin Analysis
      • Wholesalers and Distributors
      • Retailers
    • PESTLE and Porter’s Analysis
    • Regulatory Landscape
      • By Key Regions
      • By Key Countries
    • Regional Parent Market Outlook
    • Production and Consumption Statistics
    • Import and Export Statistics
  4. Global Market Analysis 2020-2024 and Forecast, 2025-2035
    • Historical Market Size Value (USD Million) & Volume (Units) Analysis, 2020-2024
    • Current and Future Market Size Value (USD Million) & Volume (Units) Projections, 2025-2035
      • Y-o-Y Growth Trend Analysis
      • Absolute $ Opportunity Analysis
  5. Global Market Analysis 2020-2024 and Forecast 2025-2035, By Product
    • Introduction / Key Findings
    • Historical Market Size Value (USD Million) & Volume (Units) Analysis By Product, 2020-2024
    • Current and Future Market Size Value (USD Million) & Volume (Units) Analysis and Forecast By Product, 2025-2035
      • Flexi tanks
      • Bulk Containers (Flexible Bulk Containers, Rigid Bulk Containers)
      • Bulk Container Liners
    • Y-o-Y Growth Trend Analysis By Product, 2020-2024
    • Absolute $ Opportunity Analysis By Product, 2025-2035
  6. Global Market Analysis 2020-2024 and Forecast 2025-2035, By Material Type
    • Introduction / Key Findings
    • Historical Market Size Value (USD Million) & Volume (Units) Analysis By Material Type, 2020-2024
    • Current and Future Market Size Value (USD Million) & Volume (Units) Analysis and Forecast By Material Type, 2025-2035
      • Plastic (HDPE, LDPE, LLDPE, PP, PVC)
      • Metals
      • Others (Wood, Fiber, Paper Board)
    • Y-o-Y Growth Trend Analysis By Material Type, 2020-2024
    • Absolute $ Opportunity Analysis By Material Type, 2025-2035
  7. Global Market Analysis 2020-2024 and Forecast 2025-2035, By End Use
    • Introduction / Key Findings
    • Historical Market Size Value (USD Million) & Volume (Units) Analysis By End Use, 2020-2024
    • Current and Future Market Size Value (USD Million) & Volume (Units) Analysis and Forecast By End Use, 2025-2035
      • Industrial Chemicals
      • Petroleum and Lubricants
      • Food and Beverages
      • Paints, Inks, and Dyes
      • Pharmaceutical
      • Others
    • Y-o-Y Growth Trend Analysis By End Use, 2020-2024
    • Absolute $ Opportunity Analysis By End Use, 2025-2035
  8. Global Market Analysis 2020-2024 and Forecast 2025-2035, By End-Use Channel
    • Introduction / Key Findings
    • Historical Market Size Value (USD Million) & Volume (Units) Analysis By End-Use Channel, 2020-2024
    • Current and Future Market Size Value (USD Million) & Volume (Units) Analysis and Forecast By End-Use Channel, 2025-2035
      • Residential
      • Foodservice
      • Offices & Workplaces
      • Travel & Hospitality
      • Institutional
    • Y-o-Y Growth Trend Analysis By End-Use Channel, 2020-2024
    • Absolute $ Opportunity Analysis By End-Use Channel, 2025-2035
  9. Global Market Analysis 2020-2024 and Forecast 2025-2035, By Region
    • Introduction
    • Historical Market Size Value (USD Million) & Volume (Units) Analysis By Region, 2020-2024
    • Current Market Size Value (USD Million) & Volume (Units) Analysis and Forecast By Region, 2025-2035
      • North America
      • Latin America
      • Europe
      • East Asia
      • South Asia
      • Oceania
      • MEA
    • Market Attractiveness Analysis By Region
  10. North America Market Analysis 2020-2024 and Forecast 2025-2035, By Country
    • Historical Market Size Value (USD Million) & Volume (Units) Trend Analysis By Market Taxonomy, 2020-2024
    • Market Size Value (USD Million) & Volume (Units) Forecast By Market Taxonomy, 2025-2035
      • By Country
        • USA
        • Canada
      • By Product
      • By Material Type
      • By End Use
      • By End-Use Channel
    • Market Attractiveness Analysis
      • By Country
      • By Product
      • By Material Type
      • By End Use
      • By End-Use Channel
    • Key Takeaways
  11. Latin America Market Analysis 2020-2024 and Forecast 2025-2035, By Country
    • Historical Market Size Value (USD Million) & Volume (Units) Trend Analysis By Market Taxonomy, 2020-2024
    • Market Size Value (USD Million) & Volume (Units) Forecast By Market Taxonomy, 2025-2035
      • By Country
        • Brazil
        • Mexico
        • Argentina
        • Chile
        • Peru
        • Rest of Latin America
      • By Product
      • By Material Type
      • By End Use
      • By End-Use Channel
    • Market Attractiveness Analysis
      • By Country
      • By Product
      • By Material Type
      • By End Use
      • By End-Use Channel
    • Key Takeaways
  12. Europe Market Analysis 2020-2024 and Forecast 2025-2035, By Country
    • Historical Market Size Value (USD Million) & Volume (Units) Trend Analysis By Market Taxonomy, 2020-2024
    • Market Size Value (USD Million) & Volume (Units) Forecast By Market Taxonomy, 2025-2035
      • By Country
        • Germany
        • Italy
        • France
        • UK
        • Spain
        • Russia
        • BENELUX
        • Rest of Europe
      • By Product
      • By Material Type
      • By End Use
      • By End-Use Channel
    • Market Attractiveness Analysis
      • By Country
      • By Product
      • By Material Type
      • By End Use
      • By End-Use Channel
    • Key Takeaways
  13. East Asia Market Analysis 2020-2024 and Forecast 2025-2035, By Country
    • Historical Market Size Value (USD Million) & Volume (Units) Trend Analysis By Market Taxonomy, 2020-2024
    • Market Size Value (USD Million) & Volume (Units) Forecast By Market Taxonomy, 2025-2035
      • By Country
        • China
        • Japan
        • South Korea
      • By Product
      • By Material Type
      • By End Use
      • By End-Use Channel
    • Market Attractiveness Analysis
      • By Country
      • By Product
      • By Material Type
      • By End Use
      • By End-Use Channel
    • Key Takeaways
  14. South Asia Market Analysis 2020-2024 and Forecast 2025-2035, By Country
    • Historical Market Size Value (USD Million) & Volume (Units) Trend Analysis By Market Taxonomy, 2020-2024
    • Market Size Value (USD Million) & Volume (Units) Forecast By Market Taxonomy, 2025-2035
      • By Country
        • India
        • Thailand
        • Malaysia
        • Indonesia
        • Rest of South Asia
      • By Product
      • By Material Type
      • By End Use
      • By End-Use Channel
    • Market Attractiveness Analysis
      • By Country
      • By Product
      • By Material Type
      • By End Use
      • By End-Use Channel
    • Key Takeaways
  15. Oceania Market Analysis 2020-2024 and Forecast 2025-2035, By Country
    • Historical Market Size Value (USD Million) & Volume (Units) Trend Analysis By Market Taxonomy, 2020-2024
    • Market Size Value (USD Million) & Volume (Units) Forecast By Market Taxonomy, 2025-2035
      • By Country
        • Australia
        • New Zealand
      • By Product
      • By Material Type
      • By End Use
      • By End-Use Channel
    • Market Attractiveness Analysis
      • By Country
      • By Product
      • By Material Type
      • By End Use
      • By End-Use Channel
    • Key Takeaways
  16. MEA Market Analysis 2020-2024 and Forecast 2025-2035, By Country
    • Historical Market Size Value (USD Million) & Volume (Units) Trend Analysis By Market Taxonomy, 2020-2024
    • Market Size Value (USD Million) & Volume (Units) Forecast By Market Taxonomy, 2025-2035
      • By Country
        • GCC
        • Rest of MEA
      • By Product
      • By Material Type
      • By End Use
      • By End-Use Channel
    • Market Attractiveness Analysis
      • By Country
      • By Product
      • By Material Type
      • By End Use
      • By End-Use Channel
    • Key Takeaways
  17. Key Countries Market Analysis
    • USA
      • Pricing Analysis
      • Market Share Analysis, 2024
        • By Product
        • By Material Type
        • By End Use
        • By End-Use Channel
    • Canada
      • Pricing Analysis
      • Market Share Analysis, 2024
        • By Product
        • By Material Type
        • By End Use
        • By End-Use Channel
    • Brazil
      • Pricing Analysis
      • Market Share Analysis, 2024
        • By Product
        • By Material Type
        • By End Use
        • By End-Use Channel
    • Mexico
      • Pricing Analysis
      • Market Share Analysis, 2024
        • By Product
        • By Material Type
        • By End Use
        • By End-Use Channel
    • Argentina
      • Pricing Analysis
      • Market Share Analysis, 2024
        • By Product
        • By Material Type
        • By End Use
        • By End-Use Channel
  18. Market Structure Analysis
    • Competition Dashboard
    • Competition Benchmarking
    • Market Share Analysis of Top Players
      • By Regional
      • By Product
      • By Material Type
      • By End Use
      • By End-Use Channel
  19. Competition Analysis
    • Competition Deep Dive
      • Greif, Inc.
        • Overview
        • Product Portfolio
        • Profitability by Market Segments (Product/Age /Sales Channel/Region)
        • Sales Footprint
        • Strategy Overview
          • Marketing Strategy
          • Product Strategy
          • Channel Strategy
      • Berry Global, Inc.
        • Overview
        • Product Portfolio
        • Profitability by Market Segments (Product/Age /Sales Channel/Region)
        • Sales Footprint
        • Strategy Overview
          • Marketing Strategy
          • Product Strategy
          • Channel Strategy
      • Sealed Air Corporation
        • Overview
        • Product Portfolio
        • Profitability by Market Segments (Product/Age /Sales Channel/Region)
        • Sales Footprint
        • Strategy Overview
          • Marketing Strategy
          • Product Strategy
          • Channel Strategy
      • DS Smith Plc
        • Overview
        • Product Portfolio
        • Profitability by Market Segments (Product/Age /Sales Channel/Region)
        • Sales Footprint
        • Strategy Overview
          • Marketing Strategy
          • Product Strategy
          • Channel Strategy
      • Mondi Group
        • Overview
        • Product Portfolio
        • Profitability by Market Segments (Product/Age /Sales Channel/Region)
        • Sales Footprint
        • Strategy Overview
          • Marketing Strategy
          • Product Strategy
          • Channel Strategy
      • Amcor Plc
        • Overview
        • Product Portfolio
        • Profitability by Market Segments (Product/Age /Sales Channel/Region)
        • Sales Footprint
        • Strategy Overview
          • Marketing Strategy
          • Product Strategy
          • Channel Strategy
      • International Paper Company
        • Overview
        • Product Portfolio
        • Profitability by Market Segments (Product/Age /Sales Channel/Region)
        • Sales Footprint
        • Strategy Overview
          • Marketing Strategy
          • Product Strategy
          • Channel Strategy
      • Winpak Ltd
        • Overview
        • Product Portfolio
        • Profitability by Market Segments (Product/Age /Sales Channel/Region)
        • Sales Footprint
        • Strategy Overview
          • Marketing Strategy
          • Product Strategy
          • Channel Strategy
      • Mauser Group B.V
        • Overview
        • Product Portfolio
        • Profitability by Market Segments (Product/Age /Sales Channel/Region)
        • Sales Footprint
        • Strategy Overview
          • Marketing Strategy
          • Product Strategy
          • Channel Strategy
      • Hoover Ferguson Group
        • Overview
        • Product Portfolio
        • Profitability by Market Segments (Product/Age /Sales Channel/Region)
        • Sales Footprint
        • Strategy Overview
          • Marketing Strategy
          • Product Strategy
          • Channel Strategy
  20. Assumptions & Acronyms Used
  21. Research Methodology

List of Tables

  • Table 1: Global Market Value (USD Million) Forecast by Region, 2020-2035
  • Table 2: Global Market Volume (Units) Forecast by Region, 2020-2035
  • Table 3: Global Market Value (USD Million) Forecast by Product, 2020-2035
  • Table 4: Global Market Volume (Units) Forecast by Product, 2020-2035
  • Table 5: Global Market Value (USD Million) Forecast by Material Type, 2020-2035
  • Table 6: Global Market Volume (Units) Forecast by Material Type, 2020-2035
  • Table 7: Global Market Value (USD Million) Forecast by End Use, 2020-2035
  • Table 8: Global Market Volume (Units) Forecast by End Use, 2020-2035
  • Table 9: Global Market Value (USD Million) Forecast by End-Use Channel, 2020-2035
  • Table 10: Global Market Volume (Units) Forecast by End-Use Channel, 2020-2035
  • Table 11: North America Market Value (USD Million) Forecast by Country, 2020-2035
  • Table 12: North America Market Volume (Units) Forecast by Country, 2020-2035
  • Table 13: North America Market Value (USD Million) Forecast by Product, 2020-2035
  • Table 14: North America Market Volume (Units) Forecast by Product, 2020-2035
  • Table 15: North America Market Value (USD Million) Forecast by Material Type, 2020-2035
  • Table 16: North America Market Volume (Units) Forecast by Material Type, 2020-2035
  • Table 17: North America Market Value (USD Million) Forecast by End Use, 2020-2035
  • Table 18: North America Market Volume (Units) Forecast by End Use, 2020-2035
  • Table 19: North America Market Value (USD Million) Forecast by End-Use Channel, 2020-2035
  • Table 20: North America Market Volume (Units) Forecast by End-Use Channel, 2020-2035
  • Table 21: Latin America Market Value (USD Million) Forecast by Country, 2020-2035
  • Table 22: Latin America Market Volume (Units) Forecast by Country, 2020-2035
  • Table 23: Latin America Market Value (USD Million) Forecast by Product, 2020-2035
  • Table 24: Latin America Market Volume (Units) Forecast by Product, 2020-2035
  • Table 25: Latin America Market Value (USD Million) Forecast by Material Type, 2020-2035
  • Table 26: Latin America Market Volume (Units) Forecast by Material Type, 2020-2035
  • Table 27: Latin America Market Value (USD Million) Forecast by End Use, 2020-2035
  • Table 28: Latin America Market Volume (Units) Forecast by End Use, 2020-2035
  • Table 29: Latin America Market Value (USD Million) Forecast by End-Use Channel, 2020-2035
  • Table 30: Latin America Market Volume (Units) Forecast by End-Use Channel, 2020-2035
  • Table 31: Europe Market Value (USD Million) Forecast by Country, 2020-2035
  • Table 32: Europe Market Volume (Units) Forecast by Country, 2020-2035
  • Table 33: Europe Market Value (USD Million) Forecast by Product, 2020-2035
  • Table 34: Europe Market Volume (Units) Forecast by Product, 2020-2035
  • Table 35: Europe Market Value (USD Million) Forecast by Material Type, 2020-2035
  • Table 36: Europe Market Volume (Units) Forecast by Material Type, 2020-2035
  • Table 37: Europe Market Value (USD Million) Forecast by End Use, 2020-2035
  • Table 38: Europe Market Volume (Units) Forecast by End Use, 2020-2035
  • Table 39: Europe Market Value (USD Million) Forecast by End-Use Channel, 2020-2035
  • Table 40: Europe Market Volume (Units) Forecast by End-Use Channel, 2020-2035
  • Table 41: East Asia Market Value (USD Million) Forecast by Country, 2020-2035
  • Table 42: East Asia Market Volume (Units) Forecast by Country, 2020-2035
  • Table 43: East Asia Market Value (USD Million) Forecast by Product, 2020-2035
  • Table 44: East Asia Market Volume (Units) Forecast by Product, 2020-2035
  • Table 45: East Asia Market Value (USD Million) Forecast by Material Type, 2020-2035
  • Table 46: East Asia Market Volume (Units) Forecast by Material Type, 2020-2035
  • Table 47: East Asia Market Value (USD Million) Forecast by End Use, 2020-2035
  • Table 48: East Asia Market Volume (Units) Forecast by End Use, 2020-2035
  • Table 49: East Asia Market Value (USD Million) Forecast by End-Use Channel, 2020-2035
  • Table 50: East Asia Market Volume (Units) Forecast by End-Use Channel, 2020-2035
  • Table 51: South Asia Market Value (USD Million) Forecast by Country, 2020-2035
  • Table 52: South Asia Market Volume (Units) Forecast by Country, 2020-2035
  • Table 53: South Asia Market Value (USD Million) Forecast by Product, 2020-2035
  • Table 54: South Asia Market Volume (Units) Forecast by Product, 2020-2035
  • Table 55: South Asia Market Value (USD Million) Forecast by Material Type, 2020-2035
  • Table 56: South Asia Market Volume (Units) Forecast by Material Type, 2020-2035
  • Table 57: South Asia Market Value (USD Million) Forecast by End Use, 2020-2035
  • Table 58: South Asia Market Volume (Units) Forecast by End Use, 2020-2035
  • Table 59: South Asia Market Value (USD Million) Forecast by End-Use Channel, 2020-2035
  • Table 60: South Asia Market Volume (Units) Forecast by End-Use Channel, 2020-2035
  • Table 61: Oceania Market Value (USD Million) Forecast by Country, 2020-2035
  • Table 62: Oceania Market Volume (Units) Forecast by Country, 2020-2035
  • Table 63: Oceania Market Value (USD Million) Forecast by Product, 2020-2035
  • Table 64: Oceania Market Volume (Units) Forecast by Product, 2020-2035
  • Table 65: Oceania Market Value (USD Million) Forecast by Material Type, 2020-2035
  • Table 66: Oceania Market Volume (Units) Forecast by Material Type, 2020-2035
  • Table 67: Oceania Market Value (USD Million) Forecast by End Use, 2020-2035
  • Table 68: Oceania Market Volume (Units) Forecast by End Use, 2020-2035
  • Table 69: Oceania Market Value (USD Million) Forecast by End-Use Channel, 2020-2035
  • Table 70: Oceania Market Volume (Units) Forecast by End-Use Channel, 2020-2035
  • Table 71: MEA Market Value (USD Million) Forecast by Country, 2020-2035
  • Table 72: MEA Market Volume (Units) Forecast by Country, 2020-2035
  • Table 73: MEA Market Value (USD Million) Forecast by Product, 2020-2035
  • Table 74: MEA Market Volume (Units) Forecast by Product, 2020-2035
  • Table 75: MEA Market Value (USD Million) Forecast by Material Type, 2020-2035
  • Table 76: MEA Market Volume (Units) Forecast by Material Type, 2020-2035
  • Table 77: MEA Market Value (USD Million) Forecast by End Use, 2020-2035
  • Table 78: MEA Market Volume (Units) Forecast by End Use, 2020-2035
  • Table 79: MEA Market Value (USD Million) Forecast by End-Use Channel, 2020-2035
  • Table 80: MEA Market Volume (Units) Forecast by End-Use Channel, 2020-2035

List of Figures

  • Figure 1: Global Market Value (USD Million) by Product, 2025-2035
  • Figure 2: Global Market Value (USD Million) by Material Type, 2025-2035
  • Figure 3: Global Market Value (USD Million) by End Use, 2025-2035
  • Figure 4: Global Market Value (USD Million) by End-Use Channel, 2025-2035
  • Figure 5: Global Market Value (USD Million) by Region, 2025-2035
  • Figure 6: Global Market Value (USD Million) Analysis by Region, 2020-2035
  • Figure 7: Global Market Volume (Units) Analysis by Region, 2020-2035
  • Figure 8: Global Market Value Share (%) and BPS Analysis by Region, 2025-2035
  • Figure 9: Global Market Y-o-Y Growth (%) Projections by Region, 2025-2035
  • Figure 10: Global Market Value (USD Million) Analysis by Product, 2020-2035
  • Figure 11: Global Market Volume (Units) Analysis by Product, 2020-2035
  • Figure 12: Global Market Value Share (%) and BPS Analysis by Product, 2025-2035
  • Figure 13: Global Market Y-o-Y Growth (%) Projections by Product, 2025-2035
  • Figure 14: Global Market Value (USD Million) Analysis by Material Type, 2020-2035
  • Figure 15: Global Market Volume (Units) Analysis by Material Type, 2020-2035
  • Figure 16: Global Market Value Share (%) and BPS Analysis by Material Type, 2025-2035
  • Figure 17: Global Market Y-o-Y Growth (%) Projections by Material Type, 2025-2035
  • Figure 18: Global Market Value (USD Million) Analysis by End Use, 2020-2035
  • Figure 19: Global Market Volume (Units) Analysis by End Use, 2020-2035
  • Figure 20: Global Market Value Share (%) and BPS Analysis by End Use, 2025-2035
  • Figure 21: Global Market Y-o-Y Growth (%) Projections by End Use, 2025-2035
  • Figure 22: Global Market Value (USD Million) Analysis by End-Use Channel, 2020-2035
  • Figure 23: Global Market Volume (Units) Analysis by End-Use Channel, 2020-2035
  • Figure 24: Global Market Value Share (%) and BPS Analysis by End-Use Channel, 2025-2035
  • Figure 25: Global Market Y-o-Y Growth (%) Projections by End-Use Channel, 2025-2035
  • Figure 26: Global Market Attractiveness by Product, 2025-2035
  • Figure 27: Global Market Attractiveness by Material Type, 2025-2035
  • Figure 28: Global Market Attractiveness by End Use, 2025-2035
  • Figure 29: Global Market Attractiveness by End-Use Channel, 2025-2035
  • Figure 30: Global Market Attractiveness by Region, 2025-2035
  • Figure 31: North America Market Value (USD Million) by Product, 2025-2035
  • Figure 32: North America Market Value (USD Million) by Material Type, 2025-2035
  • Figure 33: North America Market Value (USD Million) by End Use, 2025-2035
  • Figure 34: North America Market Value (USD Million) by End-Use Channel, 2025-2035
  • Figure 35: North America Market Value (USD Million) by Country, 2025-2035
  • Figure 36: North America Market Value (USD Million) Analysis by Country, 2020-2035
  • Figure 37: North America Market Volume (Units) Analysis by Country, 2020-2035
  • Figure 38: North America Market Value Share (%) and BPS Analysis by Country, 2025-2035
  • Figure 39: North America Market Y-o-Y Growth (%) Projections by Country, 2025-2035
  • Figure 40: North America Market Value (USD Million) Analysis by Product, 2020-2035
  • Figure 41: North America Market Volume (Units) Analysis by Product, 2020-2035
  • Figure 42: North America Market Value Share (%) and BPS Analysis by Product, 2025-2035
  • Figure 43: North America Market Y-o-Y Growth (%) Projections by Product, 2025-2035
  • Figure 44: North America Market Value (USD Million) Analysis by Material Type, 2020-2035
  • Figure 45: North America Market Volume (Units) Analysis by Material Type, 2020-2035
  • Figure 46: North America Market Value Share (%) and BPS Analysis by Material Type, 2025-2035
  • Figure 47: North America Market Y-o-Y Growth (%) Projections by Material Type, 2025-2035
  • Figure 48: North America Market Value (USD Million) Analysis by End Use, 2020-2035
  • Figure 49: North America Market Volume (Units) Analysis by End Use, 2020-2035
  • Figure 50: North America Market Value Share (%) and BPS Analysis by End Use, 2025-2035
  • Figure 51: North America Market Y-o-Y Growth (%) Projections by End Use, 2025-2035
  • Figure 52: North America Market Value (USD Million) Analysis by End-Use Channel, 2020-2035
  • Figure 53: North America Market Volume (Units) Analysis by End-Use Channel, 2020-2035
  • Figure 54: North America Market Value Share (%) and BPS Analysis by End-Use Channel, 2025-2035
  • Figure 55: North America Market Y-o-Y Growth (%) Projections by End-Use Channel, 2025-2035
  • Figure 56: North America Market Attractiveness by Product, 2025-2035
  • Figure 57: North America Market Attractiveness by Material Type, 2025-2035
  • Figure 58: North America Market Attractiveness by End Use, 2025-2035
  • Figure 59: North America Market Attractiveness by End-Use Channel, 2025-2035
  • Figure 60: North America Market Attractiveness by Country, 2025-2035
  • Figure 61: Latin America Market Value (USD Million) by Product, 2025-2035
  • Figure 62: Latin America Market Value (USD Million) by Material Type, 2025-2035
  • Figure 63: Latin America Market Value (USD Million) by End Use, 2025-2035
  • Figure 64: Latin America Market Value (USD Million) by End-Use Channel, 2025-2035
  • Figure 65: Latin America Market Value (USD Million) by Country, 2025-2035
  • Figure 66: Latin America Market Value (USD Million) Analysis by Country, 2020-2035
  • Figure 67: Latin America Market Volume (Units) Analysis by Country, 2020-2035
  • Figure 68: Latin America Market Value Share (%) and BPS Analysis by Country, 2025-2035
  • Figure 69: Latin America Market Y-o-Y Growth (%) Projections by Country, 2025-2035
  • Figure 70: Latin America Market Value (USD Million) Analysis by Product, 2020-2035
  • Figure 71: Latin America Market Volume (Units) Analysis by Product, 2020-2035
  • Figure 72: Latin America Market Value Share (%) and BPS Analysis by Product, 2025-2035
  • Figure 73: Latin America Market Y-o-Y Growth (%) Projections by Product, 2025-2035
  • Figure 74: Latin America Market Value (USD Million) Analysis by Material Type, 2020-2035
  • Figure 75: Latin America Market Volume (Units) Analysis by Material Type, 2020-2035
  • Figure 76: Latin America Market Value Share (%) and BPS Analysis by Material Type, 2025-2035
  • Figure 77: Latin America Market Y-o-Y Growth (%) Projections by Material Type, 2025-2035
  • Figure 78: Latin America Market Value (USD Million) Analysis by End Use, 2020-2035
  • Figure 79: Latin America Market Volume (Units) Analysis by End Use, 2020-2035
  • Figure 80: Latin America Market Value Share (%) and BPS Analysis by End Use, 2025-2035
  • Figure 81: Latin America Market Y-o-Y Growth (%) Projections by End Use, 2025-2035
  • Figure 82: Latin America Market Value (USD Million) Analysis by End-Use Channel, 2020-2035
  • Figure 83: Latin America Market Volume (Units) Analysis by End-Use Channel, 2020-2035
  • Figure 84: Latin America Market Value Share (%) and BPS Analysis by End-Use Channel, 2025-2035
  • Figure 85: Latin America Market Y-o-Y Growth (%) Projections by End-Use Channel, 2025-2035
  • Figure 86: Latin America Market Attractiveness by Product, 2025-2035
  • Figure 87: Latin America Market Attractiveness by Material Type, 2025-2035
  • Figure 88: Latin America Market Attractiveness by End Use, 2025-2035
  • Figure 89: Latin America Market Attractiveness by End-Use Channel, 2025-2035
  • Figure 90: Latin America Market Attractiveness by Country, 2025-2035
  • Figure 91: Europe Market Value (USD Million) by Product, 2025-2035
  • Figure 92: Europe Market Value (USD Million) by Material Type, 2025-2035
  • Figure 93: Europe Market Value (USD Million) by End Use, 2025-2035
  • Figure 94: Europe Market Value (USD Million) by End-Use Channel, 2025-2035
  • Figure 95: Europe Market Value (USD Million) by Country, 2025-2035
  • Figure 96: Europe Market Value (USD Million) Analysis by Country, 2020-2035
  • Figure 97: Europe Market Volume (Units) Analysis by Country, 2020-2035
  • Figure 98: Europe Market Value Share (%) and BPS Analysis by Country, 2025-2035
  • Figure 99: Europe Market Y-o-Y Growth (%) Projections by Country, 2025-2035
  • Figure 100: Europe Market Value (USD Million) Analysis by Product, 2020-2035
  • Figure 101: Europe Market Volume (Units) Analysis by Product, 2020-2035
  • Figure 102: Europe Market Value Share (%) and BPS Analysis by Product, 2025-2035
  • Figure 103: Europe Market Y-o-Y Growth (%) Projections by Product, 2025-2035
  • Figure 104: Europe Market Value (USD Million) Analysis by Material Type, 2020-2035
  • Figure 105: Europe Market Volume (Units) Analysis by Material Type, 2020-2035
  • Figure 106: Europe Market Value Share (%) and BPS Analysis by Material Type, 2025-2035
  • Figure 107: Europe Market Y-o-Y Growth (%) Projections by Material Type, 2025-2035
  • Figure 108: Europe Market Value (USD Million) Analysis by End Use, 2020-2035
  • Figure 109: Europe Market Volume (Units) Analysis by End Use, 2020-2035
  • Figure 110: Europe Market Value Share (%) and BPS Analysis by End Use, 2025-2035
  • Figure 111: Europe Market Y-o-Y Growth (%) Projections by End Use, 2025-2035
  • Figure 112: Europe Market Value (USD Million) Analysis by End-Use Channel, 2020-2035
  • Figure 113: Europe Market Volume (Units) Analysis by End-Use Channel, 2020-2035
  • Figure 114: Europe Market Value Share (%) and BPS Analysis by End-Use Channel, 2025-2035
  • Figure 115: Europe Market Y-o-Y Growth (%) Projections by End-Use Channel, 2025-2035
  • Figure 116: Europe Market Attractiveness by Product, 2025-2035
  • Figure 117: Europe Market Attractiveness by Material Type, 2025-2035
  • Figure 118: Europe Market Attractiveness by End Use, 2025-2035
  • Figure 119: Europe Market Attractiveness by End-Use Channel, 2025-2035
  • Figure 120: Europe Market Attractiveness by Country, 2025-2035
  • Figure 121: East Asia Market Value (USD Million) by Product, 2025-2035
  • Figure 122: East Asia Market Value (USD Million) by Material Type, 2025-2035
  • Figure 123: East Asia Market Value (USD Million) by End Use, 2025-2035
  • Figure 124: East Asia Market Value (USD Million) by End-Use Channel, 2025-2035
  • Figure 125: East Asia Market Value (USD Million) by Country, 2025-2035
  • Figure 126: East Asia Market Value (USD Million) Analysis by Country, 2020-2035
  • Figure 127: East Asia Market Volume (Units) Analysis by Country, 2020-2035
  • Figure 128: East Asia Market Value Share (%) and BPS Analysis by Country, 2025-2035
  • Figure 129: East Asia Market Y-o-Y Growth (%) Projections by Country, 2025-2035
  • Figure 130: East Asia Market Value (USD Million) Analysis by Product, 2020-2035
  • Figure 131: East Asia Market Volume (Units) Analysis by Product, 2020-2035
  • Figure 132: East Asia Market Value Share (%) and BPS Analysis by Product, 2025-2035
  • Figure 133: East Asia Market Y-o-Y Growth (%) Projections by Product, 2025-2035
  • Figure 134: East Asia Market Value (USD Million) Analysis by Material Type, 2020-2035
  • Figure 135: East Asia Market Volume (Units) Analysis by Material Type, 2020-2035
  • Figure 136: East Asia Market Value Share (%) and BPS Analysis by Material Type, 2025-2035
  • Figure 137: East Asia Market Y-o-Y Growth (%) Projections by Material Type, 2025-2035
  • Figure 138: East Asia Market Value (USD Million) Analysis by End Use, 2020-2035
  • Figure 139: East Asia Market Volume (Units) Analysis by End Use, 2020-2035
  • Figure 140: East Asia Market Value Share (%) and BPS Analysis by End Use, 2025-2035
  • Figure 141: East Asia Market Y-o-Y Growth (%) Projections by End Use, 2025-2035
  • Figure 142: East Asia Market Value (USD Million) Analysis by End-Use Channel, 2020-2035
  • Figure 143: East Asia Market Volume (Units) Analysis by End-Use Channel, 2020-2035
  • Figure 144: East Asia Market Value Share (%) and BPS Analysis by End-Use Channel, 2025-2035
  • Figure 145: East Asia Market Y-o-Y Growth (%) Projections by End-Use Channel, 2025-2035
  • Figure 146: East Asia Market Attractiveness by Product, 2025-2035
  • Figure 147: East Asia Market Attractiveness by Material Type, 2025-2035
  • Figure 148: East Asia Market Attractiveness by End Use, 2025-2035
  • Figure 149: East Asia Market Attractiveness by End-Use Channel, 2025-2035
  • Figure 150: East Asia Market Attractiveness by Country, 2025-2035
  • Figure 151: South Asia Market Value (USD Million) by Product, 2025-2035
  • Figure 152: South Asia Market Value (USD Million) by Material Type, 2025-2035
  • Figure 153: South Asia Market Value (USD Million) by End Use, 2025-2035
  • Figure 154: South Asia Market Value (USD Million) by End-Use Channel, 2025-2035
  • Figure 155: South Asia Market Value (USD Million) by Country, 2025-2035
  • Figure 156: South Asia Market Value (USD Million) Analysis by Country, 2020-2035
  • Figure 157: South Asia Market Volume (Units) Analysis by Country, 2020-2035
  • Figure 158: South Asia Market Value Share (%) and BPS Analysis by Country, 2025-2035
  • Figure 159: South Asia Market Y-o-Y Growth (%) Projections by Country, 2025-2035
  • Figure 160: South Asia Market Value (USD Million) Analysis by Product, 2020-2035
  • Figure 161: South Asia Market Volume (Units) Analysis by Product, 2020-2035
  • Figure 162: South Asia Market Value Share (%) and BPS Analysis by Product, 2025-2035
  • Figure 163: South Asia Market Y-o-Y Growth (%) Projections by Product, 2025-2035
  • Figure 164: South Asia Market Value (USD Million) Analysis by Material Type, 2020-2035
  • Figure 165: South Asia Market Volume (Units) Analysis by Material Type, 2020-2035
  • Figure 166: South Asia Market Value Share (%) and BPS Analysis by Material Type, 2025-2035
  • Figure 167: South Asia Market Y-o-Y Growth (%) Projections by Material Type, 2025-2035
  • Figure 168: South Asia Market Value (USD Million) Analysis by End Use, 2020-2035
  • Figure 169: South Asia Market Volume (Units) Analysis by End Use, 2020-2035
  • Figure 170: South Asia Market Value Share (%) and BPS Analysis by End Use, 2025-2035
  • Figure 171: South Asia Market Y-o-Y Growth (%) Projections by End Use, 2025-2035
  • Figure 172: South Asia Market Value (USD Million) Analysis by End-Use Channel, 2020-2035
  • Figure 173: South Asia Market Volume (Units) Analysis by End-Use Channel, 2020-2035
  • Figure 174: South Asia Market Value Share (%) and BPS Analysis by End-Use Channel, 2025-2035
  • Figure 175: South Asia Market Y-o-Y Growth (%) Projections by End-Use Channel, 2025-2035
  • Figure 176: South Asia Market Attractiveness by Product, 2025-2035
  • Figure 177: South Asia Market Attractiveness by Material Type, 2025-2035
  • Figure 178: South Asia Market Attractiveness by End Use, 2025-2035
  • Figure 179: South Asia Market Attractiveness by End-Use Channel, 2025-2035
  • Figure 180: South Asia Market Attractiveness by Country, 2025-2035
  • Figure 181: Oceania Market Value (USD Million) by Product, 2025-2035
  • Figure 182: Oceania Market Value (USD Million) by Material Type, 2025-2035
  • Figure 183: Oceania Market Value (USD Million) by End Use, 2025-2035
  • Figure 184: Oceania Market Value (USD Million) by End-Use Channel, 2025-2035
  • Figure 185: Oceania Market Value (USD Million) by Country, 2025-2035
  • Figure 186: Oceania Market Value (USD Million) Analysis by Country, 2020-2035
  • Figure 187: Oceania Market Volume (Units) Analysis by Country, 2020-2035
  • Figure 188: Oceania Market Value Share (%) and BPS Analysis by Country, 2025-2035
  • Figure 189: Oceania Market Y-o-Y Growth (%) Projections by Country, 2025-2035
  • Figure 190: Oceania Market Value (USD Million) Analysis by Product, 2020-2035
  • Figure 191: Oceania Market Volume (Units) Analysis by Product, 2020-2035
  • Figure 192: Oceania Market Value Share (%) and BPS Analysis by Product, 2025-2035
  • Figure 193: Oceania Market Y-o-Y Growth (%) Projections by Product, 2025-2035
  • Figure 194: Oceania Market Value (USD Million) Analysis by Material Type, 2020-2035
  • Figure 195: Oceania Market Volume (Units) Analysis by Material Type, 2020-2035
  • Figure 196: Oceania Market Value Share (%) and BPS Analysis by Material Type, 2025-2035
  • Figure 197: Oceania Market Y-o-Y Growth (%) Projections by Material Type, 2025-2035
  • Figure 198: Oceania Market Value (USD Million) Analysis by End Use, 2020-2035
  • Figure 199: Oceania Market Volume (Units) Analysis by End Use, 2020-2035
  • Figure 200: Oceania Market Value Share (%) and BPS Analysis by End Use, 2025-2035
  • Figure 201: Oceania Market Y-o-Y Growth (%) Projections by End Use, 2025-2035
  • Figure 202: Oceania Market Value (USD Million) Analysis by End-Use Channel, 2020-2035
  • Figure 203: Oceania Market Volume (Units) Analysis by End-Use Channel, 2020-2035
  • Figure 204: Oceania Market Value Share (%) and BPS Analysis by End-Use Channel, 2025-2035
  • Figure 205: Oceania Market Y-o-Y Growth (%) Projections by End-Use Channel, 2025-2035
  • Figure 206: Oceania Market Attractiveness by Product, 2025-2035
  • Figure 207: Oceania Market Attractiveness by Material Type, 2025-2035
  • Figure 208: Oceania Market Attractiveness by End Use, 2025-2035
  • Figure 209: Oceania Market Attractiveness by End-Use Channel, 2025-2035
  • Figure 210: Oceania Market Attractiveness by Country, 2025-2035
  • Figure 211: MEA Market Value (USD Million) by Product, 2025-2035
  • Figure 212: MEA Market Value (USD Million) by Material Type, 2025-2035
  • Figure 213: MEA Market Value (USD Million) by End Use, 2025-2035
  • Figure 214: MEA Market Value (USD Million) by End-Use Channel, 2025-2035
  • Figure 215: MEA Market Value (USD Million) by Country, 2025-2035
  • Figure 216: MEA Market Value (USD Million) Analysis by Country, 2020-2035
  • Figure 217: MEA Market Volume (Units) Analysis by Country, 2020-2035
  • Figure 218: MEA Market Value Share (%) and BPS Analysis by Country, 2025-2035
  • Figure 219: MEA Market Y-o-Y Growth (%) Projections by Country, 2025-2035
  • Figure 220: MEA Market Value (USD Million) Analysis by Product, 2020-2035
  • Figure 221: MEA Market Volume (Units) Analysis by Product, 2020-2035
  • Figure 222: MEA Market Value Share (%) and BPS Analysis by Product, 2025-2035
  • Figure 223: MEA Market Y-o-Y Growth (%) Projections by Product, 2025-2035
  • Figure 224: MEA Market Value (USD Million) Analysis by Material Type, 2020-2035
  • Figure 225: MEA Market Volume (Units) Analysis by Material Type, 2020-2035
  • Figure 226: MEA Market Value Share (%) and BPS Analysis by Material Type, 2025-2035
  • Figure 227: MEA Market Y-o-Y Growth (%) Projections by Material Type, 2025-2035
  • Figure 228: MEA Market Value (USD Million) Analysis by End Use, 2020-2035
  • Figure 229: MEA Market Volume (Units) Analysis by End Use, 2020-2035
  • Figure 230: MEA Market Value Share (%) and BPS Analysis by End Use, 2025-2035
  • Figure 231: MEA Market Y-o-Y Growth (%) Projections by End Use, 2025-2035
  • Figure 232: MEA Market Value (USD Million) Analysis by End-Use Channel, 2020-2035
  • Figure 233: MEA Market Volume (Units) Analysis by End-Use Channel, 2020-2035
  • Figure 234: MEA Market Value Share (%) and BPS Analysis by End-Use Channel, 2025-2035
  • Figure 235: MEA Market Y-o-Y Growth (%) Projections by End-Use Channel, 2025-2035
  • Figure 236: MEA Market Attractiveness by Product, 2025-2035
  • Figure 237: MEA Market Attractiveness by Material Type, 2025-2035
  • Figure 238: MEA Market Attractiveness by End Use, 2025-2035
  • Figure 239: MEA Market Attractiveness by End-Use Channel, 2025-2035
  • Figure 240: MEA Market Attractiveness by Country, 2025-2035

Frequently Asked Questions

What was the overall size of the Bulk Container Packaging Market in 2025?

The market size was USD 21.8 Billion in 2025.

How big is the Bulk Container Packaging Market expected to be in 2035?

The market is projected to reach USD 31.6 Billion in 2035.

What will drive the demand for the Bulk Container Packaging Market during the forecast period?

The market will grow due to rising global trade, demand for reusable bulk packaging, sustainability mandates, and smart logistics technologies.

List the top 5 countries contributing to the Bulk Container Packaging Market?

The top 5 contributing countries are the USA, China, India, Germany, and Brazil.

Explore Similar Insights

Future Market Insights

Bulk Container Packaging Market