Butcher Paper Market Size and Share Forecast Outlook 2025 to 2035

The butcher paper market is projected to grow from USD 1,287.6 million in 2025 to USD 1,929.8 million by 2035, registering a CAGR of 4.1% during the forecast period. Sales in 2024 reached USD 1,276.3 million, reflecting steady demand driven by increased consumption of fresh meat products and a growing preference for sustainable packaging.

This growth is driven by the rising popularity of barbecue culture, expanding food service establishments, and heightened awareness of eco-friendly packaging solutions. The versatility of butcher paper in applications such as meat wrapping, tray lining, and disposable work surfaces has further fueled its demand.
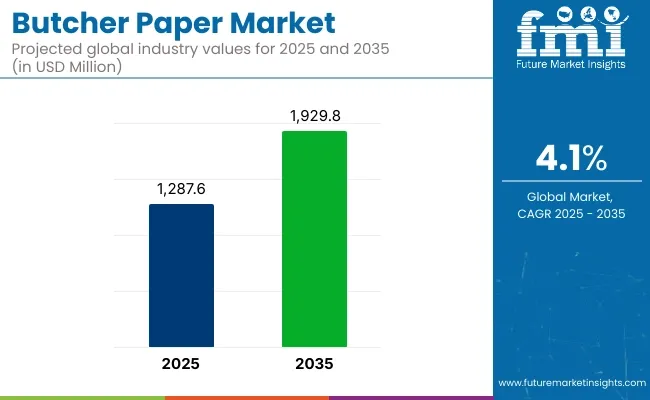
Butcher Paper Market

Metric Value
Market Size in 2025 USD 1,287.6 million
Projected Market Size in 2035 USD 1,929.8 million
CAGR (2025 to 2035) 4.1%

In response to the escalating demand for sustainable packaging, leading companies are investing in eco-friendly butcher paper solutions. Georgia-Pacific LLC offers CounterKraft® pink and bleached butcher paper grades, emphasizing its commitment to providing recyclable and compostable packaging options. A spokesperson from Georgia-Pacific stated, “Our focus remains on delivering high-quality, sustainable products that meet the evolving needs of our customers.”

The butcher paper market is witnessing a shift towards innovative and functional solutions. Manufacturers are developing butcher paper with enhanced grease resistance and moisture barrier properties, catering to the needs of the food service industry. Additionally, the incorporation of custom printing and branding on butcher paper offers businesses an avenue for marketing and customer engagement. These advancements align with the growing consumer preference for packaging that is both functional and environmentally responsible.

The butcher paper market is poised for sustained growth, driven by the increasing demand for sustainable packaging and the expansion of the food and beverage industry. Companies that invest in eco-friendly materials, innovative designs, and customization are likely to gain a competitive edge. As environmental regulations become more stringent and consumer awareness of sustainability grows, the adoption of compostable and recyclable butcher paper is expected to become a standard in the industry.

Analyzing Butcher Paper Market by Top Investment Segments

Unbleached Butcher Paper Leads with Demand from Foodservice Industry

Unbleached butcher paper is set to lead the butcher paper market by 2025, accounting for an estimated 52.3% market share as operators in the foodservice industry respond to demand for natural, recyclable packaging. These papers are widely used by meat processors, grocery delis, and barbecue restaurants for wrapping fresh meats and lining trays.

Their natural texture and rustic appeal align well with current trends in artisanal food presentation and plastic-free packaging. One of the key advantages of unbleached butcher paper lies in its compatibility with flexographic and offset printing, allowing for high-quality custom logos, product information, and promotional branding.
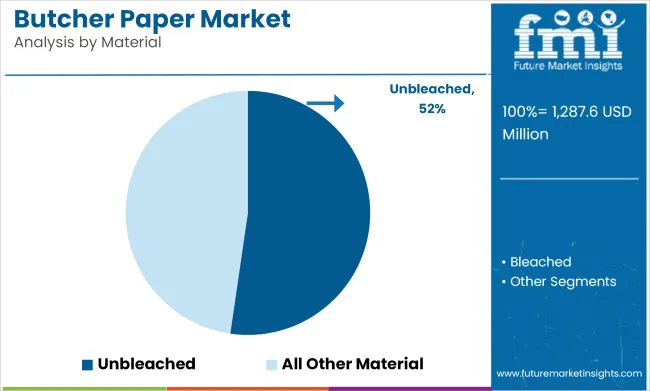
Butcher Paper Market Analysis By Material

With a growing number of manufacturers certifying their products under FSC and SFI chains of custody, butcher paper made from responsibly sourced pulp is being positioned as a low-waste alternative to polyethylene films and wax-coated wraps. Food safety and grease resistance are being improved without compromising print quality, through the use of fluorine-free barrier treatments. As foodservice and retail packaging policies tighten, unbleached butcher paper is expected to retain its dominance across both premium and bulk-purchase formats.

Foodservice Segment Drives Butcher Paper Demand with Focus on Grease Resistance and Presentation Appeal

The foodservice segment is expected to account for over 46.3% of the global butcher paper market by 2025, making it the leading end-use sector. This strong demand is driven by the wide application of butcher paper in quick-service restaurants, delis, butcher shops, barbecue joints, and specialty food outlets, where it is used for wrapping meats, lining trays, and enhancing food presentation.
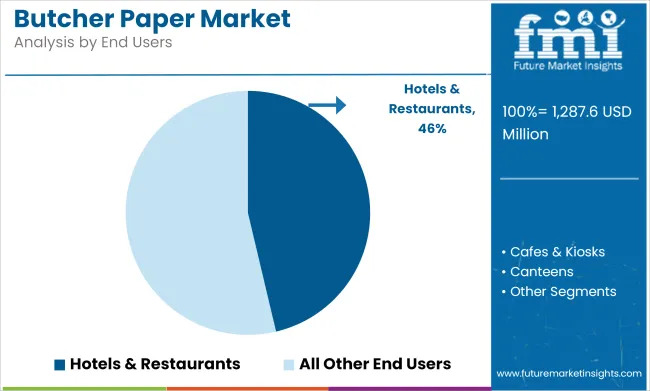
Butcher Paper Market Analysis By End Users

Butcher paper is preferred in foodservice due to its durability, breathability, and grease-resistant properties. It effectively retains moisture while allowing excess steam to escape, keeping grilled or smoked foods fresh and flavorful. Specialty variants like pink (or peach-treated) butcher paper are increasingly used in barbecue applications to wrap briskets and ribs, supporting proper smoke penetration while preserving juiciness an attribute that is enhancing their appeal among chefs and pitmasters.

Additionally, white butcher paper is widely used for sandwich wrapping, tray liners, and food parceling due to its clean appearance and customizable printability, which aids brand visibility and customer experience in food outlets. The shift toward compostable and unbleached kraft variants also reflects the growing demand for sustainable packaging solutions in the foodservice sector, aligning with eco-conscious consumer preferences and evolving industry standards.

With the continued expansion of takeaway and delivery models, particularly post-pandemic, butcher paper consumption in the foodservice industry is expected to rise significantly, driven by its cost-effectiveness, functional performance, and alignment with hygiene and sustainability trends.

Challenges and Opportunities

Challenges

Environmental Concerns and Competition from Alternative Packaging Solutions

One of the key challenges in the Butcher Paper Market is the growing environmental concerns associated with paper production and disposal. Despite being biodegradable, the manufacturing process of butcher paper involves resource-intensive processes, including deforestation and water consumption.

Additionally, the rising adoption of eco-friendly and reusable packaging materials, such as compostable wraps, waxed cloth, and biodegradable films, is increasing competition for butcher paper.

Opportunities

Growth in Sustainable and Customizable Butcher Paper Solutions

One of the biggest threats to the Butcher Paper Market is mounting environmental pressure with regard to paper manufacturing and disposal. While paper is biodegradable, its manufacturing includes consumptive practices such as deforestation of forest land and water consumption. In addition, consumers are shifting towards green and reusable packaging materials made of compostable wraps, waxed cloth, and biodegradable film to challenge butcher paper.

Country-wise Outlook

Country Wise Analysis Of Butcher Paper Market

United States

United States demand for butcher paper is rising in steps with an increased consumers' interest in environmental friendly food packing, increasing consumption of meat, and increased barbeque culture. Food institutions such as butchering homes, steakhouses, deli shops, and barbecues restaurants are highly dependent on the use of butcher paper in covering meat, trays lining, and serving foods in an environmental way in rural countryside form.

With increasing interest in plastic waste, a lot of restaurants, supermarkets, and meat processors are turning towards biodegradable and recyclable packaging, which indirectly is inducing demand for unbleached kraft pulp butcher paper. Outdoor barbecue and home grilling lifestyle has also created consumer demand for waxed and pink butcher paper to maintain moisture content and let penetration of smoke in barbecued meat.

In addition, the USA Food and Drug Administration (FDA) and USA Department of Agriculture (USDA) impose rigorous food safety and sanitation requirements, additionally demanding high-quality, food-grade butcher paper use in meat packaging. Online meal kits and specialty butcher shops also drive demand for custom-printed butcher paper as company’s desire improved presentation and promotional benefits.

Country CAGR (2025 to 2035)
USA 4.4%

United Kingdom

The UK butcher paper industry is growing continuously with the rising sustainability issues, government policies against plastic usage, and the growing demand for the quality of meat packaging. Due to the UK's Plastic Packaging Tax and efforts to reduce waste, retailers and foodservice businesses are moving towards a growing trend of using compostable and recyclable butcher paper as an alternative to plastic wraps and synthetic food packaging.

The culture of butcher shops still prevails in the UK, where hand cutting of meats, farm-to-table supply chains, and organic foods are trendy. Natural, unbleached butcher paper is being pushed to stay fresh and appear presentable. Growth in takeaway and deli counter segments also drives adoption of butcher paper to wrap sandwiches, cheese, and specialty meats.

Increasing popularity of high-end burger houses and barbecue restaurants in city centers such as London, Manchester, and Birmingham is also fueling sales of grease-resistant foodservice butcher paper in a natural, green manner. Moreover, private-labelling and specialty printing of butcher paper are also becoming more popular amongst high-end meat wholesalers and chain restaurants.

Country CAGR (2025 to 2035)
UK 4.2%

European Union

The EU market for butcher paper is witnessing stable growth as a result of environmental regulatory pressures such as the necessity for sustainable packaging of food, growing premium meat markets, and regulatory pressures. EU's Single-Use Plastics Directive and Circular Economy Action Plan are pressurizing retailers, butchers, and food processors to migrate from plastic food wraps to biodegradable packaging alternatives of butcher paper.

These three countries are substantial free-range meat markets for organically branded organic and premium meat products with strong pressure towards the use of good quality food-grade butcher paper. Demand for waxed butcher paper and parchment as over-the-counter agents of choice is being fueled also due to penetrating deeper into delicatessens, high-end cheese boutiques, and high-end artisanal bakeries offering specialty fare.

Northern and Western European grilling and barbecuing culture is growing, further fueling demand for pink and smoked butcher paper, which is commonly used for household barbecuing as well as for BBQ restaurants. In addition, major food package corporations are putting their stakes on grease-resistant coated butcher paper solutions, which are EU sustainability standards compliant and have high-performing packages.

Country CAGR (2025 to 2035)
EU 4.1%

Japan

The butcher paper market of Japan is rising steadily with increased demand for premium meat packaging, increasing sustainability drives, and enhanced popularity of Western-style BBQ and gourmet meat retailers. The Japanese Ministry of Agriculture, Forestry and Fisheries (MAFF) is promoting green food packaging substitutes, which are fueling more use of recyclable butcher paper in butcher stores, supermarkets, and premium meat suppliers.

While Japan focuses on presentation and looks of food, upscale meat stores are resorting to customized-printed butcher paper to enhance branding and customer experience. Following suit for waxed and pink butcher paper is also the growth of Western-style steakhouses, burger joints, and barbecue restaurants in efforts to improve meat preservation and presentation.

Additionally, there is new anti-bacterial and greaseproof butcher paper coming up that is revolutionizing the market, conforming to Japan's high standards of food sanitation. High-quality food-grade wrapping papers for ensuring freshness in transportation are also becoming more in demand in the exportation of quality Wagyu beef.

Country CAGR (2025 to 2035)
Japan 4.3%

South Korea

South Korea's butcher paper market is growing with the rise in premium meat consumption, growing demand for food safety, and green packaging demand. The Korean Ministry of Environment has implemented a campaign to encourage biodegradable and recyclable packaging, and thus there has been increased use of food-grade butcher paper in supermarkets, butcher shops, and high-end beef stores.

With Korean barbecue food culture spreading globally, local restaurateurs and consumers alike are calling for specialty, heat-resistant butcher paper more and more. Furthermore, increasing online meat delivery businesses are pushing demand for personalized, brand-marked butcher paper packaging for improved brand identity and food safety.

Investments by South Korea in cutting-edge food packaging technology such as greaseproof and antimicrobial butcher paper also improve product quality and shelf life.

Country CAGR (2025 to 2035)
South Korea 4.2%

Competitive Outlook

The Butcher paper industry is experiencing stable growth because of the demand for food-safe wrapping materials in the meat sector, barbecue restaurants, and supermarkets.
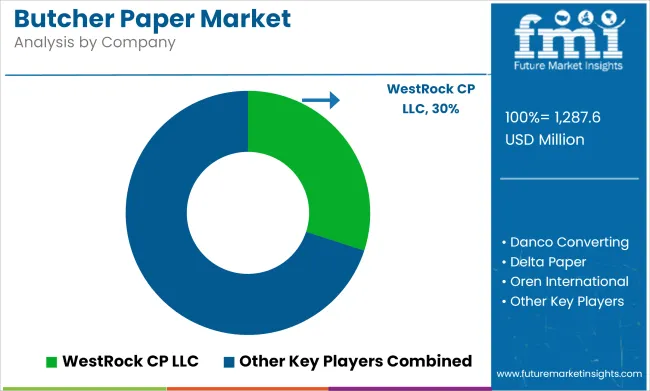
Butcher Paper Market Analysis By Company

Growing consumer interest in environment-friendly and biodegradable packaging, growth of foodservice markets and retail sales of meat, and increased adoption of unbleached, FDA-approved butcher paper to wrap food are propelling the growth of the market.

Key Segmentation

By Material:

  • Bleached
  • Unbleached

By Weight:

  • 35 to 65 GSM
  • 66 to 95 GSM
  • 96 to 105 GSM
  • 105 to 120 GSM

By End Users:

  • Hotels & Restaurants
  • Cafes & Kiosks
  • Canteens
  • QSR

By Region:

  • North America
  • Latin America
  • Europe
  • South Asia
  • East Asia
  • The Middle East & Africa
  • Oceania

Table of Content

  1. Executive Summary
  2. Industry Introduction, including Taxonomy and Market Definition
  3. Market Trends and Success Factors, including Macro-economic Factors, Market Dynamics, and Recent Industry Developments
  4. Global Market Demand Analysis 2020 to 2024 and Forecast 2025 to 2035, including Historical Analysis and Future Projections
  5. Global Market Analysis 2020 to 2024 and Forecast 2025 to 2035
    • Material
    • Weight
    • End Users
  6. Global Market Analysis 2020 to 2024 and Forecast 2025 to 2035, By Material
    • Bleached
    • Unbleached
  7. Global Market Analysis 2020 to 2024 and Forecast 2025 to 2035, By Weight
    • 35 to 65 GSM
    • 66 to 95 GSM
    • 96 to 105 GSM
    • 105 to 120 GSM
  8. Global Market Analysis 2020 to 2024 and Forecast 2025 to 2035, By End Users
    • Hotels & Restaurants
    • Cafes & Kiosks
    • Canteens
    • QSR
  9. Global Market Analysis 2020 to 2024 and Forecast 2025 to 2035, By Region
    • North America
    • Latin America
    • East Asia
    • South Asia & Pacific
    • Eastern Europe
    • Western Europe
    • Middle East & Africa
  10. North America Sales Analysis 2020 to 2024 and Forecast 2025 to 2035, by Key Segments and Countries
  11. Latin America Sales Analysis 2020 to 2024 and Forecast 2025 to 2035, by Key Segments and Countries
  12. East Asia Sales Analysis 2020 to 2024 and Forecast 2025 to 2035, by Key Segments and Countries
  13. South Asia & Pacific Sales Analysis 2020 to 2024 and Forecast 2025 to 2035, by Key Segments and Countries
  14. Eastern Europe Sales Analysis 2020 to 2024 and Forecast 2025 to 2035, by Key Segments and Countries
  15. Western Europe Sales Analysis 2020 to 2024 and Forecast 2025 to 2035, by Key Segments and Countries
  16. Middle East & Africa Sales Analysis 2020 to 2024 and Forecast 2025 to 2035, by Key Segments and Countries
  17. Sales Forecast 2025 to 2035 by Material, Weight, and End Users for 30 Countries
  18. Competition Outlook, including Market Structure Analysis, Company Share Analysis by Key Players, and Competition Dashboard
  19. Company Profile
    • WestRock CP LLC
    • Georgia-Pacific LLC
    • Danco Converting
    • Delta Paper
    • Oren International
    • Fulton International Industry Limited
    • Reynolds Consumer Products
    • Novolex
    • COPAMEX
    • Papertec, Inc.

List of Tables

  • Table 1: Global Market Value (US$ Million) Forecast by Region, 2020 to 2035
  • Table 2: Global Market Volume (Meters) Forecast by Region, 2020 to 2035
  • Table 3: Global Market Value (US$ Million) Forecast by Material, 2020 to 2035
  • Table 4: Global Market Volume (Meters) Forecast by Material, 2020 to 2035
  • Table 5: Global Market Value (US$ Million) Forecast by Weight, 2020 to 2035
  • Table 6: Global Market Volume (Meters) Forecast by Weight, 2020 to 2035
  • Table 7: Global Market Value (US$ Million) Forecast by End Users, 2020 to 2035
  • Table 8: Global Market Volume (Meters) Forecast by End Users, 2020 to 2035
  • Table 9: North America Market Value (US$ Million) Forecast by Country, 2020 to 2035
  • Table 10: North America Market Volume (Meters) Forecast by Country, 2020 to 2035
  • Table 11: North America Market Value (US$ Million) Forecast by Material, 2020 to 2035
  • Table 12: North America Market Volume (Meters) Forecast by Material, 2020 to 2035
  • Table 13: North America Market Value (US$ Million) Forecast by Weight, 2020 to 2035
  • Table 14: North America Market Volume (Meters) Forecast by Weight, 2020 to 2035
  • Table 15: North America Market Value (US$ Million) Forecast by End Users, 2020 to 2035
  • Table 16: North America Market Volume (Meters) Forecast by End Users, 2020 to 2035
  • Table 17: Latin America Market Value (US$ Million) Forecast by Country, 2020 to 2035
  • Table 18: Latin America Market Volume (Meters) Forecast by Country, 2020 to 2035
  • Table 19: Latin America Market Value (US$ Million) Forecast by Material, 2020 to 2035
  • Table 20: Latin America Market Volume (Meters) Forecast by Material, 2020 to 2035
  • Table 21: Latin America Market Value (US$ Million) Forecast by Weight, 2020 to 2035
  • Table 22: Latin America Market Volume (Meters) Forecast by Weight, 2020 to 2035
  • Table 23: Latin America Market Value (US$ Million) Forecast by End Users, 2020 to 2035
  • Table 24: Latin America Market Volume (Meters) Forecast by End Users, 2020 to 2035
  • Table 25: Western Europe Market Value (US$ Million) Forecast by Country, 2020 to 2035
  • Table 26: Western Europe Market Volume (Meters) Forecast by Country, 2020 to 2035
  • Table 27: Western Europe Market Value (US$ Million) Forecast by Material, 2020 to 2035
  • Table 28: Western Europe Market Volume (Meters) Forecast by Material, 2020 to 2035
  • Table 29: Western Europe Market Value (US$ Million) Forecast by Weight, 2020 to 2035
  • Table 30: Western Europe Market Volume (Meters) Forecast by Weight, 2020 to 2035
  • Table 31: Western Europe Market Value (US$ Million) Forecast by End Users, 2020 to 2035
  • Table 32: Western Europe Market Volume (Meters) Forecast by End Users, 2020 to 2035
  • Table 33: Eastern Europe Market Value (US$ Million) Forecast by Country, 2020 to 2035
  • Table 34: Eastern Europe Market Volume (Meters) Forecast by Country, 2020 to 2035
  • Table 35: Eastern Europe Market Value (US$ Million) Forecast by Material, 2020 to 2035
  • Table 36: Eastern Europe Market Volume (Meters) Forecast by Material, 2020 to 2035
  • Table 37: Eastern Europe Market Value (US$ Million) Forecast by Weight, 2020 to 2035
  • Table 38: Eastern Europe Market Volume (Meters) Forecast by Weight, 2020 to 2035
  • Table 39: Eastern Europe Market Value (US$ Million) Forecast by End Users, 2020 to 2035
  • Table 40: Eastern Europe Market Volume (Meters) Forecast by End Users, 2020 to 2035
  • Table 41: South Asia and Pacific Market Value (US$ Million) Forecast by Country, 2020 to 2035
  • Table 42: South Asia and Pacific Market Volume (Meters) Forecast by Country, 2020 to 2035
  • Table 43: South Asia and Pacific Market Value (US$ Million) Forecast by Material, 2020 to 2035
  • Table 44: South Asia and Pacific Market Volume (Meters) Forecast by Material, 2020 to 2035
  • Table 45: South Asia and Pacific Market Value (US$ Million) Forecast by Weight, 2020 to 2035
  • Table 46: South Asia and Pacific Market Volume (Meters) Forecast by Weight, 2020 to 2035
  • Table 47: South Asia and Pacific Market Value (US$ Million) Forecast by End Users, 2020 to 2035
  • Table 48: South Asia and Pacific Market Volume (Meters) Forecast by End Users, 2020 to 2035
  • Table 49: East Asia Market Value (US$ Million) Forecast by Country, 2020 to 2035
  • Table 50: East Asia Market Volume (Meters) Forecast by Country, 2020 to 2035
  • Table 51: East Asia Market Value (US$ Million) Forecast by Material, 2020 to 2035
  • Table 52: East Asia Market Volume (Meters) Forecast by Material, 2020 to 2035
  • Table 53: East Asia Market Value (US$ Million) Forecast by Weight, 2020 to 2035
  • Table 54: East Asia Market Volume (Meters) Forecast by Weight, 2020 to 2035
  • Table 55: East Asia Market Value (US$ Million) Forecast by End Users, 2020 to 2035
  • Table 56: East Asia Market Volume (Meters) Forecast by End Users, 2020 to 2035
  • Table 57: Middle East and Africa Market Value (US$ Million) Forecast by Country, 2020 to 2035
  • Table 58: Middle East and Africa Market Volume (Meters) Forecast by Country, 2020 to 2035
  • Table 59: Middle East and Africa Market Value (US$ Million) Forecast by Material, 2020 to 2035
  • Table 60: Middle East and Africa Market Volume (Meters) Forecast by Material, 2020 to 2035
  • Table 61: Middle East and Africa Market Value (US$ Million) Forecast by Weight, 2020 to 2035
  • Table 62: Middle East and Africa Market Volume (Meters) Forecast by Weight, 2020 to 2035
  • Table 63: Middle East and Africa Market Value (US$ Million) Forecast by End Users, 2020 to 2035
  • Table 64: Middle East and Africa Market Volume (Meters) Forecast by End Users, 2020 to 2035

List of Figures

  • Figure 1: Global Market Value (US$ Million) by Material, 2025 to 2035
  • Figure 2: Global Market Value (US$ Million) by Weight, 2025 to 2035
  • Figure 3: Global Market Value (US$ Million) by End Users, 2025 to 2035
  • Figure 4: Global Market Value (US$ Million) by Region, 2025 to 2035
  • Figure 5: Global Market Value (US$ Million) Analysis by Region, 2020 to 2035
  • Figure 6: Global Market Volume (Meters) Analysis by Region, 2020 to 2035
  • Figure 7: Global Market Value Share (%) and BPS Analysis by Region, 2025 to 2035
  • Figure 8: Global Market Y-o-Y Growth (%) Projections by Region, 2025 to 2035
  • Figure 9: Global Market Value (US$ Million) Analysis by Material, 2020 to 2035
  • Figure 10: Global Market Volume (Meters) Analysis by Material, 2020 to 2035
  • Figure 11: Global Market Value Share (%) and BPS Analysis by Material, 2025 to 2035
  • Figure 12: Global Market Y-o-Y Growth (%) Projections by Material, 2025 to 2035
  • Figure 13: Global Market Value (US$ Million) Analysis by Weight, 2020 to 2035
  • Figure 14: Global Market Volume (Meters) Analysis by Weight, 2020 to 2035
  • Figure 15: Global Market Value Share (%) and BPS Analysis by Weight, 2025 to 2035
  • Figure 16: Global Market Y-o-Y Growth (%) Projections by Weight, 2025 to 2035
  • Figure 17: Global Market Value (US$ Million) Analysis by End Users, 2020 to 2035
  • Figure 18: Global Market Volume (Meters) Analysis by End Users, 2020 to 2035
  • Figure 19: Global Market Value Share (%) and BPS Analysis by End Users, 2025 to 2035
  • Figure 20: Global Market Y-o-Y Growth (%) Projections by End Users, 2025 to 2035
  • Figure 21: Global Market Attractiveness by Material, 2025 to 2035
  • Figure 22: Global Market Attractiveness by Weight, 2025 to 2035
  • Figure 23: Global Market Attractiveness by End Users, 2025 to 2035
  • Figure 24: Global Market Attractiveness by Region, 2025 to 2035
  • Figure 25: North America Market Value (US$ Million) by Material, 2025 to 2035
  • Figure 26: North America Market Value (US$ Million) by Weight, 2025 to 2035
  • Figure 27: North America Market Value (US$ Million) by End Users, 2025 to 2035
  • Figure 28: North America Market Value (US$ Million) by Country, 2025 to 2035
  • Figure 29: North America Market Value (US$ Million) Analysis by Country, 2020 to 2035
  • Figure 30: North America Market Volume (Meters) Analysis by Country, 2020 to 2035
  • Figure 31: North America Market Value Share (%) and BPS Analysis by Country, 2025 to 2035
  • Figure 32: North America Market Y-o-Y Growth (%) Projections by Country, 2025 to 2035
  • Figure 33: North America Market Value (US$ Million) Analysis by Material, 2020 to 2035
  • Figure 34: North America Market Volume (Meters) Analysis by Material, 2020 to 2035
  • Figure 35: North America Market Value Share (%) and BPS Analysis by Material, 2025 to 2035
  • Figure 36: North America Market Y-o-Y Growth (%) Projections by Material, 2025 to 2035
  • Figure 37: North America Market Value (US$ Million) Analysis by Weight, 2020 to 2035
  • Figure 38: North America Market Volume (Meters) Analysis by Weight, 2020 to 2035
  • Figure 39: North America Market Value Share (%) and BPS Analysis by Weight, 2025 to 2035
  • Figure 40: North America Market Y-o-Y Growth (%) Projections by Weight, 2025 to 2035
  • Figure 41: North America Market Value (US$ Million) Analysis by End Users, 2020 to 2035
  • Figure 42: North America Market Volume (Meters) Analysis by End Users, 2020 to 2035
  • Figure 43: North America Market Value Share (%) and BPS Analysis by End Users, 2025 to 2035
  • Figure 44: North America Market Y-o-Y Growth (%) Projections by End Users, 2025 to 2035
  • Figure 45: North America Market Attractiveness by Material, 2025 to 2035
  • Figure 46: North America Market Attractiveness by Weight, 2025 to 2035
  • Figure 47: North America Market Attractiveness by End Users, 2025 to 2035
  • Figure 48: North America Market Attractiveness by Country, 2025 to 2035
  • Figure 49: Latin America Market Value (US$ Million) by Material, 2025 to 2035
  • Figure 50: Latin America Market Value (US$ Million) by Weight, 2025 to 2035
  • Figure 51: Latin America Market Value (US$ Million) by End Users, 2025 to 2035
  • Figure 52: Latin America Market Value (US$ Million) by Country, 2025 to 2035
  • Figure 53: Latin America Market Value (US$ Million) Analysis by Country, 2020 to 2035
  • Figure 54: Latin America Market Volume (Meters) Analysis by Country, 2020 to 2035
  • Figure 55: Latin America Market Value Share (%) and BPS Analysis by Country, 2025 to 2035
  • Figure 56: Latin America Market Y-o-Y Growth (%) Projections by Country, 2025 to 2035
  • Figure 57: Latin America Market Value (US$ Million) Analysis by Material, 2020 to 2035
  • Figure 58: Latin America Market Volume (Meters) Analysis by Material, 2020 to 2035
  • Figure 59: Latin America Market Value Share (%) and BPS Analysis by Material, 2025 to 2035
  • Figure 60: Latin America Market Y-o-Y Growth (%) Projections by Material, 2025 to 2035
  • Figure 61: Latin America Market Value (US$ Million) Analysis by Weight, 2020 to 2035
  • Figure 62: Latin America Market Volume (Meters) Analysis by Weight, 2020 to 2035
  • Figure 63: Latin America Market Value Share (%) and BPS Analysis by Weight, 2025 to 2035
  • Figure 64: Latin America Market Y-o-Y Growth (%) Projections by Weight, 2025 to 2035
  • Figure 65: Latin America Market Value (US$ Million) Analysis by End Users, 2020 to 2035
  • Figure 66: Latin America Market Volume (Meters) Analysis by End Users, 2020 to 2035
  • Figure 67: Latin America Market Value Share (%) and BPS Analysis by End Users, 2025 to 2035
  • Figure 68: Latin America Market Y-o-Y Growth (%) Projections by End Users, 2025 to 2035
  • Figure 69: Latin America Market Attractiveness by Material, 2025 to 2035
  • Figure 70: Latin America Market Attractiveness by Weight, 2025 to 2035
  • Figure 71: Latin America Market Attractiveness by End Users, 2025 to 2035
  • Figure 72: Latin America Market Attractiveness by Country, 2025 to 2035
  • Figure 73: Western Europe Market Value (US$ Million) by Material, 2025 to 2035
  • Figure 74: Western Europe Market Value (US$ Million) by Weight, 2025 to 2035
  • Figure 75: Western Europe Market Value (US$ Million) by End Users, 2025 to 2035
  • Figure 76: Western Europe Market Value (US$ Million) by Country, 2025 to 2035
  • Figure 77: Western Europe Market Value (US$ Million) Analysis by Country, 2020 to 2035
  • Figure 78: Western Europe Market Volume (Meters) Analysis by Country, 2020 to 2035
  • Figure 79: Western Europe Market Value Share (%) and BPS Analysis by Country, 2025 to 2035
  • Figure 80: Western Europe Market Y-o-Y Growth (%) Projections by Country, 2025 to 2035
  • Figure 81: Western Europe Market Value (US$ Million) Analysis by Material, 2020 to 2035
  • Figure 82: Western Europe Market Volume (Meters) Analysis by Material, 2020 to 2035
  • Figure 83: Western Europe Market Value Share (%) and BPS Analysis by Material, 2025 to 2035
  • Figure 84: Western Europe Market Y-o-Y Growth (%) Projections by Material, 2025 to 2035
  • Figure 85: Western Europe Market Value (US$ Million) Analysis by Weight, 2020 to 2035
  • Figure 86: Western Europe Market Volume (Meters) Analysis by Weight, 2020 to 2035
  • Figure 87: Western Europe Market Value Share (%) and BPS Analysis by Weight, 2025 to 2035
  • Figure 88: Western Europe Market Y-o-Y Growth (%) Projections by Weight, 2025 to 2035
  • Figure 89: Western Europe Market Value (US$ Million) Analysis by End Users, 2020 to 2035
  • Figure 90: Western Europe Market Volume (Meters) Analysis by End Users, 2020 to 2035
  • Figure 91: Western Europe Market Value Share (%) and BPS Analysis by End Users, 2025 to 2035
  • Figure 92: Western Europe Market Y-o-Y Growth (%) Projections by End Users, 2025 to 2035
  • Figure 93: Western Europe Market Attractiveness by Material, 2025 to 2035
  • Figure 94: Western Europe Market Attractiveness by Weight, 2025 to 2035
  • Figure 95: Western Europe Market Attractiveness by End Users, 2025 to 2035
  • Figure 96: Western Europe Market Attractiveness by Country, 2025 to 2035
  • Figure 97: Eastern Europe Market Value (US$ Million) by Material, 2025 to 2035
  • Figure 98: Eastern Europe Market Value (US$ Million) by Weight, 2025 to 2035
  • Figure 99: Eastern Europe Market Value (US$ Million) by End Users, 2025 to 2035
  • Figure 100: Eastern Europe Market Value (US$ Million) by Country, 2025 to 2035
  • Figure 101: Eastern Europe Market Value (US$ Million) Analysis by Country, 2020 to 2035
  • Figure 102: Eastern Europe Market Volume (Meters) Analysis by Country, 2020 to 2035
  • Figure 103: Eastern Europe Market Value Share (%) and BPS Analysis by Country, 2025 to 2035
  • Figure 104: Eastern Europe Market Y-o-Y Growth (%) Projections by Country, 2025 to 2035
  • Figure 105: Eastern Europe Market Value (US$ Million) Analysis by Material, 2020 to 2035
  • Figure 106: Eastern Europe Market Volume (Meters) Analysis by Material, 2020 to 2035
  • Figure 107: Eastern Europe Market Value Share (%) and BPS Analysis by Material, 2025 to 2035
  • Figure 108: Eastern Europe Market Y-o-Y Growth (%) Projections by Material, 2025 to 2035
  • Figure 109: Eastern Europe Market Value (US$ Million) Analysis by Weight, 2020 to 2035
  • Figure 110: Eastern Europe Market Volume (Meters) Analysis by Weight, 2020 to 2035
  • Figure 111: Eastern Europe Market Value Share (%) and BPS Analysis by Weight, 2025 to 2035
  • Figure 112: Eastern Europe Market Y-o-Y Growth (%) Projections by Weight, 2025 to 2035
  • Figure 113: Eastern Europe Market Value (US$ Million) Analysis by End Users, 2020 to 2035
  • Figure 114: Eastern Europe Market Volume (Meters) Analysis by End Users, 2020 to 2035
  • Figure 115: Eastern Europe Market Value Share (%) and BPS Analysis by End Users, 2025 to 2035
  • Figure 116: Eastern Europe Market Y-o-Y Growth (%) Projections by End Users, 2025 to 2035
  • Figure 117: Eastern Europe Market Attractiveness by Material, 2025 to 2035
  • Figure 118: Eastern Europe Market Attractiveness by Weight, 2025 to 2035
  • Figure 119: Eastern Europe Market Attractiveness by End Users, 2025 to 2035
  • Figure 120: Eastern Europe Market Attractiveness by Country, 2025 to 2035
  • Figure 121: South Asia and Pacific Market Value (US$ Million) by Material, 2025 to 2035
  • Figure 122: South Asia and Pacific Market Value (US$ Million) by Weight, 2025 to 2035
  • Figure 123: South Asia and Pacific Market Value (US$ Million) by End Users, 2025 to 2035
  • Figure 124: South Asia and Pacific Market Value (US$ Million) by Country, 2025 to 2035
  • Figure 125: South Asia and Pacific Market Value (US$ Million) Analysis by Country, 2020 to 2035
  • Figure 126: South Asia and Pacific Market Volume (Meters) Analysis by Country, 2020 to 2035
  • Figure 127: South Asia and Pacific Market Value Share (%) and BPS Analysis by Country, 2025 to 2035
  • Figure 128: South Asia and Pacific Market Y-o-Y Growth (%) Projections by Country, 2025 to 2035
  • Figure 129: South Asia and Pacific Market Value (US$ Million) Analysis by Material, 2020 to 2035
  • Figure 130: South Asia and Pacific Market Volume (Meters) Analysis by Material, 2020 to 2035
  • Figure 131: South Asia and Pacific Market Value Share (%) and BPS Analysis by Material, 2025 to 2035
  • Figure 132: South Asia and Pacific Market Y-o-Y Growth (%) Projections by Material, 2025 to 2035
  • Figure 133: South Asia and Pacific Market Value (US$ Million) Analysis by Weight, 2020 to 2035
  • Figure 134: South Asia and Pacific Market Volume (Meters) Analysis by Weight, 2020 to 2035
  • Figure 135: South Asia and Pacific Market Value Share (%) and BPS Analysis by Weight, 2025 to 2035
  • Figure 136: South Asia and Pacific Market Y-o-Y Growth (%) Projections by Weight, 2025 to 2035
  • Figure 137: South Asia and Pacific Market Value (US$ Million) Analysis by End Users, 2020 to 2035
  • Figure 138: South Asia and Pacific Market Volume (Meters) Analysis by End Users, 2020 to 2035
  • Figure 139: South Asia and Pacific Market Value Share (%) and BPS Analysis by End Users, 2025 to 2035
  • Figure 140: South Asia and Pacific Market Y-o-Y Growth (%) Projections by End Users, 2025 to 2035
  • Figure 141: South Asia and Pacific Market Attractiveness by Material, 2025 to 2035
  • Figure 142: South Asia and Pacific Market Attractiveness by Weight, 2025 to 2035
  • Figure 143: South Asia and Pacific Market Attractiveness by End Users, 2025 to 2035
  • Figure 144: South Asia and Pacific Market Attractiveness by Country, 2025 to 2035
  • Figure 145: East Asia Market Value (US$ Million) by Material, 2025 to 2035
  • Figure 146: East Asia Market Value (US$ Million) by Weight, 2025 to 2035
  • Figure 147: East Asia Market Value (US$ Million) by End Users, 2025 to 2035
  • Figure 148: East Asia Market Value (US$ Million) by Country, 2025 to 2035
  • Figure 149: East Asia Market Value (US$ Million) Analysis by Country, 2020 to 2035
  • Figure 150: East Asia Market Volume (Meters) Analysis by Country, 2020 to 2035
  • Figure 151: East Asia Market Value Share (%) and BPS Analysis by Country, 2025 to 2035
  • Figure 152: East Asia Market Y-o-Y Growth (%) Projections by Country, 2025 to 2035
  • Figure 153: East Asia Market Value (US$ Million) Analysis by Material, 2020 to 2035
  • Figure 154: East Asia Market Volume (Meters) Analysis by Material, 2020 to 2035
  • Figure 155: East Asia Market Value Share (%) and BPS Analysis by Material, 2025 to 2035
  • Figure 156: East Asia Market Y-o-Y Growth (%) Projections by Material, 2025 to 2035
  • Figure 157: East Asia Market Value (US$ Million) Analysis by Weight, 2020 to 2035
  • Figure 158: East Asia Market Volume (Meters) Analysis by Weight, 2020 to 2035
  • Figure 159: East Asia Market Value Share (%) and BPS Analysis by Weight, 2025 to 2035
  • Figure 160: East Asia Market Y-o-Y Growth (%) Projections by Weight, 2025 to 2035
  • Figure 161: East Asia Market Value (US$ Million) Analysis by End Users, 2020 to 2035
  • Figure 162: East Asia Market Volume (Meters) Analysis by End Users, 2020 to 2035
  • Figure 163: East Asia Market Value Share (%) and BPS Analysis by End Users, 2025 to 2035
  • Figure 164: East Asia Market Y-o-Y Growth (%) Projections by End Users, 2025 to 2035
  • Figure 165: East Asia Market Attractiveness by Material, 2025 to 2035
  • Figure 166: East Asia Market Attractiveness by Weight, 2025 to 2035
  • Figure 167: East Asia Market Attractiveness by End Users, 2025 to 2035
  • Figure 168: East Asia Market Attractiveness by Country, 2025 to 2035
  • Figure 169: Middle East and Africa Market Value (US$ Million) by Material, 2025 to 2035
  • Figure 170: Middle East and Africa Market Value (US$ Million) by Weight, 2025 to 2035
  • Figure 171: Middle East and Africa Market Value (US$ Million) by End Users, 2025 to 2035
  • Figure 172: Middle East and Africa Market Value (US$ Million) by Country, 2025 to 2035
  • Figure 173: Middle East and Africa Market Value (US$ Million) Analysis by Country, 2020 to 2035
  • Figure 174: Middle East and Africa Market Volume (Meters) Analysis by Country, 2020 to 2035
  • Figure 175: Middle East and Africa Market Value Share (%) and BPS Analysis by Country, 2025 to 2035
  • Figure 176: Middle East and Africa Market Y-o-Y Growth (%) Projections by Country, 2025 to 2035
  • Figure 177: Middle East and Africa Market Value (US$ Million) Analysis by Material, 2020 to 2035
  • Figure 178: Middle East and Africa Market Volume (Meters) Analysis by Material, 2020 to 2035
  • Figure 179: Middle East and Africa Market Value Share (%) and BPS Analysis by Material, 2025 to 2035
  • Figure 180: Middle East and Africa Market Y-o-Y Growth (%) Projections by Material, 2025 to 2035
  • Figure 181: Middle East and Africa Market Value (US$ Million) Analysis by Weight, 2020 to 2035
  • Figure 182: Middle East and Africa Market Volume (Meters) Analysis by Weight, 2020 to 2035
  • Figure 183: Middle East and Africa Market Value Share (%) and BPS Analysis by Weight, 2025 to 2035
  • Figure 184: Middle East and Africa Market Y-o-Y Growth (%) Projections by Weight, 2025 to 2035
  • Figure 185: Middle East and Africa Market Value (US$ Million) Analysis by End Users, 2020 to 2035
  • Figure 186: Middle East and Africa Market Volume (Meters) Analysis by End Users, 2020 to 2035
  • Figure 187: Middle East and Africa Market Value Share (%) and BPS Analysis by End Users, 2025 to 2035
  • Figure 188: Middle East and Africa Market Y-o-Y Growth (%) Projections by End Users, 2025 to 2035
  • Figure 189: Middle East and Africa Market Attractiveness by Material, 2025 to 2035
  • Figure 190: Middle East and Africa Market Attractiveness by Weight, 2025 to 2035
  • Figure 191: Middle East and Africa Market Attractiveness by End Users, 2025 to 2035
  • Figure 192: Middle East and Africa Market Attractiveness by Country, 2025 to 2035

Frequently Asked Questions

What was the overall size of the butcher paper market in 2025?

The overall market size for butcher paper market was USD 1,287.6 million in 2025.

How big the butcher paper market is expected in 2035?

The butcher paper market is expected to reach USD 1,929.8 million in 2035.

What will drive the demand for butcher paper market during the forecast period?

The expansion of the butcher paper market will be driven by the growing demand for sustainable and food-safe packaging solutions, supported by increasing adoption in butcher shops, delis, and food service industries.

List the top 5 countries contributing in butcher paper market?

The top 5 countries which drives the development of butcher paper market are USA, European Union, Japan, South Korea and UK.

Which segment in type is expected to lead butcher paper market?

Unbleached butcher paper and 66-95 GSM weight to command significant share over the assessment period.

Explore Similar Insights

Future Market Insights

Butcher Paper Market