
- Market Size (2026)
- USD 70.2 Mn
- Forecast (2036)
- USD 138.1 Mn
- CAGR (2026 to 2036)
- 7.0%
How big is the Cadmium Telluride Market in 2026?
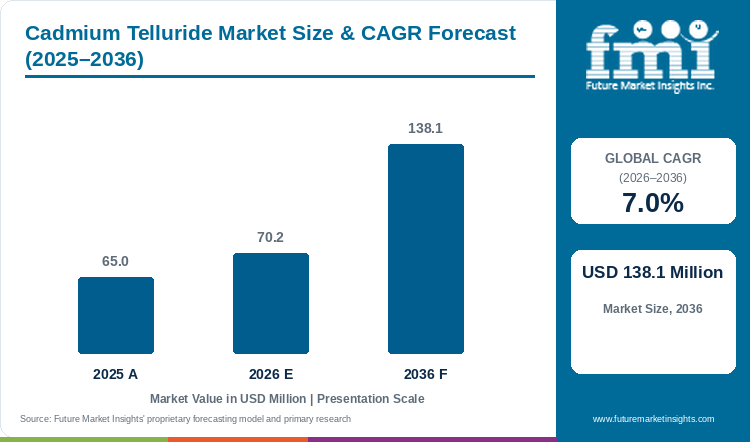
Revenue in the global cadmium telluride market is forecast to rise to USD 138.1 million by 2036 at a CAGR of 7.0% between 2026 and 2036. The market was valued at USD 65.0 million in 2025, with USD 70.2 million estimated for 2026.
Cadmium Telluride Market Size and Forecast
Table 1: Cadmium Telluride Market Size and Forecast
| Market size and forecast | Value |
|---|---|
| Market size in 2025 | USD 65.0 million |
| Estimated market size in 2026 | USD 70.2 million |
| Projected market size by 2036 | USD 138.1 million |
| CAGR from 2026 to 2036 | 7.0% |
Source: Future Market Insights analysis of the cadmium telluride market, 2026.
Material supply is being contracted around specific solar manufacturing programmes. In August 2025, 5N Plus increased its CdTe delivery commitments to First Solar by 33.0% for the 2025 to 2026 contract period, with another 25.0% increase for 2027 to 2028. That commitment gives compound producers a clearer production requirement than a national solar installation target. It also shows why the 88.0% Thin-Film Solar Modules share carries substantial customer concentration. Qualification at a few large plants matters more than broad installer access.
Physical form shapes the supplier's opportunity. Powder and Granules represent 45.0% of 2026 revenue, but their share falls to 39.9% in the 2036 outlook. Sputtering Targets and Deposition Feedstock reach 40.8% by that year. First Solar reported 4.3 GW of module production in the third quarter of 2026. Suppliers therefore need to follow plant schedules, material specifications and recovery arrangements together. The wider thin film solar cells market provides downstream context, while this assessment isolates the semiconductor material.
Key Market Trends & Insights
- Tellurium recovery remains linked to other metals. The US Geological Survey identifies electrolytic copper refining as its principal source. Expanding CdTe demand consequently requires attention to recovery and refining capability.
- Detector demand rewards a different material offer. Acrorad lists CdTe detectors with several electrode configurations and customer-specific dimensions. A supplier serving this business must support reproducible electrical performance as well as chemical purity.
- Recycling is part of the supply proposition. The module maker's programme recovers semiconductor material for new modules, while 5N Plus documents secondary tellurium refining in Canada. Recovery contracts can influence access to feedstock alongside new-metal purchases.
Regional Highlights
- Global share rises for India, China and Vietnam. FMI projects India from 14.0% to 17.7%, China from 4.0% to 4.6% and Vietnam from 4.0% to 4.2% over 2026 to 2036.
- Share slips for the United States, Malaysia and Germany as revenue grows. FMI projects the United States from 58.0% to 55.6%, Malaysia from 3.0% to 2.6% and Germany from 4.0% to 3.5% over the same period.
Analyst Perspective
“The most defensible position in CdTe supply is an accepted material specification attached to a continuing production programme. Additional solar capacity creates an opportunity only when it becomes sustained material throughput. Detector growth offers a second route, but crystal performance and the distinction between CdTe and CZT become decisive. Suppliers that recover useful semiconductor feedstock while maintaining consistent material quality have a commercial advantage that a broad metals catalogue alone cannot establish.”
- Sudip Saha, Co-founder, FMI
How is the Cadmium Telluride Market segmented?
- By application: Thin-Film Solar Modules, Radiation Detectors and Imaging, and Infrared and Other Optoelectronics.
- By form: Powder and Granules, Sputtering Targets and Deposition Feedstock, and Crystals and Wafers.
- By material source: Virgin Compound and Recovered and Recycled Material.
- By region: North America, Western Europe, East Asia, South Asia, Southeast Asia, and Rest of world.
Why does the Thin-Film Solar Modules segment lead by Application in the Cadmium Telluride Market in 2026?
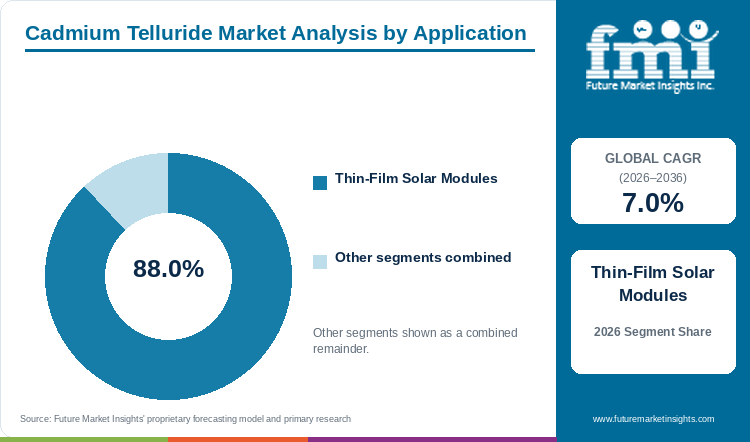
The Thin-Film Solar Modules segment holds 88.0% of the Cadmium Telluride Market by application in 2026.
Solar manufacturing gives this category repeated industrial material requirements. The US Department of Energy's January 2025 perspective identifies CdTe as a significant established technology in American utility-scale photovoltaics. It also identifies material availability and supply-chain cost as priorities for further expansion. Those concerns connect module production directly to the compound supplier's ability to deliver accepted lots.
Demand from the leading application varies across solar projects. Semiconductor material is bought where modules are manufactured, while the finished modules may be installed elsewhere. A country can therefore deploy substantial solar capacity and buy little raw CdTe. This is one reason the US factory expansion programme is more directly relevant to material orders than a general increase in worldwide solar installations.
FMI expects Thin-Film Solar Modules revenue to reach USD 116.1 million in 2036, at a 6.5% CAGR. Its share eases to 84.0% as Radiation Detectors and Imaging grow more quickly. This remains a solar-led market throughout the forecast, but a supplier focused only on bulk photovoltaic orders may miss a smaller source of higher-specification demand. The separate thin film photovoltaics market includes finished technologies whose full selling values are outside this material assessment.
Radiation Detectors and Imaging and Infrared and Other Optoelectronics together hold the remaining 12.0% by application.
Table 2: Application, 2026 Share
| Leading Share | 2026 market share |
|---|---|
| Thin-Film Solar Modules | 88.0% |
| All Other Segments Combined Share | 12.0% |
Source: Future Market Insights analysis of the cadmium telluride market, 2026.
Why does the Powder and Granules segment lead by Form in the Cadmium Telluride Market in 2026?
The Powder and Granules segment holds 45.0% of the Cadmium Telluride Market by form in 2026.
This category leads because the material business extends beyond finished crystalline detector elements. Compound producers supply forms that enter further manufacturing stages. A powder offer therefore competes on consistency and compatibility with the customer's process. Vital Materials' tellurium portfolio includes CdTe alongside several other compounds, with customization for specific requirements. The purchasing distinction is the specified compound and form delivered.
Powder and Granules remain an important revenue pool through 2036, reaching USD 55.1 million at a 5.7% CAGR. They cease to be the leading form in the endpoint forecast. Sputtering Targets and Deposition Feedstock reach USD 56.4 million and a 40.8% share, while Crystals and Wafers rise to USD 26.6 million. Suppliers should therefore avoid treating the base-year ranking as a permanent description of customer requirements.
The classification follows the delivered commercial form. Powder intended for a later deposition step belongs in Powder and Granules until it is delivered as the specified deposition product. Counting the same material again after conversion would overstate the market. Commercial comparisons must also keep the cost of downstream crystal fabrication separate from the price of its input compound.
Sputtering Targets and Deposition Feedstock and Crystals and Wafers together hold the remaining 55.0% by form.
Table 3: Form, 2026 Share
| Leading Share | 2026 market share |
|---|---|
| Powder and Granules | 45.0% |
| All Other Segments Combined Share | 55.0% |
Source: Future Market Insights analysis of the cadmium telluride market, 2026.
Why does the Virgin Compound segment lead by Material Source in the Cadmium Telluride Market in 2026?
The Virgin Compound segment holds 84.0% of the Cadmium Telluride Market by material source in 2026.
Virgin compound leads because module production needs semiconductor material that meets a fixed purity and consistency specification, and new tellurium supply reaches producers through established refining channels. Tellurium is largely recovered through other metal-refining activities, while exports of specified Chinese tellurium products require licensing. A module line buys against a specification, so virgin material remains the reference input.
Recovered material is the growing alternative. One module maker's programme recovers semiconductor material for new modules, and a Canadian refiner documents secondary tellurium refining. Only the recovered semiconductor fraction is CdTe, and it must be separated and restored to specification before it re-enters production.
FMI's 2026 assessment values Virgin Compound at USD 59.0 million. The recovered share can rise while virgin volume holds in the near term. Suppliers should report recovered tonnage separately from gross module waste.
Recovered and Recycled Material together hold the remaining 16.0% by material source.
Table 4: Material Source, 2026 Share
| Leading Share | 2026 market share |
|---|---|
| Virgin Compound | 84.0% |
| All Other Segments Combined Share | 16.0% |
Source: Future Market Insights analysis of the cadmium telluride market, 2026.
What are the key drivers restraints and opportunities?
Factory production supports the largest CdTe orders. Restricted tellurium access and customer concentration constrain supply flexibility, while semiconductor recovery and qualified detector materials provide additional commercial routes.
Driver
Additional operating photovoltaic manufacturing creates recurring semiconductor requirements, supported by explicit material supply commitments.
Restraint
Tellurium is largely recovered through other metal-refining activities, while exports of specified Chinese tellurium products require licensing.
Opportunity
Recovery of semiconductor material and growth in accepted CdTe detector products expand the supplier offer beyond virgin compound tonnage.
How do purchasing rules and qualification affect cadmium telluride market demand?
The important growth trigger is the use of installed production equipment. A module factory can announce large annual capacity before its material consumption reaches a sustained level. The Louisiana inauguration illustrates the distinction: the November 2025 announcement described both an operating facility and the additional annual capacity expected after ramp-up. Compound suppliers must match delivery schedules to that ramp, since a full capacity figure becomes annual demand only gradually.
Technology improvements can also change the mix of inputs. The module maker reported that an Ohio facility had been converted to its CuRe platform during the first half of 2026. FMI's growth case therefore depends on additional material throughput and accepted specifications, while allowing for continuing changes in semiconductor design. Stronger module performance may support the downstream business with little change in material intensity.
What limits reliable cadmium telluride market supply and quality?
The main supply risk lies before the compound reaches a module line. Tellurium recovery depends on copper-refinery residues and the commercial decision to recover them. New demand for the finished semiconductor adds no refining output by itself. China also requires licences for specified tellurium products, including CdTe single-crystal and polycrystalline products. This can change the timing and documentation of an otherwise technically acceptable shipment.
Customer concentration creates a separate commercial risk. A long-term contract supports production planning, but it also ties a supplier to the customer's factory schedules and technology choices. A diversified sales list is useful only when those additional customers purchase the same qualified material.
Where can suppliers win additional business in the cadmium telluride market?
A useful opening is the return of recoverable semiconductor material to an accepted manufacturing route. The module maker describes closed-loop semiconductor recovery in its recycling programme. The compound supplier's opportunity lies in recovering and restoring material quality, with a clear separation between gross module waste and the recovered semiconductor fraction.
Radiation Detectors and Imaging provide another opportunity, with a 12.0% forecast CAGR. Acrorad's actual CdTe detector offer confirms that CdTe also serves detector applications alongside CZT. Growth requires reliable material and suitable detector performance, which narrows the relevant supplier pool. Developments in the broader radiation detection device market are useful context, but only the CdTe material component enters the revenue assessed here. Photon-counting CT, which uses semiconductor detectors, is covered in FMI's photon-counting CT scanner technology market.
Cadmium Telluride Market by Country (2026 to 2036)
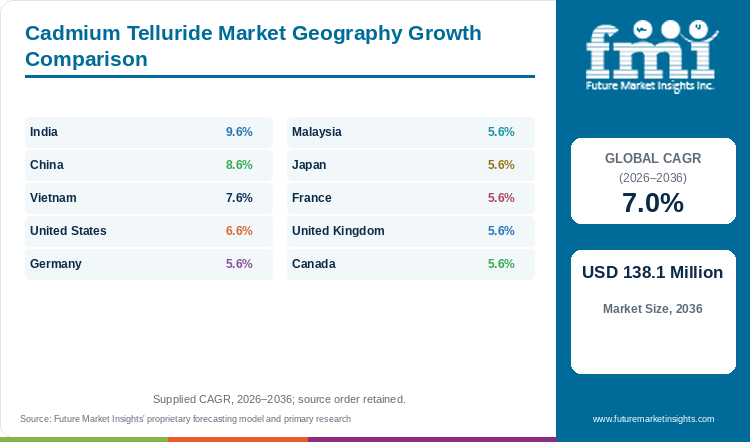
Table 5: Cadmium Telluride Market Country Growth Forecast
| Country | CAGR, 2026 to 2036 |
|---|---|
| India | 9.6% |
| China | 8.6% |
| Vietnam | 7.6% |
| United States | 6.6% |
| Germany | 5.6% |
| Malaysia | 5.6% |
| Japan | 5.6% |
| France | 5.6% |
| United Kingdom | 5.6% |
| Canada | 5.6% |
Source: Future Market Insights analysis of the cadmium telluride market, 2026.
India
Tamil Nadu provides India with an operating CdTe manufacturing anchor. In its February 2025 parliamentary answer, the Ministry of New and Renewable Energy confirmed that FS India Solar Ventures had begun module manufacturing. It listed 3,212.0 MW of capacity under the approved manufacturer list as of January 2025. This evidence makes the Indian material opportunity more specific than the country's broad ambitions for solar generation.
FMI expects a 9.6% CAGR from 2026 to 2036, taking national CdTe revenue from USD 9.8 million to USD 24.5 million. The relatively rapid growth reflects a smaller starting allocation alongside an established manufacturing route. Much of India's wider photovoltaic industry follows other semiconductor technologies, which require different inputs.
The commercial challenge is to secure a role within the actual thin-film production process. Government support for domestic module manufacturing may improve the downstream factory's position, and each compound supplier still needs its own qualified order. Material acceptance and the factory's operating schedule remain decisive. India's development also has an export dimension because international module customers and trade conditions can affect where output is sold.
For suppliers, the strongest opportunity is sustained participation in an existing industrial programme, with sufficient flexibility for changes in its material specifications. A new domestic solar installation has little direct effect on raw CdTe purchasing unless it draws on modules produced through that route. The market is consequently best assessed through manufacturing activity and accepted material flows.
China
China combines a direct material offer with an export-licensing constraint. Vital Materials lists CdTe among its tellurium compounds and describes source materials for CdTe-related crystal growth. The Ministry of Commerce's February 2025 announcement separately includes CdTe single-crystal and polycrystalline products in the controlled tellurium category. Commercial availability and permission to complete a particular export are therefore separate considerations.
FMI forecasts Chinese revenue of USD 6.4 million by 2036, compared with USD 2.8 million in 2026. The implied national outlook is an 8.6% CAGR for 2026 to 2036. This allocation describes CdTe demand within the market scope. Growth of USD 3.6 million leaves China third among the ten named countries. China ties for third on 2026 revenue within the ten-country set. Over the decade, revenue in China grows 2.3 times and the global total 2.0 times.
The licensing requirement can influence how an overseas customer qualifies a source. A technically suitable material still requires an authorized commercial route where the control applies. Buyers may consequently value a supplier's ability to provide precise product classification and shipment documentation.
China's supply role also extends beyond the domestic revenue allocation because materials can be sold into international manufacturing chains. FMI sees the main opportunity in accepted high-purity products and reliable delivery, with export status built into contract planning.
Vietnam
Vietnam participates in an international manufacturing system whose final sales may occur far from the factory. The module maker identifies the country in its operating footprint. Its 2025 annual report discusses the use of international front-end capacity alongside a new American finishing route, while the September 2026 filing confirms that the first South Carolina phase had entered commercial production. This creates a specific reason to follow processing stages when assessing material demand.
The national CdTe outlook carries a 7.6% CAGR between 2026 and 2036. Revenue rises from USD 2.8 million to USD 5.8 million. It is an outlook for the scoped semiconductor material, influenced by the use of the manufacturing network.
For compound suppliers, the place where the final module is finished can differ from the place where its semiconductor is incorporated. Freight and trade conditions can alter the economics of the overall route. The appropriate commercial response is to follow the customer's actual material-consumption point and delivery requirements, while keeping final-market sales separate.
FMI also sees a concentration risk. When demand is connected to a limited number of large industrial programmes, a change in one programme can affect orders more sharply than changes across a dispersed customer base. Additional factory capacity is therefore meaningful only when supported by continuing throughput. Vietnam's opportunity is substantial within its particular production role, but broad solar-market comparisons can obscure that role.
United States
American demand has a direct connection to large operating module factories. The Louisiana facility was inaugurated in November 2025 after a USD 1.1 billion investment. The state announcement described a further 3.5 GW of annual capacity after full ramp-up. FMI estimates the United States at USD 40.7 million in 2026 and USD 76.8 million in 2036, with a 6.6% CAGR over that period. The CAGR for the United States is 6.6%, which runs 0.4 points below the 7.0% worldwide rate. The United States holds 58.0% of global revenue in 2026 and 55.6% in 2036. The United States records a USD 36.1 million increase, first of the ten.
The market also has a less visible upstream dependency. USGS reports that American copper refineries recover copper telluride, which is exported for further processing. Downstream American companies use imported tellurium to manufacture high-purity products. Domestic module production therefore spans material transformations in more than one country. A resilient purchasing programme has to consider the intervening refining and compound stages as well as final manufacturing.
FMI's commercial reading is that suppliers gain from matching regional factory schedules with accepted material and recovery arrangements. Additional US production can improve the scale of those relationships, but cross-border sourcing remains necessary. The full revenue of an integrated module producer sits outside semiconductor-material sales. The narrower material opportunity rests on the value of CdTe delivered into the production chain. Factory output and finished-module margins indicate the customer's operating position.
Germany
Germany's role includes compound production and the handling of valuable semiconductor resources. A compound producer identifies Eisenhüttenstadt as one of the locations examined in its CdTe life-cycle assessment. The company's 2024 sustainability report also distinguishes the site's energy and primary-tellurium sourcing position from Montréal. This is direct evidence of a materials activity, which is more relevant to the present market than an inventory of German solar farms.
National revenue is forecast to rise at a 5.6% CAGR during 2026 to 2036. FMI's allocation moves from USD 2.8 million to USD 4.8 million. The scale is modest compared with the American market, yet the German operation can participate in supply chains whose final customers are located elsewhere. Domestic market revenue and the international reach of a local supplier therefore answer different commercial questions. The USD 2.0 million rise over the decade ranks Germany fifth for increase.
Energy use is a particular consideration for high-purity compound production. The company's assessment identifies energy consumption as a contributor to environmental impact and recommends greater secondary-material use. That finding supports a commercial argument for efficient refining and recovery.
FMI sees Germany's opportunity in reliable material conversion and documented performance within an international chain. The limiting factor is access to accepted feedstock and customer programmes. Suppliers need to connect their production and recovery capabilities to the customer's actual semiconductor requirements.
Malaysia
The module maker's 2025 annual report reported constrained demand for internationally produced Series 6 modules at its Malaysian and Vietnamese facilities. Malaysia therefore illustrates an important risk in CdTe: the customer can retain manufacturing capability while altering the level of production needed to serve export markets.
FMI projects Malaysian CdTe revenue at a 5.6% CAGR from 2026 to 2036, increasing from USD 2.1 million to USD 3.6 million. The forecast is a material-market outlook. A supplier has to distinguish the long-term opportunity from near-term delivery releases.
Trade and customer-market access are central to this distinction. The module maker's September 2026 filing also identifies a Malaysian tax holiday scheduled to expire in 2027, subject to employment and investment conditions. The economics of the operating site consequently matter alongside the technical capability of its equipment. Changes in final selling markets or site economics can pass back through the chain to compound requirements. A supplier's exposure can be greater than the modest national allocation suggests when local activity depends on one programme.
FMI considers order visibility and flexible delivery arrangements particularly important in Malaysia. Additional finished-module demand may improve material throughput, but it must be established through actual production requirements. Broad comparisons with the country's electronics exports provide little evidence about CdTe specifically. The stronger market reading follows the operating customer and the particular semiconductor incorporated into its products.
Japan
Japan offers a clear example of actual CdTe detector manufacturing. Acrorad lists CdTe detector elements and assemblies from its Japanese operation, with different electrode and dimensional options. The Japanese opportunity includes a verified pure-CdTe route whose commercial requirements differ from bulk photovoltaic material.
Revenue is expected to increase from USD 2.1 million in 2026 to USD 3.6 million in 2036. FMI assigns a 5.6% CAGR across the forecast period. Japan's revenue gains 1.7 times by 2036 while the world total gains 2.0 times. Global revenue share for Japan decreases from 3.0% to 2.6%. Revenue in Japan climbs by USD 1.5 million, joint sixth among the ten. In the cadmium telluride market, Japan's 5.6% CAGR sits 1.4 points below the global 7.0%.
Acrorad's product information describes assemblies on substrates and carriers as well as detector elements. A buyer of a completed detector may buy no raw compound separately. Suppliers entering this channel must understand which stage the prospective customer controls and which material specification is actually open to an external offer.
Japan also participates in the broader competition between detector materials. Canon's ownership of Redlen gives it a CZT capability, which is adjacent to the CdTe scope. FMI therefore sees Japan's opportunity in qualified detector applications, which are narrower than the national medical-imaging industry.
France
French evidence is strongest in specialist detector development. A March 2026 presentation from CEA described Caliste CdTe imaging spectrometers, including their use in space instruments and work on finer-pitch detector assemblies.
FMI's French outlook rises from USD 1.4 million in 2026 to USD 2.4 million in 2036. The 5.6% CAGR reflects the modest scale of the national material allocation. France's share of global revenue eases from 2.0% to 1.7%. The market adds USD 1.0 million over the decade, the same as the United Kingdom and Canada. France grows at 5.6% a year, 1.4 points slower than the global rate. Suppliers should assess this opportunity through specialist programmes and accepted devices.
Research customers and industrial detector developers also purchase at different stages. A project may require a small quantity of characterized material for evaluation before deciding whether to repeat the order. Commercial growth then depends on successful integration and an application with continuing demand. The CEA presentation identifies a route from scientific instrumentation toward societal applications, while retaining the development status of the newer detector concept.
FMI sees a useful opening for materials suppliers that support that transition. Reliable small-lot material and continuity between evaluation and later deliveries can matter more than headline production capacity in this channel. France's contribution is better understood as specialist demand with potential follow-on orders when a defined product or instrument is accepted.
United Kingdom
British research shows that CdTe development is continuing alongside alternative solar materials. A University of York research record published in September 2026 reports a study of hexagonal boron nitride at the back contact of CdTe solar cells. The result concerns laboratory device performance. It is relevant to the technology's development.
The United Kingdom's CdTe market is forecast at a 5.6% CAGR during 2026 to 2036, rising from USD 1.4 million to USD 2.4 million. This outlook includes specialist material demand while keeping the distinction between research activity and commercial scale. A research group may create demand for evaluation material even when no large production programme follows.
The country's detector industry requires an equally careful reading. Kromek's principal platform is CZT, and its January 2025 licensing agreement with Siemens Healthineers concerns that material. The agreement illustrates the value of detector manufacturing know-how and sits outside pure-CdTe sales. For a CdTe supplier, the relevant competitive question is whether a customer's device design selects CdTe or a different semiconductor.
FMI sees the British opportunity in technical partnerships and carefully defined supply positions. Suppliers may benefit from early material evaluation and process-development work, with later growth contingent on product selection. General compound-semiconductor expertise helps, and a qualified CdTe product still has to be established before orders follow.
Canada
Canada has an important production role even though its domestic CdTe demand allocation is comparatively small. One producer identifies Montréal as a production location and describes the ability to refine secondary tellurium into metal.
FMI expects Canadian revenue to reach USD 2.4 million in 2036 from USD 1.4 million in 2026. The national CAGR is 5.6% over 2026 to 2036. A producer can serve much larger foreign programmes while its home market remains small. Global revenue share for Canada decreases from 2.0% to 1.7%. The market adds USD 1.0 million over the decade, the same as France and the United Kingdom. Canada grows at 5.6% a year, 1.4 points slower than the global rate.
Recovery creates a specific commercial distinction. Secondary tellurium must be converted into material accepted for its next application, so access to scrap and the ability to restore appropriate quality both matter. The Canadian opportunity is consequently connected to the operation of a cross-border materials chain. A large quantity of returned equipment gives no measure of CdTe recovered and sold.
Redlen provides a separate Canadian detector reference. Its current company information identifies CZT imaging modules and confirms Canon ownership. That business is relevant to adjacent detector competition, and its CZT sales sit outside CdTe. FMI's reading of Canada therefore separates direct compound production, domestic material demand and neighboring semiconductor technologies. Maintaining those distinctions gives a more useful assessment of Canadian CdTe customers.
Who are the notable companies in the Cadmium Telluride Market?
Notable companies in the Cadmium Telluride Market include 5N Plus, First Solar, Vital Materials and Acrorad.
5N Plus, First Solar and Vital Materials are central to understanding how CdTe moves from a specialty compound into industrial products. 5N Plus has a documented CdTe supply relationship with First Solar. Vital Materials includes the compound in a wider high-purity materials offer. Their product and customer positions should be examined at the level of the actual compound delivered.
First Solar is principally the integrated module producer and major material customer in this comparison. Its manufacturing activity creates demand and establishes technical requirements, and its full module revenue sits outside CdTe material sales. Its recycling programme also influences the circulation of semiconductor resources through the chain.
Kromek Group and Redlen Technologies provide important adjacent detector comparisons. Their published core material is CZT, which includes zinc. Redlen is part of Canon following the completed 2021 acquisition. These firms demonstrate the commercial importance of crystal quality and detector integration, but their CZT sales sit outside the pure-CdTe scope. Acrorad is the documented CdTe detector supplier in this group.
Direct compound and high-purity material offers: 5N Plus and Vital Materials.
Integrated photovoltaic manufacturing and semiconductor recovery: First Solar.
CdTe detector elements and assemblies: Acrorad.
Adjacent CZT references outside the market scope: Kromek Group and Redlen Technologies.
Key Developments in the Cadmium Telluride Market
- In September 2026, the first phase of First Solar's South Carolina facility entered commercial production. The company described the facility as bringing final processes for internationally initiated modules into the United States.
Key Players in the Cadmium Telluride Market
- 5N Plus
- First Solar
- Vital Materials
- Acrorad
Cadmium Telluride Market Report Scope
Table 6: Cadmium Telluride Market Report Scope
| Coverage field | Report scope |
|---|---|
| Market definition | CdTe semiconductor material for thin-film photovoltaic modules and radiation detectors, including high-purity compound, powders, sputtering and deposition grades. |
| Revenue boundary | Semiconductor-material value, separate from complete solar modules, detector assemblies and installation services. |
| Material exclusions | Elemental cadmium and tellurium, unrelated compounds and full CZT or mercury-cadmium-telluride product revenues. |
| Quantitative Units | USD million |
| Application coverage | Thin-Film Solar Modules. Radiation Detectors and Imaging. Infrared and Other Optoelectronics. |
| Form coverage | Powder and Granules. Sputtering Targets and Deposition Feedstock. Crystals and Wafers. |
| Geography | United States, India, Germany, Vietnam, China, Malaysia, Japan, France, United Kingdom, Canada and Rest of world aggregate. |
| Companies examined | 5N Plus, First Solar, Vital Materials and Acrorad, with Kromek Group and Redlen Technologies examined as adjacent CZT references. |
| Commercial coverage | Material qualification, manufacturing activity, feedstock access, recovery and the relationship between compound and finished-product demand. |
| Material Source coverage | Virgin Compound, Recovered and Recycled Material. |
Source: Future Market Insights analysis of the cadmium telluride market, 2026.
Cadmium Telluride Market Research Methodology
This assessment combines FMI's numerical outlook with secondary review of original government, company and research publications. The analysis checks market periods, units, segment comparisons and company identities. Commercial interpretation distinguishes CdTe material from elemental feedstock, adjacent semiconductors and finished products, while preserving the status and scope of each cited development.
Cadmium Telluride Market by Segments
Cadmium Telluride Market segmented by Application:
- Thin-Film Solar Modules
- Radiation Detectors and Imaging
- Infrared and Other Optoelectronics
Cadmium Telluride Market segmented by Form:
- Powder and Granules
- Sputtering Targets and Deposition Feedstock
- Crystals and Wafers
Cadmium Telluride Market segmented by Material Source:
- Virgin Compound
- Recovered and Recycled Material
Cadmium Telluride Market by Region
- North America
- United States
- Canada
- Western Europe
- Germany
- France
- United Kingdom
- East Asia
- China
- Japan
- South Asia
- India
- Southeast Asia
- Vietnam
- Malaysia
- Rest of world aggregate
Research Sources and Bibliography
- 5N Plus. (2025, August 5). Scales Up and Expands Critical Materials Supply Agreement with First Solar.
- 5N Plus. (2025). 2024 Sustainability Report, CdTe life-cycle assessment.
- 5N Plus. (Accessed 2026, November 9). Specialty Semiconductors, Cadmium Telluride.
- Acrorad. (Accessed 2026, November 9). CdTe Detector.
- Canon. (2021, September 29). Completes Acquisition of Redlen Technologies as a Wholly Owned Subsidiary.
- First Solar. (2026, October 29). Form 10-Q for the quarter ended September 30, 2026.
- First Solar. (2026). 2025 Annual Report, Manufacturing section.
- First Solar. (Accessed 2026, November 9). Manufacturing.
- First Solar. (Accessed 2026, November 9). Recycling.
- Government of India, Ministry of New and Renewable Energy. (2025, February 4). Rajya Sabha Unstarred Question 310, Manufacturing Solar Panel in Collaboration with US Companies.
- Kromek Group. (Accessed 2026, November 9). What Is CZT?
- Limousin, O., CEA-Saclay. (2026, March 24). CdTe Based Hard X-ray Detector Developments at CEA for Space Science and Societal Applications. XGRADE 2026 conference contribution.
- Louisiana Economic Development. (2025, November 21). First Solar Inaugurates New USD 1.1 Billion AI-Enabled Louisiana Manufacturing Facility.
- Ministry of Commerce and General Administration of Customs, China. (2025, February 4). Announcement 10 of 2025 on export controls for tungsten, tellurium, bismuth, molybdenum and indium related items.
- Mumtaz, A., et al. (2026, September 1; online July 3). Incorporation of 2-D Hexagonal Boron Nitride in Thin Film Solar Cells. 2D Materials, 13(3), 035012. University of York research record.
- Redlen Technologies. (Accessed 2026, November 9). About Us.
- Siemens Healthineers. (2025, January 30). Licenses Technology from Kromek for CZT-Based SPECT Detector Production.
- US Department of Energy. (2025, January). Cadmium Telluride Photovoltaics Perspective Paper.
- US Geological Survey. (2026, May). Mineral Commodity Summaries 2026, Tellurium chapter.
- Vital Materials. (Accessed 2026, November 9). MBE Sources.
- Vital Materials. (Accessed 2026, November 9). Tellurium.
Table of Content
- Key Takeaways
- Market Size and CAGR
- Top Growth Driver
- Fastest Growing Segment
- Leading Region
- Key Companies
- Emerging Opportunities
- Executive Summary
- Global Market Outlook
- Demand-side Trends
- Supply-side Trends
- Technology Roadmap Analysis
- Analysis and Recommendations
- Analyst Perspective (What is happening? Why now? What should investors know?)
- Key Questions Answered
- How large is the market?
- What is the CAGR?
- What are key trends?
- Which region dominates?
- Who are the leaders?
Read More...
- Market Overview
- Market Coverage / Taxonomy
- Market Definition / Scope / Limitations
- Research Methodology
- Chapter Orientation
- Analytical Lens and Working Hypotheses
- Market Structure, Signals, and Trend Drivers
- Benchmarking and Cross-market Comparability
- Market Sizing, Forecasting, and Opportunity Mapping
- Research Design and Evidence Framework
- Desk Research Programme (Secondary Evidence)
- Expert Input and Fieldwork (Primary Evidence)
- Tooling, Models, and Reference Databases
- Data Engineering and Model Build
- Quality Assurance and Audit Trail
- Market Background
- Market Dynamics (Drivers, Restraints, Opportunity, Trends)
- Scenario Forecast (Optimistic, Likely, Conservative)
- Impact Analysis
- AI Impact
- Sustainability Impact
- Regulatory Impact
- Technology Impact
- Consumer / Buyer Analysis
- Purchase Drivers
- Adoption Barriers
- Buyer Journey
- Opportunity Map Analysis
- Product Life Cycle Analysis
- Supply Chain Analysis
- Investment Feasibility Matrix
- Value Chain Analysis
- PESTLE and Porter's Analysis
- Regulatory Landscape
- Regional Parent Market Outlook
- Production and Consumption Statistics
- Import and Export Statistics
- Global Market Analysis and Forecast, 2021 to 2036
- Historical Market Size Value (USD Million) Analysis, 2021 to 2025
- Current and Future Market Size Value (USD Million) Projections, 2026 to 2036
- Y-o-Y Growth Trend Analysis
- Absolute $ Opportunity Analysis
- Global Market Pricing Analysis, 2021 to 2036
- Global Market Analysis and Forecast, By Application, 2021 to 2036
- Introduction / Key Findings
- Historical Market Size Value (USD Million) Analysis By Application, 2021 to 2025
- Current and Future Market Size Value (USD Million) Analysis and Forecast By Application, 2026 to 2036
- Thin-Film Solar Modules
- Radiation Detectors and Imaging
- Infrared and Other Optoelectronics
- Y-o-Y Growth Trend Analysis By Application, 2021 to 2025
- Absolute $ Opportunity Analysis By Application, 2026 to 2036
- Global Market Analysis and Forecast, By Form, 2021 to 2036
- Introduction / Key Findings
- Historical Market Size Value (USD Million) Analysis By Form, 2021 to 2025
- Current and Future Market Size Value (USD Million) Analysis and Forecast By Form, 2026 to 2036
- Powder and Granules
- Sputtering Targets and Deposition Feedstock
- Crystals and Wafers
- Y-o-Y Growth Trend Analysis By Form, 2021 to 2025
- Absolute $ Opportunity Analysis By Form, 2026 to 2036
- Global Market Analysis and Forecast, By Material Source, 2021 to 2036
- Introduction / Key Findings
- Historical Market Size Value (USD Million) Analysis By Material Source, 2021 to 2025
- Current and Future Market Size Value (USD Million) Analysis and Forecast By Material Source, 2026 to 2036
- Virgin Compound
- Recovered and Recycled Material
- Y-o-Y Growth Trend Analysis By Material Source, 2021 to 2025
- Absolute $ Opportunity Analysis By Material Source, 2026 to 2036
- Global Market Analysis and Forecast, By Region, 2021 to 2036
- Introduction
- Historical Market Size Value (USD Million) Analysis By Region, 2021 to 2025
- Current Market Size Value (USD Million) Analysis and Forecast By Region, 2026 to 2036
- North America
- Western Europe
- East Asia
- South Asia
- Market Attractiveness Analysis By Region
- North America Market Analysis and Forecast, By Country, 2021 to 2036
- Historical Market Size Value (USD Million) Trend Analysis By Market Taxonomy, 2021 to 2025
- Market Size Value (USD Million) Forecast By Market Taxonomy, 2026 to 2036
- By Country
- United States
- Canada
- By Application
- By Form
- By Material Source
- By Country
- Market Attractiveness Analysis
- By Country
- By Application
- By Form
- By Material Source
- Key Takeaways
- Western Europe Market Analysis and Forecast, By Country
- Historical Market Size Value (USD Million) Trend Analysis By Market Taxonomy, 2021 to 2025
- Market Size Value (USD Million) Forecast By Market Taxonomy, 2026 to 2036
- By Country
- Germany
- France
- United Kingdom
- By Application
- By Form
- By Material Source
- By Country
- Market Attractiveness Analysis
- By Country
- By Application
- By Form
- By Material Source
- Key Takeaways
- East Asia Market Analysis and Forecast, By Country
- Historical Market Size Value (USD Million) Trend Analysis By Market Taxonomy, 2021 to 2025
- Market Size Value (USD Million) Forecast By Market Taxonomy, 2026 to 2036
- By Country
- China
- Japan
- By Application
- By Form
- By Material Source
- By Country
- Market Attractiveness Analysis
- By Country
- By Application
- By Form
- By Material Source
- Key Takeaways
- South Asia Market Analysis and Forecast, By Country
- Historical Market Size Value (USD Million) Trend Analysis By Market Taxonomy, 2021 to 2025
- Market Size Value (USD Million) Forecast By Market Taxonomy, 2026 to 2036
- By Country
- India
- Southeast Asia
- Vietnam
- Malaysia
- Rest of world aggregate
- By Application
- By Form
- By Material Source
- By Country
- Market Attractiveness Analysis
- By Country
- By Application
- By Form
- By Material Source
- Key Takeaways
- Key Countries Market Analysis
- United States
- Pricing Analysis
- Market Share Analysis, 2025
- By Application
- By Form
- By Material Source
- Canada
- Pricing Analysis
- Market Share Analysis, 2025
- By Application
- By Form
- By Material Source
- Germany
- Pricing Analysis
- Market Share Analysis, 2025
- By Application
- By Form
- By Material Source
- United Kingdom
- Pricing Analysis
- Market Share Analysis, 2025
- By Application
- By Form
- By Material Source
- France
- Pricing Analysis
- Market Share Analysis, 2025
- By Application
- By Form
- By Material Source
- India
- Pricing Analysis
- Market Share Analysis, 2025
- By Application
- By Form
- By Material Source
- China
- Pricing Analysis
- Market Share Analysis, 2025
- By Application
- By Form
- By Material Source
- Japan
- Pricing Analysis
- Market Share Analysis, 2025
- By Application
- By Form
- By Material Source
- Vietnam
- Pricing Analysis
- Market Share Analysis, 2025
- By Application
- By Form
- By Material Source
- Malaysia
- Pricing Analysis
- Market Share Analysis, 2025
- By Application
- By Form
- By Material Source
- United States
- Market Structure Analysis
- Competition Dashboard
- Competition Benchmarking
- Market Share Analysis of Top Players
- By Regional
- By Application
- By Form
- By Material Source
- Emerging Startups
- Innovation Benchmarking
- Competition Analysis
- Competition Deep Dive
- 5N Plus
- Overview
- Product Portfolio
- Profitability by Market Segments
- Sales Footprint
- Strategy Overview
- Marketing Strategy
- Product Strategy
- Channel Strategy
- First Solar
- Vital Materials
- Acrorad
- 5N Plus
- Case Studies
- Success Stories
- Recent Developments
- Competition Deep Dive
- Assumptions & Acronyms Used
List of Tables
- Table 1: Global Market Value (USD Million) Forecast by Region, 2021 to 2036
- Table 2: Global Market Value (USD Million) Forecast by Application, 2021 to 2036
- Table 3: Global Market Value (USD Million) Forecast by Form, 2021 to 2036
- Table 4: Global Market Value (USD Million) Forecast by Material Source, 2021 to 2036
- Table 5: North America Market Value (USD Million) Forecast by Country, 2021 to 2036
- Table 6: North America Market Value (USD Million) Forecast by Application, 2021 to 2036
- Table 7: North America Market Value (USD Million) Forecast by Form, 2021 to 2036
- Table 8: North America Market Value (USD Million) Forecast by Material Source, 2021 to 2036
- Table 9: Western Europe Market Value (USD Million) Forecast by Country, 2021 to 2036
- Table 10: Western Europe Market Value (USD Million) Forecast by Application, 2021 to 2036
- Table 11: Western Europe Market Value (USD Million) Forecast by Form, 2021 to 2036
- Table 12: Western Europe Market Value (USD Million) Forecast by Material Source, 2021 to 2036
- Table 13: East Asia Market Value (USD Million) Forecast by Country, 2021 to 2036
- Table 14: East Asia Market Value (USD Million) Forecast by Application, 2021 to 2036
- Table 15: East Asia Market Value (USD Million) Forecast by Form, 2021 to 2036
- Table 16: East Asia Market Value (USD Million) Forecast by Material Source, 2021 to 2036
- Table 17: South Asia Market Value (USD Million) Forecast by Country, 2021 to 2036
- Table 18: South Asia Market Value (USD Million) Forecast by Application, 2021 to 2036
- Table 19: South Asia Market Value (USD Million) Forecast by Form, 2021 to 2036
- Table 20: South Asia Market Value (USD Million) Forecast by Material Source, 2021 to 2036
List of Figures
- Figure 1: Global Market Pricing Analysis
- Figure 2: Global Market Value (USD Million) Forecast 2021-2036
- Figure 3: Global Market Value Share and BPS Analysis by Application, 2026 and 2036
- Figure 4: Global Market Y-o-Y Growth Comparison by Application, 2026-2036
- Figure 5: Global Market Attractiveness Analysis by Application
- Figure 6: Global Market Value Share and BPS Analysis by Form, 2026 and 2036
- Figure 7: Global Market Y-o-Y Growth Comparison by Form, 2026-2036
- Figure 8: Global Market Attractiveness Analysis by Form
- Figure 9: Global Market Value Share and BPS Analysis by Material Source, 2026 and 2036
- Figure 10: Global Market Y-o-Y Growth Comparison by Material Source, 2026-2036
- Figure 11: Global Market Attractiveness Analysis by Material Source
- Figure 12: Global Market Value (USD Million) Share and BPS Analysis by Region, 2026 and 2036
- Figure 13: Global Market Y-o-Y Growth Comparison by Region, 2026-2036
- Figure 14: Global Market Attractiveness Analysis by Region
- Figure 15: North America Market Incremental Dollar Opportunity, 2026-2036
- Figure 16: Western Europe Market Incremental Dollar Opportunity, 2026-2036
- Figure 17: East Asia Market Incremental Dollar Opportunity, 2026-2036
- Figure 18: South Asia Market Incremental Dollar Opportunity, 2026-2036
- Figure 19: North America Market Value Share and BPS Analysis by Country, 2026 and 2036
- Figure 20: North America Market Value Share and BPS Analysis by Application, 2026 and 2036
- Figure 21: North America Market Y-o-Y Growth Comparison by Application, 2026-2036
- Figure 22: North America Market Attractiveness Analysis by Application
- Figure 23: North America Market Value Share and BPS Analysis by Form, 2026 and 2036
- Figure 24: North America Market Y-o-Y Growth Comparison by Form, 2026-2036
- Figure 25: North America Market Attractiveness Analysis by Form
- Figure 26: North America Market Value Share and BPS Analysis by Material Source, 2026 and 2036
- Figure 27: North America Market Y-o-Y Growth Comparison by Material Source, 2026-2036
- Figure 28: North America Market Attractiveness Analysis by Material Source
- Figure 29: Western Europe Market Value Share and BPS Analysis by Country, 2026 and 2036
- Figure 30: Western Europe Market Value Share and BPS Analysis by Application, 2026 and 2036
- Figure 31: Western Europe Market Y-o-Y Growth Comparison by Application, 2026-2036
- Figure 32: Western Europe Market Attractiveness Analysis by Application
- Figure 33: Western Europe Market Value Share and BPS Analysis by Form, 2026 and 2036
- Figure 34: Western Europe Market Y-o-Y Growth Comparison by Form, 2026-2036
- Figure 35: Western Europe Market Attractiveness Analysis by Form
- Figure 36: Western Europe Market Value Share and BPS Analysis by Material Source, 2026 and 2036
- Figure 37: Western Europe Market Y-o-Y Growth Comparison by Material Source, 2026-2036
- Figure 38: Western Europe Market Attractiveness Analysis by Material Source
- Figure 39: East Asia Market Value Share and BPS Analysis by Country, 2026 and 2036
- Figure 40: East Asia Market Value Share and BPS Analysis by Application, 2026 and 2036
- Figure 41: East Asia Market Y-o-Y Growth Comparison by Application, 2026-2036
- Figure 42: East Asia Market Attractiveness Analysis by Application
- Figure 43: East Asia Market Value Share and BPS Analysis by Form, 2026 and 2036
- Figure 44: East Asia Market Y-o-Y Growth Comparison by Form, 2026-2036
- Figure 45: East Asia Market Attractiveness Analysis by Form
- Figure 46: East Asia Market Value Share and BPS Analysis by Material Source, 2026 and 2036
- Figure 47: East Asia Market Y-o-Y Growth Comparison by Material Source, 2026-2036
- Figure 48: East Asia Market Attractiveness Analysis by Material Source
- Figure 49: South Asia Market Value Share and BPS Analysis by Country, 2026 and 2036
- Figure 50: South Asia Market Value Share and BPS Analysis by Application, 2026 and 2036
- Figure 51: South Asia Market Y-o-Y Growth Comparison by Application, 2026-2036
- Figure 52: South Asia Market Attractiveness Analysis by Application
- Figure 53: South Asia Market Value Share and BPS Analysis by Form, 2026 and 2036
- Figure 54: South Asia Market Y-o-Y Growth Comparison by Form, 2026-2036
- Figure 55: South Asia Market Attractiveness Analysis by Form
- Figure 56: South Asia Market Value Share and BPS Analysis by Material Source, 2026 and 2036
- Figure 57: South Asia Market Y-o-Y Growth Comparison by Material Source, 2026-2036
- Figure 58: South Asia Market Attractiveness Analysis by Material Source
- Figure 59: Global Market - Tier Structure Analysis
- Figure 60: Global Market - Company Share Analysis
Frequently Asked Questions
How big is the cadmium telluride market in 2026?
FMI estimates the market at USD 70.2 million in 2026, up from USD 65.0 million in 2025. It is forecast to reach USD 138.1 million by 2036 at a 7.0% CAGR.
Which application leads the cadmium telluride market in 2026?
Thin-Film Solar Modules leads by application with 88.0% in 2026. All other segments together hold 12.0%.
Which form and material source lead in 2026?
Powder and Granules holds 45.0% by form and Virgin Compound holds 84.0% by material source in FMI's 2026 assessment.
Which market is forecast to grow fastest through 2036?
India has the highest forecast CAGR at 9.6% during 2026 to 2036, followed by China at 8.6%.
Does this market include the complete value of solar modules and CZT detectors?
No. It measures CdTe semiconductor material. Finished-module sales and complete CZT detector revenues are separate commercial categories.[2][7]
Preview the report firsthand - request a free sample
Get SampleGet the brochure for pricing and purchase details.
Get PDF
