
- Market Size (2026)
- USD 992.8 Mn
- Forecast (2036)
- USD 1541.7 Mn
- CAGR (2026 to 2036)
- 4.5%
How big is the Canes and Crutches Market in 2026?
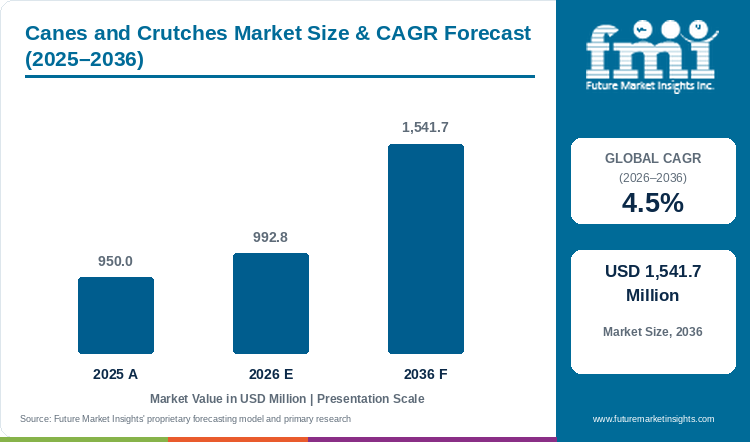
Revenue in the global canes and crutches market is forecast to rise to USD 1,541.7 million by 2036 at a CAGR of 4.5% between 2026 and 2036. The market was valued at USD 950.0 million in 2025, with USD 992.8 million estimated for 2026.
Canes and Crutches Market Size and Forecast
Table 1: Canes and Crutches Market Size and Forecast
| Market size and forecast | Value |
|---|---|
| Market size in 2025 | USD 950.0 million |
| Estimated market size in 2026 | USD 992.8 million |
| Projected market size by 2036 | USD 1,541.7 million |
| CAGR from 2026 to 2036 | 4.5% |
Source: Future Market Insights analysis of the canes and crutches market, 2026.
Retail access and public purchasing rules create different sources of demand. A standard cane sold directly to a household follows a different sales process from a reimbursed forearm crutch. Ontario explicitly includes forearm crutches in its Assistive Devices Program while excluding standard walking canes. In the United States, Medicare coverage depends on an eligible functional limitation and safe use. A written order is required before a claim is submitted. These distinctions give pharmacies and medical suppliers a continuing role even as online sales increase.
Availability also depends on a supplier's breadth. Medline unveiled a second automated storage installation at its Rialto distribution centre in May 2025. The investment served its wider medical distribution business, so a broad distributor competes differently from a specialist walking-stick manufacturer. In January 2026, Drive Medical announced an agreement to acquire Compass Health Brands. Its German business subsequently described acquisition and integration of the company, although neither source gives a completion date. FMI expects these changes to influence dealer assortment and purchasing relationships.
Key Market Trends & Insights
- Distribution changes faster than product leadership. Online revenue share rises to 32.5% in 2036 from 24.0% in 2026, overtaking retail pharmacies at 31.9% by the end of the forecast.
- Material upgrading occurs within a market still dominated by aluminium. Carbon and composite products increase from 18.0% to 22.3% of revenue between 2026 and 2036. Ossenberg's catalogue documents carbon forearm crutches alongside its conventional walking-aid ranges.
- Institutional reuse limits the relationship between patient activity and new-device sales. A February 2026 service at Leighton Hospital accepts elbow crutches and walking sticks for assessment, cleaning and refurbishment.
Regional Highlights
- The weight of China and India in global revenue increases. Projected 2036 shares are China 7.2% (from 6.0%) and India 3.8% (from 3.0%).
- Global share declines for Germany, Japan and the United Kingdom even as revenue grows. FMI projects Germany slipping from 8.0% to 7.6%, Japan slipping from 7.0% to 6.6% and the United Kingdom slipping from 6.0% to 5.7% over 2026 to 2036.
Analyst Perspective
“Distribution will change more sharply than the basic product mix. Online sellers are projected to overtake pharmacies by revenue share in 2036, but funded supply still depends on the rules for a particular device and patient. Suppliers should distinguish their ordinary retail offer from their reimbursed or institutional range. Carbon products have room to increase value, provided their weight, grip and adjustment advantages are documented for the intended user. A premium material description alone is a weak basis for switching an established rehabilitation purchase.”
- Anurag Sharma, Principal Consultant, FMI
How is the Canes and Crutches Market segmented?
- By product: Canes, Forearm crutches, and Underarm crutches.
- By material: Aluminium, Wood, and Carbon and composite.
- By distribution: Retail pharmacies, Online, Hospitals and clinics, and Medical supply stores.
- By region: North America, Europe, East Asia, South Asia and Pacific, and Rest of world.
Why does the Canes segment lead by Product in the Canes and Crutches Market in 2026?
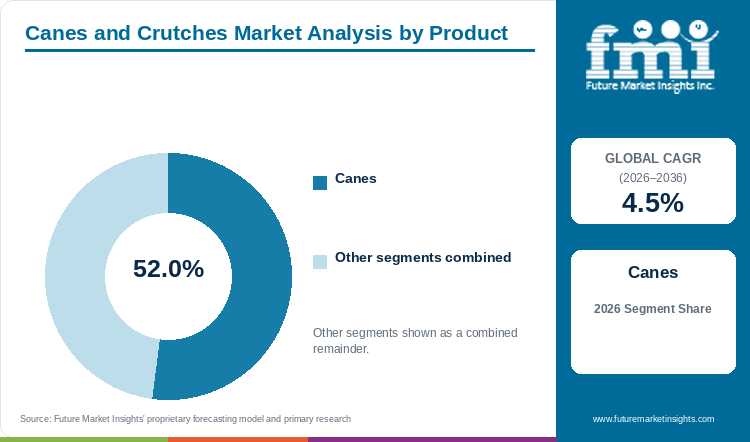
The Canes segment holds 52.0% of the Canes and Crutches Market by product in 2026.
The cane business covers a wider retail assortment than a single clinical specification. Drive's direct catalogue separates folding, offset, quad and T-handle canes. That variety creates different stocking decisions from those for an underarm crutch supplied in standard size bands. A retailer can carry a compact folding option and a larger-base support as separate stock lines.
FMI forecasts cane revenue of USD 516.2 million in 2026 and USD 772.8 million in 2036. Forearm crutches grow faster at 5.1% CAGR, compared with 4.1% for canes. The cane share eases from 52.0% to 50.1% and the segment keeps its lead. Forearm-crutch revenue reaches USD 441.5 million in 2036, with underarm crutches at USD 327.4 million.
Product selection remains bounded by the assessment of an individual's mobility. Suppliers seeking higher value in canes need a clear assortment strategy around grip, base and portability. They also need to identify when the appropriate sale belongs in another product category.
Forearm crutches and Underarm crutches together hold the remaining 48.0% by product.
Table 2: Product, 2026 Share
| Leading Share | 2026 market share |
|---|---|
| Canes | 52.0% |
| All Other Segments Combined Share | 48.0% |
Source: Future Market Insights analysis of the canes and crutches market, 2026.
Why does the Aluminium segment lead by Material in the Canes and Crutches Market in 2026?
The Aluminium segment holds 68.0% of the Canes and Crutches Market by material in 2026.
Aluminium spans ordinary canes and crutches, giving it exposure to both household purchases and institutional orders. Medline lists aluminium forearm crutches and an aluminium quad cane in its consumer range. The two products share a material and differ in specification. A common material lets a supplier assemble a broad mobility assortment across price points.
FMI estimates aluminium revenue at USD 675.1 million in 2026 and USD 1,024.4 million in 2036. Its share eases to 66.4% as carbon and composite products reach USD 343.5 million. Wood grows more slowly, with revenue increasing from USD 139.0 million to USD 173.8 million. The forecast therefore combines a large conventional-material base with a smaller upgrading opportunity.
Premium materials support a differentiated range for a specialist supplier. The relevant comparison concerns the complete device and its documented limits. Purchasers need to compare the weight of equivalent products, the available sizes and the replacement components. FMI expects premium material suppliers to gain selectively where those differences are material to a continuing user's choice.
Wood and Carbon and composite together hold the remaining 32.0% by material.
Table 3: Material, 2026 Share
| Leading Share | 2026 market share |
|---|---|
| Aluminium | 68.0% |
| All Other Segments Combined Share | 32.0% |
Source: Future Market Insights analysis of the canes and crutches market, 2026.
Why does the Retail pharmacies segment lead by Distribution in the Canes and Crutches Market in 2026?
The Retail pharmacies segment holds 36.0% of the Canes and Crutches Market by distribution in 2026.
The pharmacy lead sits within a divided market. Retail pharmacies generate USD 357.4 million in 2026, followed by online sales at USD 238.3 million. Hospitals and clinics account for USD 218.4 million, with medical supply stores at USD 178.7 million. These channels differ in the transaction they manage. A retail purchase can be immediate, while an institutional issue may form part of a planned discharge or rehabilitation service.
Consumer-facing manufacturer sites already sell canes and crutches directly, with distinct product categories and access to replacement accessories. FMI forecasts online revenue growth at 7.7% CAGR to USD 501.3 million in 2036. Pharmacy revenue reaches USD 491.3 million at 3.2% CAGR.
Local retail retains a role in checking the physical product before purchase. A routine replacement can move to another channel. A returning buyer who knows the model has a different transaction from a first-time customer selecting a new aid. Clear product identifiers and selling quantities become valuable online. The broader homecare medical devices market provides context for this separation between household retail and clinically organised supply.
Online, Hospitals and clinics and Medical supply stores together hold the remaining 64.0% by distribution.
Table 4: Distribution, 2026 Share
| Leading Share | 2026 market share |
|---|---|
| Retail pharmacies | 36.0% |
| All Other Segments Combined Share | 64.0% |
Source: Future Market Insights analysis of the canes and crutches market, 2026.
What are the key drivers restraints and opportunities?
Demand grows through a combination of rehabilitation access, replacement purchases and wider retail distribution. Public funding conditions and reuse constrain new-device sales. Specialist materials and clearer online assortments offer additional value.
Driver
Organised access to walking supports brings eligible users into funded and retail purchasing channels.
Restraint
Reissued equipment and tightly defined reimbursement can reduce the number of new devices bought for a given level of patient need.
Opportunity
Suppliers can develop distinct conventional and specialist ranges while making model selection and replacement purchasing clearer online.
How do purchasing rules and qualification affect canes and crutches market demand?
Sales depend on access as well as need. WHO identifies cost, procurement and workforce limitations among the barriers to assistive technology access. For canes and crutches, the commercial issue is whether a person reaches a channel that can supply the appropriate product. Public provision, a pharmacy purchase and a direct online order may each produce a device sale, but the payment and selection process differs.
This is why distribution deserves as much attention as the overall growth rate. India and China have the fastest country CAGRs in this outlook, while the United States remains the largest revenue market. The former markets offer expansion from a smaller revenue base. The latter supports established purchasing routes with more limited share movement. Suppliers should plan stock and local partnerships around those distinct commercial conditions. Walkers and rollators sold through the same retail routes are covered in FMI's walking aid market.
What limits reliable canes and crutches market supply and quality?
Institutional reuse lets one device serve several patients over time. The effect depends on the proportion returned, the products accepted and the cost of refurbishment. Manufacturers serving such buyers have a reason to consider replaceable wear parts and a stable product range.
Funding restrictions present a separate constraint. In Canada, the Ontario programme distinguishes eligible forearm crutches from ordinary canes. A low product price leaves the transaction barrier in place where assessment, travel or delivery is also required. FMI expects price-sensitive purchasing to remain important across conventional products, even while specialist materials raise the value of selected sales.
Where can suppliers win additional business in the canes and crutches market?
Online growth and carbon-material expansion are separate opportunities. One changes where the sale occurs, while the other changes what is sold. An aluminium replacement cane can be an effective online product when its specification is clear. A specialist carbon crutch may require more detailed selection and support.
The forecast points to room for both. Aluminium still accounts for 66.4% of 2036 revenue, while online reaches 32.5% of channel revenue. A supplier's advantage will depend on matching its range to the customer and payment route. The eldercare mobility device market is relevant to wider household mobility needs, although its additional products are excluded from this assessment.
Canes and Crutches Market by Country (2026 to 2036)
Table 5: Canes and Crutches Market Country Growth Forecast
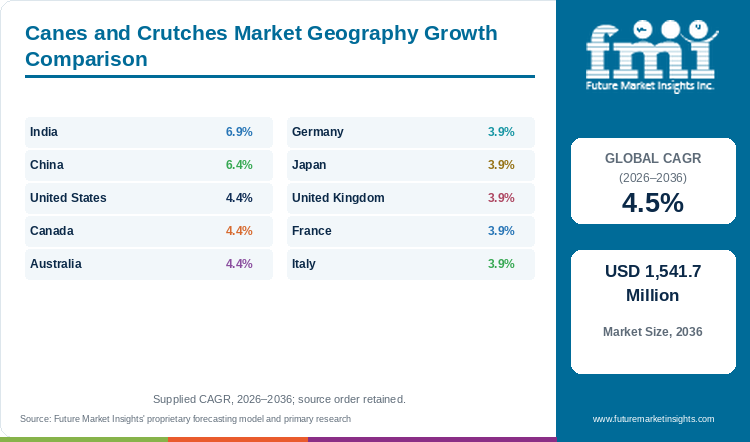
| Country | CAGR, 2026 to 2036 |
|---|---|
| India | 6.9% |
| China | 6.4% |
| United States | 4.4% |
| Canada | 4.4% |
| Australia | 4.4% |
| Germany | 3.9% |
| Japan | 3.9% |
| United Kingdom | 3.9% |
| France | 3.9% |
| Italy | 3.9% |
Source: Future Market Insights analysis of the canes and crutches market, 2026.
India
Public assisted-living distribution is a distinct source of Indian demand. The government's October 2025 senior-citizen briefing identifies walking sticks and elbow crutches within Rashtriya Vayoshri Yojana. The programme supplies eligible low-income older people with assisted-living devices through an organised provision route. This creates a different commercial setting from a household visiting a pharmacy after an injury.
India has the highest named-country growth rate in this assessment. FMI forecasts revenue of USD 29.8 million in 2026 and USD 58.2 million in 2036, with a 6.9% CAGR over 2026 to 2036. The country starts at the same rounded revenue value as Australia but generates a larger increase during the period. Its global revenue share reaches 3.8% in 2036. In the canes and crutches market, India adds USD 28.4 million, ranking fifth for increase.
The supplier opportunity involves affordable standard devices and dependable delivery through the relevant channel. Public provision and private retail can require different pack configurations and ordering arrangements. FMI expects distributors to benefit from keeping public provision and private retail offers separate. A broad mobility catalogue can support relationships with rehabilitation sellers, and adjacent wheelchair products sit outside cane revenue. The commercial priority is to convert access into an appropriate supplied product. Wider availability needs to be accompanied by a range that is understandable to the purchaser and suitable for the intended use.
China
The expansion of China's age-friendly product assortment creates a supply-side opportunity and a selection problem. In May 2025, the State Administration for Market Regulation reported 6,000 new walking-assistance product varieties during the first four months of the year. Its category included canes, wheelchairs and mobility scooters. The figure measures new varieties across that wider group.
Against that backdrop, FMI forecasts Chinese canes and crutches revenue of USD 59.6 million in 2026 and USD 111.1 million in 2036. The 6.4% CAGR over 2026 to 2036 sits above the global rate. China's revenue share rises from 6.0% to 7.2%. This makes the country important to incremental revenue even though its starting value is substantially below that of the United States. China records a USD 51.5 million increase, second of the ten. On 2026 revenue, China stands joint fourth in the ten-country set.
The commercial task for distributors is to make an expanding assortment usable. More product variants can increase choice while also making equivalent offers harder to compare. FMI sees an advantage in a concise range organised by product, material and intended user requirements. That is particularly relevant when the same seller offers both ordinary aluminium devices and specialist composites. The stronger growth outlook supports investment in comparable offers and reliable ordering. Distributors gain when a wider range remains straightforward to purchase.
United States
Reimbursed supply in the United States begins with a functional requirement and not with the customer's age. Medicare's Canes and Crutches policy covers specified products when a mobility limitation affects daily activities in the home. It also requires safe use and sufficient resolution of that deficit. A standard written order must reach the supplier before the claim is submitted. Those conditions make the documentation process commercially relevant to a supplier serving covered purchases.
FMI projects US revenue to rise from USD 297.8 million in 2026 to USD 459.8 million in 2036 at a 4.4% CAGR. The country represents 30.0% of global revenue in 2026. A reimbursed order has a different administrative burden from a direct replacement purchase. In the canes and crutches market, the United States grows 4.4% a year, 0.1 points below the global rate.
For manufacturers, a broad catalogue needs a clear separation between standard cane models and crutches with distinct sizes or weight limits. The US opportunity is therefore partly an assortment and fulfilment business. Suppliers can improve their offer by keeping the same model identifiers across ordering, packaging and replacement components. That reduces ambiguity when an existing user buys again through a different channel. The commercial risk is unnecessary complexity in a relatively low-value sale. Retail pharmacies and medical suppliers can add value by confirming that the product supplied matches the one named on the order.
Canada
Canada demonstrates why product-level coverage must be examined before describing a country as a single funded mobility market. Ontario's Assistive Devices Program includes forearm crutches for qualifying residents who need a mobility aid for six months or longer. It excludes standard walking canes and most equipment rental. The programme normally covers 75.0% of the approved cost, with the balance paid by the applicant unless additional assistance applies.
The national canes and crutches outlook rises from USD 39.7 million in 2026 to USD 61.3 million in 2036. FMI projects a 4.4% CAGR during 2026 to 2036. These national figures cover more than Ontario and include transactions outside its programme. A 4.4% CAGR leaves Canada 0.1 points below the 4.5% global pace.
For a Canadian distributor, the same customer-facing category can therefore contain different commercial routes. A qualifying forearm-crutch order may need assessment and an approved vendor. A standard cane can remain a direct purchase. FMI expects this distinction to preserve a role for both specialist supply and ordinary retail. Manufacturers should avoid a single price proposition for the whole category. The relevant offer depends on the device and purchasing pathway. A household replacing a familiar cane may value a readily identifiable model, while a funded transaction needs the correct process before purchase. National market entry should account for provincial differences, since Ontario's rules do not extend to all Canadian buyers.
Australia
Australian disability funding distinguishes low-cost assistive technology from more expensive equipment. The NDIS page current to August 2026 defines low-cost items as below AUD 1,500.0 and lists walking sticks or canes among its examples. It still requires an item to relate to the participant's disability and satisfy the scheme's funding rules. A low price therefore simplifies part of the purchase process, and eligibility still depends on the participant's circumstances.
Australian canes and crutches revenue is projected at USD 29.8 million in 2026 and USD 46.0 million in 2036. FMI forecasts a 4.4% CAGR from 2026 to 2036. The country's global revenue share remains close to 3.0%. The outlook supports a mix of routine retail supply and purchases made within an individual support arrangement.
For sellers, clear product information is important because low-cost products may be bought through stores or online. A buyer needs to understand what is included and whether the specification matches the intended requirement. FMI sees a commercial opportunity in making ordinary devices easier to select and reorder. This differs from treating the funding threshold as a target selling price. A support costing far below that threshold still needs an appropriate description and a reliable supply route. Imported and locally distributed ranges compete on that practical transaction. Suppliers should also keep disability funding distinct from temporary rehabilitation or other payment arrangements that may bring a person to the same product.
Germany
Germany's walking-aid classification separates hand and walking sticks, forearm crutches and axillary supports. The GKV product-group document also sets out product and service requirements within the assistive-device system. This gives suppliers a defined route for comparing their offer with a reimbursement category. A generic claim that a device is a mobility aid is less useful than a precise match between its intended use and the relevant product group.
Within that structure, FMI expects Germany's canes and crutches revenue to increase from USD 79.4 million in 2026 to USD 116.9 million in 2036. The forecast CAGR is 3.9% from 2026 to 2036. Germany is the second-largest named country by revenue in this assessment. Its value opportunity also depends on the mix of established products and more specialised configurations. Germany moves from 8.0% of global revenue in 2026 to 7.6% in 2036.
One specialist range offers several aluminium walking-stick grip configurations. This supports a commercial distinction between a broad medical distributor and a company concentrating on walking supports. FMI sees room for specialist suppliers where the difference is concrete and visible in a product comparison. Buyers comparing alternatives need the complete device description. The intended use sets requirements that a material designation does not cover. In a reimbursement setting, a precise description also helps a supplier show which product group applies to each configuration.
Japan
Japan's long-term care framework makes the choice between rental and purchase relevant to some walking supports. A Ministry of Health, Labour and Welfare briefing describes the option for eligible walking aids while explicitly excluding crutches from that particular rental-or-purchase choice. It prevents a supplier from assuming that one funding arrangement applies to every item sold under an English-language cane and crutch heading.
Japanese revenue is forecast to move from USD 69.5 million in 2026 to USD 102.3 million in 2036, giving a 3.9% CAGR across 2026 to 2036. FMI assigns Japan a 7.0% revenue share in 2026. That sizeable base supports a continuing market even with growth below the global rate. The commercial assessment should keep product eligibility, provider service and household purchasing separate. Japan's growth is 0.6 percentage points below the 4.5% global CAGR. Japan's share of the world total stands at 7.0% in 2026 and 6.6% in 2036.
Rental and outright purchase also produce different supplier requirements. A rental provider has an interest in repeated issue and maintenance. A household purchasing a support for continued use evaluates the complete product it will retain. FMI's interpretation is that a manufacturer benefits from explaining which replacement components remain available and how its range is organised. Sales teams need local product-category knowledge before translating a global catalogue into a Japanese offer.
United Kingdom
Equipment reuse is a visible commercial consideration in British institutional supply. Mid Cheshire Hospitals opened a service in February 2026 accepting walking sticks and elbow crutches at Leighton Hospital. Returned items are assessed and then cleaned and refurbished when suitable for reissue. This is evidence from one provider. It shows how an institution can support additional users with fewer replacement purchases.
The UK market is projected at USD 59.6 million in 2026 and USD 87.6 million in 2036. FMI forecasts a 3.9% CAGR over 2026 to 2036. A product may remain in circulation across more than one care episode. Revenue adds USD 28.0 million across the decade, and its global revenue share eases to 5.7% from 6.0%. In the canes and crutches market, the United Kingdom grows 3.9% a year, 0.6 points below the global rate.
For a manufacturer selling into a reuse programme, the design of wear components and the clarity of the product identification can affect commercial appeal. An institution needs to decide whether returned equipment can be safely issued again. A fragmented range with unclear replacement parts creates a different operating burden from a stable assortment. Consumer purchasing remains a separate opportunity, particularly when the user wants an alternative configuration. FMI therefore sees the UK market as a combination of institutional replacement and household choice. The relative weight of those routes differs by customer.
France
France offers a more visible administrative record of reimbursed device spending than a simple retail total. Assurance Maladie includes canes among the products within its LPP medical-device information. Its public series covers reimbursed expenditure and beneficiaries, with 2025 expenditure files listed in September 2026. These are reimbursement records.
FMI estimates French revenue at USD 59.6 million in 2026, increasing to USD 87.6 million in 2036. The country's projected CAGR is 3.9% from 2026 to 2036. A stable national growth rate still leaves room for differences between funded devices, direct retail replacements and products carrying a higher customer payment. The relevant commercial question concerns which purchasing route a supplier is actually serving. Revenue in France climbs by USD 28.0 million, joint sixth among the ten. France's share of global revenue eases from 6.0% to 5.7%.
Invacare's European documentation includes both canes and several crutch families, with a French country selection. This gives distributors access to a defined product-support route. For distributors, maintaining the connection between the product reference and its local documentation matters when a customer replaces an existing model. FMI expects a clear catalogue to remain useful as online purchasing develops. Product descriptions should distinguish a walking cane from a crutch and identify the supplied quantity. Repeatable replacement sales can sit alongside higher-value specialist offers, giving distributors more than one way to develop an established customer relationship.
Italy
Italian institutional access is organised through a national assistive-device framework and local delivery arrangements. The Alessandria health authority describes direct supply or provision through contracted centres under the national nomenclature and regional rules. Its listed equipment includes crutches. This local description is useful evidence of a service route.
FMI forecasts Italian revenue to increase from USD 39.7 million in 2026 to USD 58.4 million in 2036. Growth is projected at 3.9% CAGR over 2026 to 2036. The national market retains a 3.8% global revenue share at the end of the period. For a supplier, that supports a continuing conventional-device business alongside selective demand for more specialised options. The USD 18.7 million rise over the decade ranks Italy ninth for increase. In the canes and crutches market, Italy ranks joint seventh of ten on 2026 revenue. Italy's 3.9% CAGR trails the 4.5% global rate by 0.6 percentage points.
Institutional buyers may require a defined product within a service arrangement, while a household may be replacing a support it already knows. FMI's commercial reading is that local relationships can be as important as an extensive global catalogue. A company selling through contracted centres needs to understand the specific purchasing route. A retailer has to make the product comparison accessible at the point of sale. Both routes benefit from a stable set of references, but their administrative and customer-support requirements differ.
Who are the notable companies in the Canes and Crutches Market?
Notable companies in the Canes and Crutches Market include Medline Industries, Drive DeVilbiss Healthcare, operating under the Drive Medical brand, Invacare, Compass Health Brands and Ossenberg.
Competition combines broad medical supply with narrower product specialisation. Medline's consumer range includes conventional canes and forearm crutches. Drive Medical offers a cane and crutch assortment within a larger durable medical equipment portfolio. Invacare maintains European documentation for several cane and crutch families. Ossenberg concentrates more visibly on walking supports and their configurations.
The company boundary also matters. Drive's January 2026 Compass announcement named Carex and ProBasics among the brands involved. Its German release later described the acquisition and integration. Compass should therefore be evaluated with that relationship in mind, and not treated as a fully independent rival in every comparison.
Ottobock's disclosed core activities concern prosthetics, neuro-orthotics and patient care. Karma's public catalogue is strongly centred on wheelchairs and related mobility products. Both companies participate in the wider rehabilitation chain, where a care provider or mobility supplier may serve different stages of a person's needs. Their activities are distinct from a conventional cane assortment. The wider wheelchairs market is commercially adjacent and remains outside the product values in this report.
Key Developments in the Canes and Crutches Market
- In January 2026, Drive Medical announced a definitive agreement to acquire Compass Health Brands. The later German corporate communication described the acquisition and integration. The development changes the relationship between broad DME supply and Carex and ProBasics consumer medical brands.
Key Players in the Canes and Crutches Market
- Medline Industries
- Drive DeVilbiss Healthcare, operating under the Drive Medical brand
- Invacare
- Compass Health Brands
- Ossenberg
- Ottobock
- Karma Healthcare
Canes and Crutches Market Report Scope
Table 6: Canes and Crutches Market Report Scope
| Coverage field | Report scope |
|---|---|
| Market definition | Walking canes plus forearm and underarm crutches sold for mobility support and rehabilitation |
| Product coverage | Canes, forearm crutches and underarm crutches |
| Material coverage | Aluminium, wood, and carbon and composite categories. Plastic components are included within complete devices |
| Distribution | Retail pharmacies, online, hospitals and clinics, and medical supply stores |
| Revenue unit | USD million |
| Volume basis | Million device units. Not unique users or rehabilitation episodes |
| Named countries | United States, Germany, Japan, United Kingdom, France, China, Italy, Canada, Australia and India |
| Additional coverage | Rest of world aggregate |
| Boundaries | Excludes walker and wheelchair sales, rehabilitation services and unrelated mobility equipment |
| Quantitative Units | USD million |
Source: Future Market Insights analysis of the canes and crutches market, 2026.
Canes and Crutches Market Research Methodology
The assessment combines FMI's canes and crutches outlook with secondary review of original government coverage information, health-service notices and manufacturer documentation. Revenue, volume and category relationships were checked for consistent units and forecast periods. Country discussion examines the local purchasing mechanism without presenting programme statistics as total market sales. Competitive analysis separates documented direct products from adjacent rehabilitation activities and distinguishes announced transaction terms from later company descriptions.
Canes and Crutches Market by Segments
Canes and Crutches Market segmented by Product:
- Canes
- Forearm crutches
- Underarm crutches
Canes and Crutches Market segmented by Material:
- Aluminium
- Wood
- Carbon and composite
Canes and Crutches Market segmented by Distribution:
- Retail pharmacies
- Online
- Hospitals and clinics
- Medical supply stores
Canes and Crutches Market by Region
- North America
- United States
- Canada
- Europe
- Germany
- United Kingdom
- France
- Italy
- East Asia
- Japan
- China
- South Asia and Pacific
- India
- Australia
- Rest of world aggregate outside the ten named countries
Research Sources and Bibliography
- Assurance Maladie. (2025, November 24, series listings updated 2026). Dispositifs médicaux inscrits à la liste des produits et prestations (LPP). https://www.assurance-maladie.ameli.fr/etudes-et-donnees/par-theme/medicaments-et-dispositifs-medicaux/dispositifs-medicaux-lpp
- Azienda Sanitaria Locale Alessandria. (Accessed November 9, 2026). Assistenza protesica e integrativa. https://http.aslal.it/assistenza-integrativa-e-protesica-5580
- Centers for Medicare & Medicaid Services. (2020, January 1, current revision accessed November 9, 2026). Canes and Crutches, Local Coverage Determination L33733. https://www.cms.gov/medicare-coverage-database/view/lcd.aspx?lcdid=33733
- Drive Medical. (2025, December 1). Drive DeVilbiss Healthcare Returns to Drive Medical Brand. https://www.drivemedical.com/blog/drive-medical-rebranding?hs_amp=true
- Drive Medical. (2026, January 29). Drive Medical Acquires Compass Health Brands. https://www.drivemedical.com/news-article/drive-medical-acquires-compass-health-brands
- Drive Medical at Home. (Accessed November 9, 2026). Canes and Crutches for Balance Support. https://drivemedicalathome.com/collections/canes-crutches
- Drive Medical Germany. (Accessed 2026, November 9). Press Release: Drive Medical Acquires Compass Health Brands. https://drivemedical.de/en/news-artikel/2026/press/pm_compass_health
- GKV-Spitzenverband. (2022, December 9, accessed November 9, 2026). Fortschreibung der Produktgruppe 10 Gehhilfen. https://www.gkv-spitzenverband.de/media/dokumente/krankenversicherung_1/hilfsmittel/fortschreibungen_aktuell/12_2022/20221209_Fortschreibung_Produktgruppe_10_Gehhilfen.pdf
- Government of Ontario. (2025, July 10). Mobility aids. Assistive Devices Program eligibility, covered products and purchasing process. https://www.ontario.ca/page/mobility-aids
- Invacare International GmbH. (Accessed November 9, 2026). Canes and crutches. European Resource Center. https://invacaredocs.com/eu-en/3301_EU/
- Karma Healthcare, Karma Medical India. (Accessed November 9, 2026). Corporate product categories and Indian branch network. https://www.karmamedical.com/en-in/
- Medline at Home. (Accessed November 9, 2026). Canes & Crutches. Manufacturer consumer product assortment. https://athome.medline.com/en/categories/mobility/canes-crutches
- Medline Newsroom. (2025, May 9). Medline opens the curtains on second AutoStore addition in Rialto, Calif. https://newsroom.medline.com/supply-chain/medline-second-autostore-rialto/
- Ministry of Health, Labour and Welfare, Japan. (2025, November 13). Overview of welfare equipment and home modifications. Second evaluation meeting, Reference 2. https://www.mhlw.go.jp/content/12300000/001594788.pdf
- National Disability Insurance Agency, Australia. (2026, August 31). What is low-cost assistive technology. https://www.ndis.gov.au/participants/assistive-technology/types-assistive-technology/what-low-cost-assistive-technology
- NHS Cheshire and Merseyside. (2026, February 4). Hospital launches walking aid reuse service to support patient care and cut waste. https://www.cheshireandmerseyside.nhs.uk/your-locality/cheshire-east/cheshire-east-news/hospital-launches-walking-aid-reuse-service-to-support-patient-care-and-cut-waste
- Ossenberg GmbH. (2024). Katalog Ossenberg 2024. Carbon forearm-crutch configurations and product assortment. https://bilder.ossenberg.com/e-Paper/epaper-Katalog_Ossenberg_2024/index.html
- Ossenberg GmbH. (Accessed November 9, 2026). Leichtmetallstöcke. Manufacturer aluminium walking-stick assortment. https://shop.ossenberg.com/Produkt-Kategorie/gehst%C3%B6cke/leichtmetallstoecke/
- Ottobock. (2026, March 19). Ottobock publishes Annual Report 2025. https://corporate.ottobock.com/en/media/newsroom/ottobock-publishes-annual-report-for-2025
- Press Information Bureau, Government of India. (2025, October 28). Older persons in India: population, challenges and government initiatives. Hindi briefing. https://static.pib.gov.in/WriteReadData/specificdocs/documents/2025/oct/doc20251028678701.pdf
- State Administration for Market Regulation, China. (2025, May 26). Silver market drives rapid growth of age-friendly products: 28,700 new varieties in January to April. Original Chinese notice. https://www.samr.gov.cn/xw/zj/art/2025/art_abc34293ddcc48d581ccd00b413df0ce.html
- World Health Organization. (2024, January 2). Assistive technology. https://www.who.int/news-room/fact-sheets/detail/assistive-technology
This bibliography is provided for reader reference and is not exhaustive. The full report contains the complete reference list and detailed citations.
Table of Content
- Key Takeaways
- Market Size and CAGR
- Top Growth Driver
- Fastest Growing Segment
- Leading Region
- Key Companies
- Emerging Opportunities
- Executive Summary
- Global Market Outlook
- Demand-side Trends
- Supply-side Trends
- Technology Roadmap Analysis
- Analysis and Recommendations
- Analyst Perspective (What is happening? Why now? What should investors know?)
- Key Questions Answered
- How large is the market?
- What is the CAGR?
- What are key trends?
- Which region dominates?
- Who are the leaders?
Read More...
- Market Overview
- Market Coverage / Taxonomy
- Market Definition / Scope / Limitations
- Research Methodology
- Chapter Orientation
- Analytical Lens and Working Hypotheses
- Market Structure, Signals, and Trend Drivers
- Benchmarking and Cross-market Comparability
- Market Sizing, Forecasting, and Opportunity Mapping
- Research Design and Evidence Framework
- Desk Research Programme (Secondary Evidence)
- Expert Input and Fieldwork (Primary Evidence)
- Tooling, Models, and Reference Databases
- Data Engineering and Model Build
- Quality Assurance and Audit Trail
- Market Background
- Market Dynamics (Drivers, Restraints, Opportunity, Trends)
- Scenario Forecast (Optimistic, Likely, Conservative)
- Impact Analysis
- AI Impact
- Sustainability Impact
- Regulatory Impact
- Technology Impact
- Consumer / Buyer Analysis
- Purchase Drivers
- Adoption Barriers
- Buyer Journey
- Opportunity Map Analysis
- Product Life Cycle Analysis
- Supply Chain Analysis
- Investment Feasibility Matrix
- Value Chain Analysis
- PESTLE and Porter's Analysis
- Regulatory Landscape
- Regional Parent Market Outlook
- Production and Consumption Statistics
- Import and Export Statistics
- Global Market Analysis and Forecast, 2021 to 2036
- Historical Market Size Value (USD Million) Analysis, 2021 to 2025
- Current and Future Market Size Value (USD Million) Projections, 2026 to 2036
- Y-o-Y Growth Trend Analysis
- Absolute $ Opportunity Analysis
- Global Market Pricing Analysis, 2021 to 2036
- Global Market Analysis and Forecast, By Product, 2021 to 2036
- Introduction / Key Findings
- Historical Market Size Value (USD Million) Analysis By Product, 2021 to 2025
- Current and Future Market Size Value (USD Million) Analysis and Forecast By Product, 2026 to 2036
- Canes
- Forearm crutches
- Underarm crutches
- Y-o-Y Growth Trend Analysis By Product, 2021 to 2025
- Absolute $ Opportunity Analysis By Product, 2026 to 2036
- Global Market Analysis and Forecast, By Material, 2021 to 2036
- Introduction / Key Findings
- Historical Market Size Value (USD Million) Analysis By Material, 2021 to 2025
- Current and Future Market Size Value (USD Million) Analysis and Forecast By Material, 2026 to 2036
- Aluminium
- Wood
- Carbon and composite
- Y-o-Y Growth Trend Analysis By Material, 2021 to 2025
- Absolute $ Opportunity Analysis By Material, 2026 to 2036
- Global Market Analysis and Forecast, By Distribution, 2021 to 2036
- Introduction / Key Findings
- Historical Market Size Value (USD Million) Analysis By Distribution, 2021 to 2025
- Current and Future Market Size Value (USD Million) Analysis and Forecast By Distribution, 2026 to 2036
- Retail pharmacies
- Online
- Hospitals and clinics
- Medical supply stores
- Y-o-Y Growth Trend Analysis By Distribution, 2021 to 2025
- Absolute $ Opportunity Analysis By Distribution, 2026 to 2036
- Global Market Analysis and Forecast, By Region, 2021 to 2036
- Introduction
- Historical Market Size Value (USD Million) Analysis By Region, 2021 to 2025
- Current Market Size Value (USD Million) Analysis and Forecast By Region, 2026 to 2036
- North America
- Europe
- East Asia
- South Asia and Pacific
- Market Attractiveness Analysis By Region
- North America Market Analysis and Forecast, By Country, 2021 to 2036
- Historical Market Size Value (USD Million) Trend Analysis By Market Taxonomy, 2021 to 2025
- Market Size Value (USD Million) Forecast By Market Taxonomy, 2026 to 2036
- By Country
- United States
- Canada
- By Product
- By Material
- By Distribution
- By Country
- Market Attractiveness Analysis
- By Country
- By Product
- By Material
- By Distribution
- Key Takeaways
- Europe Market Analysis and Forecast, By Country
- Historical Market Size Value (USD Million) Trend Analysis By Market Taxonomy, 2021 to 2025
- Market Size Value (USD Million) Forecast By Market Taxonomy, 2026 to 2036
- By Country
- Germany
- United Kingdom
- France
- Italy
- By Product
- By Material
- By Distribution
- By Country
- Market Attractiveness Analysis
- By Country
- By Product
- By Material
- By Distribution
- Key Takeaways
- East Asia Market Analysis and Forecast, By Country
- Historical Market Size Value (USD Million) Trend Analysis By Market Taxonomy, 2021 to 2025
- Market Size Value (USD Million) Forecast By Market Taxonomy, 2026 to 2036
- By Country
- Japan
- China
- By Product
- By Material
- By Distribution
- By Country
- Market Attractiveness Analysis
- By Country
- By Product
- By Material
- By Distribution
- Key Takeaways
- South Asia and Pacific Market Analysis and Forecast, By Country
- Historical Market Size Value (USD Million) Trend Analysis By Market Taxonomy, 2021 to 2025
- Market Size Value (USD Million) Forecast By Market Taxonomy, 2026 to 2036
- By Country
- India
- Australia
- Rest of world aggregate outside the ten named countries
- By Product
- By Material
- By Distribution
- By Country
- Market Attractiveness Analysis
- By Country
- By Product
- By Material
- By Distribution
- Key Takeaways
- Key Countries Market Analysis
- United States
- Pricing Analysis
- Market Share Analysis, 2025
- By Product
- By Material
- By Distribution
- Canada
- Pricing Analysis
- Market Share Analysis, 2025
- By Product
- By Material
- By Distribution
- Germany
- Pricing Analysis
- Market Share Analysis, 2025
- By Product
- By Material
- By Distribution
- United Kingdom
- Pricing Analysis
- Market Share Analysis, 2025
- By Product
- By Material
- By Distribution
- Italy
- Pricing Analysis
- Market Share Analysis, 2025
- By Product
- By Material
- By Distribution
- France
- Pricing Analysis
- Market Share Analysis, 2025
- By Product
- By Material
- By Distribution
- India
- Pricing Analysis
- Market Share Analysis, 2025
- By Product
- By Material
- By Distribution
- China
- Pricing Analysis
- Market Share Analysis, 2025
- By Product
- By Material
- By Distribution
- Japan
- Pricing Analysis
- Market Share Analysis, 2025
- By Product
- By Material
- By Distribution
- Australia
- Pricing Analysis
- Market Share Analysis, 2025
- By Product
- By Material
- By Distribution
- United States
- Market Structure Analysis
- Competition Dashboard
- Competition Benchmarking
- Market Share Analysis of Top Players
- By Regional
- By Product
- By Material
- By Distribution
- Emerging Startups
- Innovation Benchmarking
- Competition Analysis
- Competition Deep Dive
- Medline Industries
- Overview
- Product Portfolio
- Profitability by Market Segments
- Sales Footprint
- Strategy Overview
- Marketing Strategy
- Product Strategy
- Channel Strategy
- Drive DeVilbiss Healthcare, now Drive Medical
- Invacare
- Ossenberg
- Compass Health Brands
- Ottobock
- Karma Healthcare
- Drive DeVilbiss Healthcare, operating under the Drive Medical brand
- Medline Industries
- Case Studies
- Success Stories
- Recent Developments
- Competition Deep Dive
- Assumptions & Acronyms Used
List of Tables
- Table 1: Global Market Value (USD Million) Forecast by Region, 2021 to 2036
- Table 2: Global Market Value (USD Million) Forecast by Product, 2021 to 2036
- Table 3: Global Market Value (USD Million) Forecast by Material, 2021 to 2036
- Table 4: Global Market Value (USD Million) Forecast by Distribution, 2021 to 2036
- Table 5: North America Market Value (USD Million) Forecast by Country, 2021 to 2036
- Table 6: North America Market Value (USD Million) Forecast by Product, 2021 to 2036
- Table 7: North America Market Value (USD Million) Forecast by Material, 2021 to 2036
- Table 8: North America Market Value (USD Million) Forecast by Distribution, 2021 to 2036
- Table 9: Europe Market Value (USD Million) Forecast by Country, 2021 to 2036
- Table 10: Europe Market Value (USD Million) Forecast by Product, 2021 to 2036
- Table 11: Europe Market Value (USD Million) Forecast by Material, 2021 to 2036
- Table 12: Europe Market Value (USD Million) Forecast by Distribution, 2021 to 2036
- Table 13: East Asia Market Value (USD Million) Forecast by Country, 2021 to 2036
- Table 14: East Asia Market Value (USD Million) Forecast by Product, 2021 to 2036
- Table 15: East Asia Market Value (USD Million) Forecast by Material, 2021 to 2036
- Table 16: East Asia Market Value (USD Million) Forecast by Distribution, 2021 to 2036
- Table 17: South Asia and Pacific Market Value (USD Million) Forecast by Country, 2021 to 2036
- Table 18: South Asia and Pacific Market Value (USD Million) Forecast by Product, 2021 to 2036
- Table 19: South Asia and Pacific Market Value (USD Million) Forecast by Material, 2021 to 2036
- Table 20: South Asia and Pacific Market Value (USD Million) Forecast by Distribution, 2021 to 2036
List of Figures
- Figure 1: Global Market Pricing Analysis
- Figure 2: Global Market Value (USD Million) Forecast 2021-2036
- Figure 3: Global Market Value Share and BPS Analysis by Product, 2026 and 2036
- Figure 4: Global Market Y-o-Y Growth Comparison by Product, 2026-2036
- Figure 5: Global Market Attractiveness Analysis by Product
- Figure 6: Global Market Value Share and BPS Analysis by Material, 2026 and 2036
- Figure 7: Global Market Y-o-Y Growth Comparison by Material, 2026-2036
- Figure 8: Global Market Attractiveness Analysis by Material
- Figure 9: Global Market Value Share and BPS Analysis by Distribution, 2026 and 2036
- Figure 10: Global Market Y-o-Y Growth Comparison by Distribution, 2026-2036
- Figure 11: Global Market Attractiveness Analysis by Distribution
- Figure 12: Global Market Value (USD Million) Share and BPS Analysis by Region, 2026 and 2036
- Figure 13: Global Market Y-o-Y Growth Comparison by Region, 2026-2036
- Figure 14: Global Market Attractiveness Analysis by Region
- Figure 15: North America Market Incremental Dollar Opportunity, 2026-2036
- Figure 16: Europe Market Incremental Dollar Opportunity, 2026-2036
- Figure 17: East Asia Market Incremental Dollar Opportunity, 2026-2036
- Figure 18: South Asia and Pacific Market Incremental Dollar Opportunity, 2026-2036
- Figure 19: North America Market Value Share and BPS Analysis by Country, 2026 and 2036
- Figure 20: North America Market Value Share and BPS Analysis by Product, 2026 and 2036
- Figure 21: North America Market Y-o-Y Growth Comparison by Product, 2026-2036
- Figure 22: North America Market Attractiveness Analysis by Product
- Figure 23: North America Market Value Share and BPS Analysis by Material, 2026 and 2036
- Figure 24: North America Market Y-o-Y Growth Comparison by Material, 2026-2036
- Figure 25: North America Market Attractiveness Analysis by Material
- Figure 26: North America Market Value Share and BPS Analysis by Distribution, 2026 and 2036
- Figure 27: North America Market Y-o-Y Growth Comparison by Distribution, 2026-2036
- Figure 28: North America Market Attractiveness Analysis by Distribution
- Figure 29: Europe Market Value Share and BPS Analysis by Country, 2026 and 2036
- Figure 30: Europe Market Value Share and BPS Analysis by Product, 2026 and 2036
- Figure 31: Europe Market Y-o-Y Growth Comparison by Product, 2026-2036
- Figure 32: Europe Market Attractiveness Analysis by Product
- Figure 33: Europe Market Value Share and BPS Analysis by Material, 2026 and 2036
- Figure 34: Europe Market Y-o-Y Growth Comparison by Material, 2026-2036
- Figure 35: Europe Market Attractiveness Analysis by Material
- Figure 36: Europe Market Value Share and BPS Analysis by Distribution, 2026 and 2036
- Figure 37: Europe Market Y-o-Y Growth Comparison by Distribution, 2026-2036
- Figure 38: Europe Market Attractiveness Analysis by Distribution
- Figure 39: East Asia Market Value Share and BPS Analysis by Country, 2026 and 2036
- Figure 40: East Asia Market Value Share and BPS Analysis by Product, 2026 and 2036
- Figure 41: East Asia Market Y-o-Y Growth Comparison by Product, 2026-2036
- Figure 42: East Asia Market Attractiveness Analysis by Product
- Figure 43: East Asia Market Value Share and BPS Analysis by Material, 2026 and 2036
- Figure 44: East Asia Market Y-o-Y Growth Comparison by Material, 2026-2036
- Figure 45: East Asia Market Attractiveness Analysis by Material
- Figure 46: East Asia Market Value Share and BPS Analysis by Distribution, 2026 and 2036
- Figure 47: East Asia Market Y-o-Y Growth Comparison by Distribution, 2026-2036
- Figure 48: East Asia Market Attractiveness Analysis by Distribution
- Figure 49: South Asia and Pacific Market Value Share and BPS Analysis by Country, 2026 and 2036
- Figure 50: South Asia and Pacific Market Value Share and BPS Analysis by Product, 2026 and 2036
- Figure 51: South Asia and Pacific Market Y-o-Y Growth Comparison by Product, 2026-2036
- Figure 52: South Asia and Pacific Market Attractiveness Analysis by Product
- Figure 53: South Asia and Pacific Market Value Share and BPS Analysis by Material, 2026 and 2036
- Figure 54: South Asia and Pacific Market Y-o-Y Growth Comparison by Material, 2026-2036
- Figure 55: South Asia and Pacific Market Attractiveness Analysis by Material
- Figure 56: South Asia and Pacific Market Value Share and BPS Analysis by Distribution, 2026 and 2036
- Figure 57: South Asia and Pacific Market Y-o-Y Growth Comparison by Distribution, 2026-2036
- Figure 58: South Asia and Pacific Market Attractiveness Analysis by Distribution
- Figure 59: Global Market - Tier Structure Analysis
- Figure 60: Global Market - Company Share Analysis
Frequently Asked Questions
How big is the canes and crutches market in 2026?
FMI estimates the market at USD 992.8 million in 2026, up from USD 950.0 million in 2025. It is forecast to reach USD 1,541.7 million by 2036 at a 4.5% CAGR.
Which product leads the canes and crutches market in 2026?
Canes leads by product with 52.0% in 2026. All other segments together hold 48.0%.
Which material and distribution lead in 2026?
Aluminium holds 68.0% by material and Retail pharmacies holds 36.0% by distribution in FMI's 2026 assessment.
Which market is forecast to grow fastest through 2036?
India has the highest forecast CAGR at 6.9% during 2026 to 2036, followed by China at 6.4%.
Does institutional reuse remove the need for new products?
Reuse can reduce new purchasing for a given number of patients, but it depends on returned equipment being suitable for reissue. Leighton Hospital's service is one documented example.[6]
Preview the report firsthand - request a free sample
Get SampleGet the brochure for pricing and purchase details.
Get PDF
