Eldercare Mobility Device Market Size and Share Forecast Outlook 2025 to 2035

The eldercare mobility device market is set to expand from USD 11.1 billion in 2025 to USD 22 billion by 2035, growing at a CAGR of 7.1%. Annual increases in market value rise steadily, from USD 0.79 billion in 2026 to over USD 1.45 billion in 2035.

This consistent growth is underpinned by aging populations across OECD and Asia-Pacific regions, increased spending on assisted living infrastructure, and broader insurance coverage for mobility aids. Walkers, scooters, and smart wheelchairs are increasingly favored for their stability and digital features. Public health policy support and elderly independence initiatives also continue to drive procurement in both public and private care facilities.
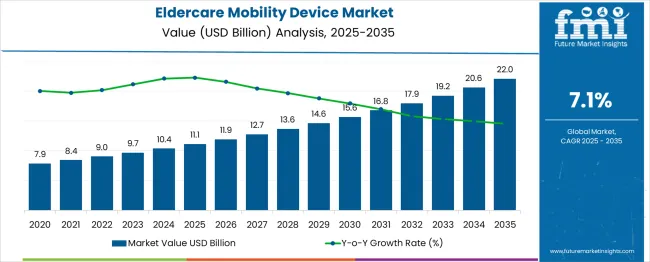
Quick Stats for Eldercare Mobility Device Market

  • Eldercare Mobility Device Market Size (2025): USD 11.1 billion
  • Projected Eldercare Mobility Device Market Size (2035): USD 22 billion
  • Forecast CAGR of Eldercare Mobility Device Market (2025 to 2035): 7.1%
  • Leading Segment of Eldercare Mobility Device Market (2025): Wheelchairs (31.6%)
  • Key Growth Regions of Eldercare Mobility Device Market: South Asia (India with 9.3% CAGR)
  • Top Key Players of Eldercare Mobility Device Market: Drive DeVilbiss Healthcare, INVACARE, MEYRA, GF Health Products, Hoveround Mobility.

Eldercare Mobility Device Market Market Value Analysis

Metric Value
Industry Size (2025E) USD 11.1 billion
Industry Value (2035F) USD 22 billion
CAGR (2025 to 2035) 7.1%

The eldercare mobility device market plays a critical role across various assistive and healthcare segments. In the USD 9.8 billion mobility aids and equipment market, elder-focused devices account for 45-50%, reflecting their high usage among aging populations. Within the USD 12.1 billion personal mobility device market, 35-40% is attributed to eldercare solutions such as power scooters and manual wheelchairs.

Nearly 100% of the USD 10.4 billion senior mobility aid devices market directly aligns with eldercare applications. In the USD 33-38 billion eldercare assistive devices market, 25-30% is driven by mobility aids like walkers and rollators. Even in the expansive USD 868 billion elder care services and assistive device ecosystem, 1-2% is attributed to mobility devices, underscoring their essential daily role.

Analyzing Eldercare Mobility Device Market by Top Investment Segments

The eldercare mobility device industry has been segmented by product type, distribution channel, technology type, end user, and region. Product categories include wheelchairs, mobility scooters, walkers, and canes. Distribution channels encompass offline retail, e-commerce, and institutional supply. Technology segmentation includes manual and powered devices.

End users range from homecare settings to rehabilitation centers and hospitals. The industry spans across North America, Europe, Asia Pacific, Latin America, and the Middle East & Africa, influenced by aging populations, chronic disease prevalence, and evolving eldercare infrastructure.

Wheelchairs Lead Product Demand with 31.6% Share

Wheelchairs held 31.6% of the market in 2025, driven by their critical role in addressing mobility limitations in geriatric care. Between 2025 and 2027, rising post-operative care needs in Europe and North America spurred adoption of lightweight and foldable models. From 2028 to 2030, government-sponsored disability programs in countries like Japan and Germany expanded access.

By 2035, advanced ergonomic designs and hybrid models integrating sensors for posture support entered mainstream eldercare settings. Wheelchairs continue to lead due to their versatility across homecare, hospitals, and nursing facilities.
  • Adopted in European eldercare homes for post-surgical recovery
  • Supported by disability schemes in Japan and Germany
  • Enhanced with smart posture sensors for extended use comfort

Offline Retail Remains Primary Distribution Channel

Eldercare Mobility Device Market Analysis By Distribution Channel

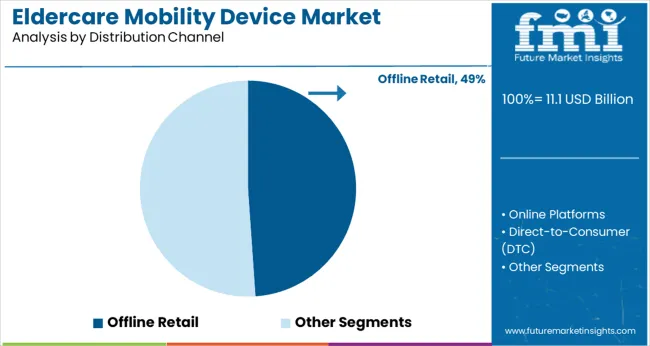
Offline retail accounted for 49% of the market in 2025, fueled by preference for in-person product trials, especially among elderly users and caregivers. Between 2025 and 2027, North American pharmacy chains like CVS and Europe’s Mediq stores expanded mobility product offerings.

From 2028 onward, healthcare equipment showrooms in urban India and Southeast Asia became critical for large-format assistive devices. Despite e-commerce growth, offline outlets retained dominance through personalized consultation, immediate product availability, and after-sales support-key factors for high-involvement eldercare purchases.
  • Widely stocked in North American retail pharmacy chains
  • Gained momentum in urban Asia via specialized healthcare stores
  • Remains preferred for demo trials and in-person consultations

Manual Devices Dominate Technology Adoption

Eldercare Mobility Device Market Analysis By Technology Type

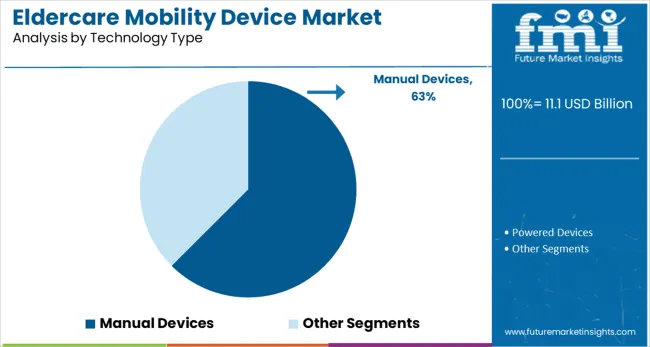
Manual mobility devices led with 63% share in 2025, supported by affordability, ease of maintenance, and user familiarity. Between 2025 and 2027, manual wheelchairs and walkers were favored across homecare environments in China, India, and Brazil. By 2030, eldercare NGOs and community care programs globally adopted manual aids for outreach and public health initiatives.

Though powered devices gained ground, manual variants remained the default for rural users, cost-sensitive patients, and those with limited access to electricity or service centers.
  • Used in rural eldercare programs across Asia and Latin America
  • Preferred by NGOs for distribution in low-income communities
  • Favored for simplicity and low maintenance requirements

Homecare Settings Emerge as Dominant End Use

Eldercare Mobility Device Market Analysis By End User

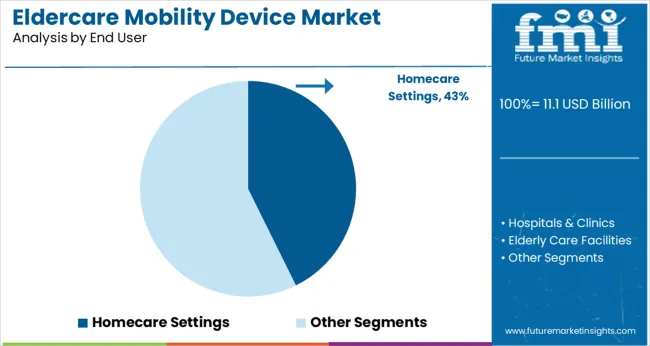
Homecare settings held 43% of the market in 2025, reflecting a shift toward aging-in-place models and decentralized eldercare. Between 2025 and 2028, Western countries experienced a rise in mobility device prescriptions for at-home recovery. In Japan and South Korea, insurers covered mobility aids for home-based geriatric patients.

By 2035, assistive devices were integrated into smart home ecosystems across Europe and North America, enhancing safety and mobility within residential environments. Homecare remained the focal point of demand due to its compatibility with lifestyle-based eldercare models.

  • Widely adopted in USA and EU home-based care programs
  • Covered by insurance in Japan’s long-term care system
  • Integrated with home automation tools for improved mobility

Top Eldercare Mobility Device Market Dynamics

The industry is expanding rapidly in response to global demographic shifts and healthcare system evolution. While innovation and supportive policies are advancing product offerings from smart wheelchairs to robotic aids-high costs, infrastructure gaps, and stigma-related resistance are slowing broader implementation.

Assistive Innovation Expands Eldercare Mobility Adoption

Eldercare mobility devices are being increasingly adopted due to rising geriatric populations and the need for improved quality of life in aging communities. Modern devices-ranging from foldable walkers to AI-powered motorized wheelchairs-enhance independence, reduce fall risk, and improve navigation in constrained home and care environments.

Integration with digital health platforms and lightweight material innovation has improved accessibility and comfort, making mobility aids more viable for long-term and at-home usage.

  • Smart and motorized devices improve independence and reduce caregiver load
  • Lightweight, foldable designs enhance portability and in-home usability
  • Remote monitoring integration supports assisted living and telehealth

Cost, Access, and Social Stigma Remain Key Barriers

Despite increasing demand, the eldercare mobility device industry faces barriers due to high upfront costs, limited insurance coverage, and fragmented access in rural and low-income areas. Distribution is often concentrated in urban zones, leaving underserved populations without adequate support.

The social stigma and lack of awareness regarding modern mobility solutions prevent consistent adoption, even when devices are available. Long-term usage is also hindered by poor maintenance infrastructure and low product customization.
  • High device cost and reimbursement gaps restrict adoption
  • Limited rural access and service infrastructure reduce market reach
  • Stigma and low awareness slow uptake despite product availability

Top Countries Designing, Distributing, and Advancing Eldercare Mobility Devices

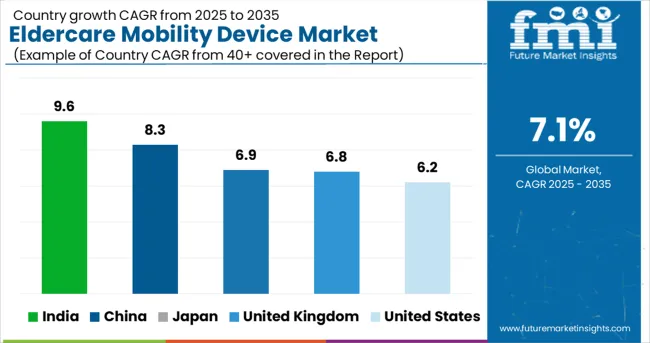
Eldercare Mobility Device Market Cagr Analysis By Country

Countries CAGR (2025 to 2035)
India 9.6
China 8.3
Japan 6.9
United Kingdom 6.8
United States 6.2

The eldercare mobility device market is projected to grow at a global CAGR of 7.1% from 2025 to 2035. India leads among the profiled nations with 9.6%, followed by China at 8.3%, both surpassing the global pace. These BRICS economies are responding to rapidly aging populations and rising demand for low-cost assistive technologies. Japan, the United Kingdom, and the United States trail slightly at 6.9, 6.8, and 6.2, respectively, despite well-established eldercare ecosystems.

India’s momentum is driven by local manufacturing hubs producing walkers, rollators, and motorized chairs at affordable price points. Government tenders and elder housing projects are also expanding access. China’s growth is fueled by large-scale procurement by public health agencies and growing adoption in secondary cities.

In contrast, OECD nations see slower gains due to saturated markets, higher unit costs, and slower innovation cycles in reimbursement-backed product categories. These five countries represent strategic benchmarks from a wider 40+ country analysis.

Demand Outlook for Eldercare Mobility Devices in the United States

Demand for eldercare mobility device in the United States is growing at a CAGR of 6.2% between 2025 and 2035. Growth is expected to be driven by expanded home healthcare services, Medicaid-supported equipment reimbursements, and greater adoption of powered wheelchairs and rollators.

Between 2020 and 2024, demand was anchored by post-acute care centers and veterans hospitals, with regional spikes observed in states with aging populations such as Florida and Pennsylvania. New product innovation focused on ergonomic walkers and voice-assisted mobility aids.

  • Medicare Part B covered 65% of mobility aid reimbursements by 2024
  • VA hospitals accounted for 17% of total powered wheelchair distribution
  • Over 230 ergonomic walker models were introduced between 2021 and 2024

Sales Analysis of Eldercare Mobility Devices in the United Kingdom

The sale of eldercare mobility devices in the United Kingdom is expanding at a CAGR of 6.8% from 2025 to 2035. Sales will be supported by NHS procurement for aging-in-place services and increased availability of smart mobility aids through digital health platforms.

During 2020 to 2024, regional councils piloted device-sharing programs and lightweight rollators gained traction among seniors in assisted living. A shift toward modular and foldable designs contributed to higher adoption across care homes and home users.

  • NHS Homecare Services expanded device supply contracts in 41 counties by 2024
  • Regional authorities introduced community-based mobility rental schemes post-2022
  • Foldable walkers represented 52% of all units sold by late 2024

In-depth Analysis of Eldercare Mobility Device Market in India

Demand for eldercare mobility devices in India is projected to grow at a CAGR of 9.6% from 2025 to 2035. Growth will be driven by rising geriatric population in urban centers, increased health insurance penetration, and expansion of home-based rehabilitation services.

From 2020 to 2024, demand remained largely unorganized, with growth clustered around Tier 1 cities through hospitals and private eldercare startups. Demand for walkers, wheelchairs, and patient transfer aids surged after COVID-19, influencing the domestic manufacturing base.

  • Over 120 private eldercare centers integrated mobility equipment into home packages
  • Demand for walkers increased 4.2× between 2020 and 2024 in metro areas
  • Government launched assistive device subsidies through district disability rehab centers

Opportunity Analysis of Eldercare Mobility Devices in China

The eldercare mobility device market in China is forecast to grow at a CAGR of 8.3% from 2025 to 2035. Increasing urbanization of elderly populations, coupled with long-term care pilot programs in provincial zones, will drive growth. Technologically advanced devices such as robotic walkers and sensor-enabled wheelchairs are being incorporated into senior care infrastructure. Between 2020 and 2024, procurement was driven by private eldercare chains and community clinics in major urban areas.

  • Shenzhen and Chengdu launched AI-powered eldercare mobility trials in 2023
  • 37% of mobility devices sold in 2024 included smart sensor features
  • Ministry of Civil Affairs announced long-term device leasing models in 2025

Demand Analysis for Eldercare Mobility Devices in Japan

Sales of eldercare mobility devicesin Chinaare expected to expand at a CAGR of 6.9% from 2025 to 2035. Demand will be fueled by long-term care insurance reimbursements, compact urban mobility solutions, and robotic assistance in assisted living facilities. Between 2020 and 2024, consumption was steady, with emphasis on high-performance wheelchairs and multi-functional walkers tailored to apartment-based living. Manufacturers have focused on safety upgrades and battery-efficient motorized units for aging consumers.
  • Robotic mobility aids were deployed in 460 care homes by end-2024
  • 71% of seniors in Tokyo used foldable walkers with brake assist
  • National insurance schemes reimbursed 68% of all device costs in 2024

Competitive Landscape ofthe Eldercare Mobility Device Market

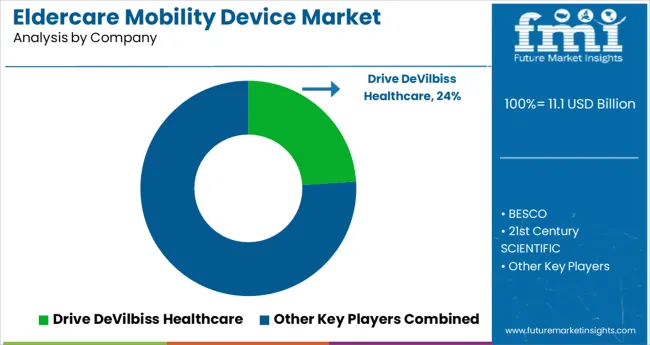
Eldercare Mobility Device Market Analysis By Company

The eldercare mobility device market is anchored by established manufacturers of durable and user-focused solutions. Drive DeVilbiss Healthcare, INVACARE, and MEYRA dominate with a full range of mobility aids-power chairs, scooters, walkers-and support products targeting both home and institutional users.

Hoveround Mobility and GF Health Products specialize in user-friendly power chairs and lift-assist systems, catering to independence and comfort. BESCO and 21st Century Scientific focus on specialized clinical-grade devices and rehabilitation equipment, serving elderly care facilities and home health ecosystems.

Meanwhile, CAREX distributes a broad catalog of mobility and transfer solutions across retail and e-commerce platforms. LEVO and nova are innovating with home-access technologies and smart-care integrations, such as stairlifts with IoT compatibility. This mix of legacy brands and emerging innovators defines current competition in reliability, product scope, and tech-enabled elder mobility solutions.

Leading Company - Drive DeVilbiss HealthcareIndustry Share - ~24%

Recent Industry News

  • In April 2025, Sunrise Medical unveiled the Empulse F35 power-assist pull device, designed to enhance daily mobility through an ultra-slim, lightweight build and modern styling tailored for urban environments. This launch reinforced its position in the mobility aid sector by addressing the need for practical, user-friendly urban transport assistance.
  • In July 2024, Drive DeVilbiss Healthcare (DDH) acquired the full product portfolio of Mobility Designed, Inc., enabling expansion of its mobility solutions range. The acquisition brought advanced ergonomic and aesthetic design capabilities into DDH’s offerings, enhancing its competitive edge in the senior mobility devices industry.

Leading Companies in Eldercare Mobility Device Market

  • BESCO
  • 21st Century SCIENTIFIC
  • CAREX
  • Drive DeVilbiss Healthcare
  • GF Health Products
  • Hoveround Mobility
  • INVACARE
  • LEVO
  • MEDLINE
  • MEYRA
  • NOVA

Research Coverage and Scope Summary

Report Attributes Details
Industry Size (2025) USD 11.1 billion
Projected Industry Size (2035) USD 22 billion
CAGR (2025 to 2035) 7.1%
Base Year for Estimation 2024
Historical Period 2020 to 2024
Projections Period 2025 to 2035
Quantitative Units USD billion for value and million units for volume
Product Types Analyzed (Segment 1) Wheelchairs (Manual and Powered/Electric), Mobility Scooters (3-Wheel and 4-Wheel), Walkers & Rollators, Canes & Crutches, Stair Lifts & Lifting Chairs
Distribution Channels Analyzed (Segment 2) Offline Retail (Medical Supply Stores, Pharmacies), Online Platforms, Direct-to-Consumer (DTC), Healthcare Providers & Distributors
Technology Types Analyzed (Segment 3) Manual Devices, Powered Devices (Battery-operated, AI-enabled, IoT-connected)
End Users Analyzed (Segment 4) Homecare Settings, Hospitals & Clinics, Elderly Care Facilities, Rehabilitation Centers
Countries Covered United States, Canada, Germany, United Kingdom, France, Italy, Spain, China, India, Japan, South Korea, Australia, Brazil, Mexico, Argentina, Saudi Arabia, UAE, South Africa
Key Players BESCO, 21st Century SCIENTIFIC, CAREX, Drive DeVilbiss Healthcare, GF Health Products, Hoveround Mobility, INVACARE, LEVO, MEDLINE, MEYRA, NOVA
Additional Attributes Dollar sales, share by device type and technology, rising demand in homecare and assisted living, growth of AI-enabled and connected mobility solutions, regional elderly population trends

Key Segments

By Product Type:

This segment includes Wheelchairs (Manual and Powered/Electric), Mobility Scooters (3-Wheel and 4-Wheel), Walkers & Rollators, Canes & Crutches, and Stair Lifts & Lifting Chairs.

By Distribution Channel:

This includes Offline Retail (Medical Supply Stores, Pharmacies), Online Platforms, Direct-to-Consumer (DTC), and Healthcare Providers & Distributors.

By Technology Type:

The segment is categorized into Manual Devices and Powered Devices (Battery-operated, AI-enabled, IoT-connected).

By End User:

The industry is segmented into Homecare Settings, Hospitals & Clinics, Elderly Care Facilities, and Rehabilitation Centers.

By Region:

Regional analysis includes North America, Europe, Asia Pacific, Latin America, and Middle East & Africa.

Table of Content

  1. Executive Summary
    • Global Market Outlook
    • Demand-side Trends
    • Supply-side Trends
    • Technology Roadmap Analysis
    • Analysis and Recommendations
  2. Market Overview
    • Market Coverage / Taxonomy
    • Market Definition / Scope / Limitations
  3. Market Background
    • Market Dynamics
      • Drivers
      • Restraints
      • Opportunity
      • Trends
    • Scenario Forecast
      • Demand in Optimistic Scenario
      • Demand in Likely Scenario
      • Demand in Conservative Scenario
    • Opportunity Map Analysis
    • Product Life Cycle Analysis
    • Supply Chain Analysis
      • Supply Side Participants and their Roles
        • Producers
        • Mid-Level Participants (Traders/ Agents/ Brokers)
        • Wholesalers and Distributors
      • Value Added and Value Created at Node in the Supply Chain
      • List of Raw Material Suppliers
      • List of Existing and Potential Buyer’s
    • Investment Feasibility Matrix
    • Value Chain Analysis
      • Profit Margin Analysis
      • Wholesalers and Distributors
      • Retailers
    • PESTLE and Porter’s Analysis
    • Regulatory Landscape
      • By Key Regions
      • By Key Countries
    • Regional Parent Market Outlook
    • Production and Consumption Statistics
    • Import and Export Statistics
  4. Global Market Analysis 2020 to 2024 and Forecast, 2025 to 2035
    • Historical Market Size Value (USD Billion) & Volume (Million Units) Analysis, 2020 to 2024
    • Current and Future Market Size Value (USD Billion) & Volume (Million Units) Projections, 2025 to 2035
      • Y-o-Y Growth Trend Analysis
      • Absolute $ Opportunity Analysis
  5. Global Market Pricing Analysis 2020 to 2024 and Forecast 2025 to 2035
  6. Global Market Analysis 2020 to 2024 and Forecast 2025 to 2035, By Product Type
    • Introduction / Key Findings
    • Historical Market Size Value (USD Billion) & Volume (Million Units) Analysis By Product Type, 2020 to 2024
    • Current and Future Market Size Value (USD Billion) & Volume (Million Units) Analysis and Forecast By Product Type, 2025 to 2035
      • Wheelchairs
        • Manual Wheelchairs
        • Powered/Electric Wheelchairs
      • Mobility Scooters
        • 3-Wheel Mobility Scooters
        • 4-Wheel Mobility Scooters
      • Walkers & Rollators
      • Canes & Crutches
      • Stair Lifts & Lifting Chairs
    • Y-o-Y Growth Trend Analysis By Product Type, 2020 to 2024
    • Absolute $ Opportunity Analysis By Product Type, 2025 to 2035
  7. Global Market Analysis 2020 to 2024 and Forecast 2025 to 2035, By Technology Type
    • Introduction / Key Findings
    • Historical Market Size Value (USD Billion) & Volume (Million Units) Analysis By Technology Type, 2020 to 2024
    • Current and Future Market Size Value (USD Billion) & Volume (Million Units) Analysis and Forecast By Technology Type, 2025 to 2035
      • Manual Devices
      • Powered Devices
        • Battery-Operated Devices
        • AI-Enabled Devices
        • IoT-Connected Devices
      • Powder/Granules
    • Y-o-Y Growth Trend Analysis By Technology Type, 2020 to 2024
    • Absolute $ Opportunity Analysis By Technology Type, 2025 to 2035
  8. Global Market Analysis 2020 to 2024 and Forecast 2025 to 2035, By Distribution Channel
    • Introduction / Key Findings
    • Historical Market Size Value (USD Billion) & Volume (Million Units) Analysis By Distribution Channel, 2020 to 2024
    • Current and Future Market Size Value (USD Billion) & Volume (Million Units) Analysis and Forecast By Distribution Channel, 2025 to 2035
      • Offline Retail
        • Medical Supply Stores
        • Pharmacies
      • Online Platforms
      • Direct-to-Consumer (DTC)
      • Healthcare Providers & Distributors
      • Energy & Power
      • Others
    • Y-o-Y Growth Trend Analysis By Distribution Channel, 2020 to 2024
    • Absolute $ Opportunity Analysis By Distribution Channel, 2025 to 2035
  9. Global Market Analysis 2020 to 2024 and Forecast 2025 to 2035, By End User
    • Introduction / Key Findings
    • Historical Market Size Value (USD Billion) & Volume (Million Units) Analysis By End User, 2020 to 2024
    • Current and Future Market Size Value (USD Billion) & Volume (Million Units) Analysis and Forecast By End User, 2025 to 2035
      • Homecare Settings
      • Hospitals & Clinics
      • Elderly Care Facilities
      • Rehabilitation Centers
    • Y-o-Y Growth Trend Analysis By End User, 2020 to 2024
    • Absolute $ Opportunity Analysis By End User, 2025 to 2035
  10. Global Market Analysis 2020 to 2024 and Forecast 2025 to 2035, By Region
    • Introduction
    • Historical Market Size Value (USD Billion) & Volume (Million Units) Analysis By Region, 2020 to 2024
    • Current Market Size Value (USD Billion) & Volume (Million Units) Analysis and Forecast By Region, 2025 to 2035
      • North America
      • Latin America
      • Western Europe
      • Eastern Europe
      • East Asia
      • South Asia & Pacific
      • Middle East and Africa
    • Market Attractiveness Analysis By Region
  11. North America Market Analysis 2020 to 2024 and Forecast 2025 to 2035, By Country
    • Historical Market Size Value (USD Billion) & Volume (Million Units) Trend Analysis By Market Taxonomy, 2020 to 2024
    • Market Size Value (USD Billion) & Volume (Million Units) Forecast By Market Taxonomy, 2025 to 2035
      • By Country
        • USA
        • Canada
        • Mexico
      • By Product Type
      • By Technology Type
      • By Distribution Channel
      • By End User
    • Market Attractiveness Analysis
      • By Country
      • By Product Type
      • By Technology Type
      • By Distribution Channel
      • By End User
    • Key Takeaways
  12. Latin America Market Analysis 2020 to 2024 and Forecast 2025 to 2035, By Country
    • Historical Market Size Value (USD Billion) & Volume (Million Units) Trend Analysis By Market Taxonomy, 2020 to 2024
    • Market Size Value (USD Billion) & Volume (Million Units) Forecast By Market Taxonomy, 2025 to 2035
      • By Country
        • Brazil
        • Argentina
        • Rest of LATAM
      • By Product Type
      • By Technology Type
      • By Distribution Channel
      • By End User
    • Market Attractiveness Analysis
      • By Country
      • By Product Type
      • By Technology Type
      • By Distribution Channel
      • By End User
    • Key Takeaways
  13. Western Europe Market Analysis 2020 to 2024 and Forecast 2025 to 2035, By Country
    • Historical Market Size Value (USD Billion) & Volume (Million Units) Trend Analysis By Market Taxonomy, 2020 to 2024
    • Market Size Value (USD Billion) & Volume (Million Units) Forecast By Market Taxonomy, 2025 to 2035
      • By Country
        • Germany
        • Italy
        • France
        • UK
        • Spain
        • BENELUX
        • Nordic
        • Rest of W.Europe
      • By Product Type
      • By Technology Type
      • By Distribution Channel
      • By End User
    • Market Attractiveness Analysis
      • By Country
      • By Product Type
      • By Technology Type
      • By Distribution Channel
      • By End User
    • Key Takeaways
  14. Eastern Europe Market Analysis 2020 to 2024 and Forecast 2025 to 2035, By Country
    • Historical Market Size Value (USD Billion) & Volume (Million Units) Trend Analysis By Market Taxonomy, 2020 to 2024
    • Market Size Value (USD Billion) & Volume (Million Units) Forecast By Market Taxonomy, 2025 to 2035
      • By Country
        • Russia
        • Hungary
        • Poland
        • Balkan & Baltics
        • Rest of E. Europe
      • By Product Type
      • By Technology Type
      • By Distribution Channel
      • By End User
    • Market Attractiveness Analysis
      • By Country
      • By Product Type
      • By Technology Type
      • By Distribution Channel
      • By End User
    • Key Takeaways
  15. East Asia Market Analysis 2020 to 2024 and Forecast 2025 to 2035, By Country
    • Historical Market Size Value (USD Billion) & Volume (Million Units) Trend Analysis By Market Taxonomy, 2020 to 2024
    • Market Size Value (USD Billion) & Volume (Million Units) Forecast By Market Taxonomy, 2025 to 2035
      • By Country
        • China
        • Japan
        • South Korea
      • By Product Type
      • By Technology Type
      • By Distribution Channel
      • By End User
    • Market Attractiveness Analysis
      • By Country
      • By Product Type
      • By Technology Type
      • By Distribution Channel
      • By End User
    • Key Takeaways
  16. South Asia & Pacific Market Analysis 2020 to 2024 and Forecast 2025 to 2035, By Country
    • Historical Market Size Value (USD Billion) & Volume (Million Units) Trend Analysis By Market Taxonomy, 2020 to 2024
    • Market Size Value (USD Billion) & Volume (Million Units) Forecast By Market Taxonomy, 2025 to 2035
      • By Country
        • India
        • Australia & New Zealand
        • ASEAN
        • Rest of SAP
      • By Product Type
      • By Technology Type
      • By Distribution Channel
      • By End User
    • Market Attractiveness Analysis
      • By Country
      • By Product Type
      • By Technology Type
      • By Distribution Channel
      • By End User
    • Key Takeaways
  17. Middle East and Africa Market Analysis 2020 to 2024 and Forecast 2025 to 2035, By Country
    • Historical Market Size Value (USD Billion) & Volume (Million Units) Trend Analysis By Market Taxonomy, 2020 to 2024
    • Market Size Value (USD Billion) & Volume (Million Units) Forecast By Market Taxonomy, 2025 to 2035
      • By Country
        • GCC Countries
        • Northern Africa
        • South Africa
        • Turkiye
        • Rest of MEA
      • By Product Type
      • By Technology Type
      • By Distribution Channel
      • By End User
    • Market Attractiveness Analysis
      • By Country
      • By Product Type
      • By Technology Type
      • By Distribution Channel
      • By End User
    • Key Takeaways
  18. Key Countries Market Analysis
    • USA
      • Pricing Analysis
      • Market Share Analysis, 2024
        • By Product Type
        • By Technology Type
        • By Distribution Channel
        • By End User
    • Canada
      • Pricing Analysis
      • Market Share Analysis, 2024
        • By Product Type
        • By Technology Type
        • By Distribution Channel
        • By End User
    • Brazil
      • Pricing Analysis
      • Market Share Analysis, 2024
        • By Product Type
        • By Technology Type
        • By Distribution Channel
        • By End User
    • Mexico
      • Pricing Analysis
      • Market Share Analysis, 2024
        • By Product Type
        • By Technology Type
        • By Distribution Channel
        • By End User
    • Argentina
      • Pricing Analysis
      • Market Share Analysis, 2024
        • By Product Type
        • By Technology Type
        • By Distribution Channel
        • By End User
  19. Market Structure Analysis
    • Competition Dashboard
    • Competition Benchmarking
    • Market Share Analysis of Top Players
      • By Regional
      • By Product Type
      • By Technology Type
      • By Distribution Channel
      • By End User
  20. Competition Analysis
    • Competition Deep Dive
      • BESCO
        • Overview
        • Product Portfolio
        • Profitability by Market Segments (Product/Age /Sales Channel/Region)
        • Sales Footprint
        • Strategy Overview
          • Marketing Strategy
          • Product Strategy
          • Channel Strategy
      • 21st Century SCIENTIFIC
        • Overview
        • Product Portfolio
        • Profitability by Market Segments (Product/Age /Sales Channel/Region)
        • Sales Footprint
        • Strategy Overview
          • Marketing Strategy
          • Product Strategy
          • Channel Strategy
      • CAREX
        • Overview
        • Product Portfolio
        • Profitability by Market Segments (Product/Age /Sales Channel/Region)
        • Sales Footprint
        • Strategy Overview
          • Marketing Strategy
          • Product Strategy
          • Channel Strategy
      • Drive DeVilbiss Healthcare
        • Overview
        • Product Portfolio
        • Profitability by Market Segments (Product/Age /Sales Channel/Region)
        • Sales Footprint
        • Strategy Overview
          • Marketing Strategy
          • Product Strategy
          • Channel Strategy
      • GF Health Products
        • Overview
        • Product Portfolio
        • Profitability by Market Segments (Product/Age /Sales Channel/Region)
        • Sales Footprint
        • Strategy Overview
          • Marketing Strategy
          • Product Strategy
          • Channel Strategy
      • Hoveround Mobility
        • Overview
        • Product Portfolio
        • Profitability by Market Segments (Product/Age /Sales Channel/Region)
        • Sales Footprint
        • Strategy Overview
          • Marketing Strategy
          • Product Strategy
          • Channel Strategy
      • INVACARE
        • Overview
        • Product Portfolio
        • Profitability by Market Segments (Product/Age /Sales Channel/Region)
        • Sales Footprint
        • Strategy Overview
          • Marketing Strategy
          • Product Strategy
          • Channel Strategy
      • LEVO
        • Overview
        • Product Portfolio
        • Profitability by Market Segments (Product/Age /Sales Channel/Region)
        • Sales Footprint
        • Strategy Overview
          • Marketing Strategy
          • Product Strategy
          • Channel Strategy
      • MEDLINE
        • Overview
        • Product Portfolio
        • Profitability by Market Segments (Product/Age /Sales Channel/Region)
        • Sales Footprint
        • Strategy Overview
          • Marketing Strategy
          • Product Strategy
          • Channel Strategy
      • MEYRA
        • Overview
        • Product Portfolio
        • Profitability by Market Segments (Product/Age /Sales Channel/Region)
        • Sales Footprint
        • Strategy Overview
          • Marketing Strategy
          • Product Strategy
          • Channel Strategy
      • NOVA
        • Overview
        • Product Portfolio
        • Profitability by Market Segments (Product/Age /Sales Channel/Region)
        • Sales Footprint
        • Strategy Overview
          • Marketing Strategy
          • Product Strategy
          • Channel Strategy
  21. Assumptions & Acronyms Used
  22. Research Methodology

List of Tables

  • Table 1: Global Market Value (USD Billion) Forecast by Region, 2020-2035
  • Table 2: Global Market Volume (Million Units) Forecast by Region, 2020-2035
  • Table 3: Global Market Value (USD Billion) Forecast by Product Type, 2020-2035
  • Table 4: Global Market Volume (Million Units) Forecast by Product Type, 2020-2035
  • Table 5: Global Market Value (USD Billion) Forecast by Technology Type, 2020-2035
  • Table 6: Global Market Volume (Million Units) Forecast by Technology Type, 2020-2035
  • Table 7: Global Market Value (USD Billion) Forecast by Distribution Channel, 2020-2035
  • Table 8: Global Market Volume (Million Units) Forecast by Distribution Channel, 2020-2035
  • Table 9: Global Market Value (USD Billion) Forecast by End User, 2020-2035
  • Table 10: Global Market Volume (Million Units) Forecast by End User, 2020-2035
  • Table 11: North America Market Value (USD Billion) Forecast by Country, 2020-2035
  • Table 12: North America Market Volume (Million Units) Forecast by Country, 2020-2035
  • Table 13: North America Market Value (USD Billion) Forecast by Product Type, 2020-2035
  • Table 14: North America Market Volume (Million Units) Forecast by Product Type, 2020-2035
  • Table 15: North America Market Value (USD Billion) Forecast by Technology Type, 2020-2035
  • Table 16: North America Market Volume (Million Units) Forecast by Technology Type, 2020-2035
  • Table 17: North America Market Value (USD Billion) Forecast by Distribution Channel, 2020-2035
  • Table 18: North America Market Volume (Million Units) Forecast by Distribution Channel, 2020-2035
  • Table 19: North America Market Value (USD Billion) Forecast by End User, 2020-2035
  • Table 20: North America Market Volume (Million Units) Forecast by End User, 2020-2035
  • Table 21: Latin America Market Value (USD Billion) Forecast by Country, 2020-2035
  • Table 22: Latin America Market Volume (Million Units) Forecast by Country, 2020-2035
  • Table 23: Latin America Market Value (USD Billion) Forecast by Product Type, 2020-2035
  • Table 24: Latin America Market Volume (Million Units) Forecast by Product Type, 2020-2035
  • Table 25: Latin America Market Value (USD Billion) Forecast by Technology Type, 2020-2035
  • Table 26: Latin America Market Volume (Million Units) Forecast by Technology Type, 2020-2035
  • Table 27: Latin America Market Value (USD Billion) Forecast by Distribution Channel, 2020-2035
  • Table 28: Latin America Market Volume (Million Units) Forecast by Distribution Channel, 2020-2035
  • Table 29: Latin America Market Value (USD Billion) Forecast by End User, 2020-2035
  • Table 30: Latin America Market Volume (Million Units) Forecast by End User, 2020-2035
  • Table 31: Western Europe Market Value (USD Billion) Forecast by Country, 2020-2035
  • Table 32: Western Europe Market Volume (Million Units) Forecast by Country, 2020-2035
  • Table 33: Western Europe Market Value (USD Billion) Forecast by Product Type, 2020-2035
  • Table 34: Western Europe Market Volume (Million Units) Forecast by Product Type, 2020-2035
  • Table 35: Western Europe Market Value (USD Billion) Forecast by Technology Type, 2020-2035
  • Table 36: Western Europe Market Volume (Million Units) Forecast by Technology Type, 2020-2035
  • Table 37: Western Europe Market Value (USD Billion) Forecast by Distribution Channel, 2020-2035
  • Table 38: Western Europe Market Volume (Million Units) Forecast by Distribution Channel, 2020-2035
  • Table 39: Western Europe Market Value (USD Billion) Forecast by End User, 2020-2035
  • Table 40: Western Europe Market Volume (Million Units) Forecast by End User, 2020-2035
  • Table 41: Eastern Europe Market Value (USD Billion) Forecast by Country, 2020-2035
  • Table 42: Eastern Europe Market Volume (Million Units) Forecast by Country, 2020-2035
  • Table 43: Eastern Europe Market Value (USD Billion) Forecast by Product Type, 2020-2035
  • Table 44: Eastern Europe Market Volume (Million Units) Forecast by Product Type, 2020-2035
  • Table 45: Eastern Europe Market Value (USD Billion) Forecast by Technology Type, 2020-2035
  • Table 46: Eastern Europe Market Volume (Million Units) Forecast by Technology Type, 2020-2035
  • Table 47: Eastern Europe Market Value (USD Billion) Forecast by Distribution Channel, 2020-2035
  • Table 48: Eastern Europe Market Volume (Million Units) Forecast by Distribution Channel, 2020-2035
  • Table 49: Eastern Europe Market Value (USD Billion) Forecast by End User, 2020-2035
  • Table 50: Eastern Europe Market Volume (Million Units) Forecast by End User, 2020-2035
  • Table 51: East Asia Market Value (USD Billion) Forecast by Country, 2020-2035
  • Table 52: East Asia Market Volume (Million Units) Forecast by Country, 2020-2035
  • Table 53: East Asia Market Value (USD Billion) Forecast by Product Type, 2020-2035
  • Table 54: East Asia Market Volume (Million Units) Forecast by Product Type, 2020-2035
  • Table 55: East Asia Market Value (USD Billion) Forecast by Technology Type, 2020-2035
  • Table 56: East Asia Market Volume (Million Units) Forecast by Technology Type, 2020-2035
  • Table 57: East Asia Market Value (USD Billion) Forecast by Distribution Channel, 2020-2035
  • Table 58: East Asia Market Volume (Million Units) Forecast by Distribution Channel, 2020-2035
  • Table 59: East Asia Market Value (USD Billion) Forecast by End User, 2020-2035
  • Table 60: East Asia Market Volume (Million Units) Forecast by End User, 2020-2035
  • Table 61: South Asia & Pacific Market Value (USD Billion) Forecast by Country, 2020-2035
  • Table 62: South Asia & Pacific Market Volume (Million Units) Forecast by Country, 2020-2035
  • Table 63: South Asia & Pacific Market Value (USD Billion) Forecast by Product Type, 2020-2035
  • Table 64: South Asia & Pacific Market Volume (Million Units) Forecast by Product Type, 2020-2035
  • Table 65: South Asia & Pacific Market Value (USD Billion) Forecast by Technology Type, 2020-2035
  • Table 66: South Asia & Pacific Market Volume (Million Units) Forecast by Technology Type, 2020-2035
  • Table 67: South Asia & Pacific Market Value (USD Billion) Forecast by Distribution Channel, 2020-2035
  • Table 68: South Asia & Pacific Market Volume (Million Units) Forecast by Distribution Channel, 2020-2035
  • Table 69: South Asia & Pacific Market Value (USD Billion) Forecast by End User, 2020-2035
  • Table 70: South Asia & Pacific Market Volume (Million Units) Forecast by End User, 2020-2035
  • Table 71: Middle East and Africa Market Value (USD Billion) Forecast by Country, 2020-2035
  • Table 72: Middle East and Africa Market Volume (Million Units) Forecast by Country, 2020-2035
  • Table 73: Middle East and Africa Market Value (USD Billion) Forecast by Product Type, 2020-2035
  • Table 74: Middle East and Africa Market Volume (Million Units) Forecast by Product Type, 2020-2035
  • Table 75: Middle East and Africa Market Value (USD Billion) Forecast by Technology Type, 2020-2035
  • Table 76: Middle East and Africa Market Volume (Million Units) Forecast by Technology Type, 2020-2035
  • Table 77: Middle East and Africa Market Value (USD Billion) Forecast by Distribution Channel, 2020-2035
  • Table 78: Middle East and Africa Market Volume (Million Units) Forecast by Distribution Channel, 2020-2035
  • Table 79: Middle East and Africa Market Value (USD Billion) Forecast by End User, 2020-2035
  • Table 80: Middle East and Africa Market Volume (Million Units) Forecast by End User, 2020-2035

List of Figures

  • Figure 1: Global Market Volume (Million Units) Forecast 2020-2035
  • Figure 2: Global Market Pricing Analysis
  • Figure 3: Global Market Value (USD Billion) Forecast 2020-2035
  • Figure 4: Global Market Value Share and BPS Analysis by Product Type, 2025 and 2035
  • Figure 5: Global Market Y-o-Y Growth Comparison by Product Type, 2025-2035
  • Figure 6: Global Market Attractiveness Analysis by Product Type
  • Figure 7: Global Market Value Share and BPS Analysis by Technology Type, 2025 and 2035
  • Figure 8: Global Market Y-o-Y Growth Comparison by Technology Type, 2025-2035
  • Figure 9: Global Market Attractiveness Analysis by Technology Type
  • Figure 10: Global Market Value Share and BPS Analysis by Distribution Channel, 2025 and 2035
  • Figure 11: Global Market Y-o-Y Growth Comparison by Distribution Channel, 2025-2035
  • Figure 12: Global Market Attractiveness Analysis by Distribution Channel
  • Figure 13: Global Market Value Share and BPS Analysis by End User, 2025 and 2035
  • Figure 14: Global Market Y-o-Y Growth Comparison by End User, 2025-2035
  • Figure 15: Global Market Attractiveness Analysis by End User
  • Figure 16: Global Market Value (USD Billion) Share and BPS Analysis by Region, 2025 and 2035
  • Figure 17: Global Market Y-o-Y Growth Comparison by Region, 2025-2035
  • Figure 18: Global Market Attractiveness Analysis by Region
  • Figure 19: North America Market Incremental $ Opportunity, 2025-2035
  • Figure 20: Latin America Market Incremental $ Opportunity, 2025-2035
  • Figure 21: Western Europe Market Incremental $ Opportunity, 2025-2035
  • Figure 22: Eastern Europe Market Incremental $ Opportunity, 2025-2035
  • Figure 23: East Asia Market Incremental $ Opportunity, 2025-2035
  • Figure 24: South Asia & Pacific Market Incremental $ Opportunity, 2025-2035
  • Figure 25: Middle East and Africa Market Incremental $ Opportunity, 2025-2035
  • Figure 26: North America Market Value Share and BPS Analysis by Country, 2025 and 2035
  • Figure 27: North America Market Value Share and BPS Analysis by Product Type, 2025 and 2035
  • Figure 28: North America Market Y-o-Y Growth Comparison by Product Type, 2025-2035
  • Figure 29: North America Market Attractiveness Analysis by Product Type
  • Figure 30: North America Market Value Share and BPS Analysis by Technology Type, 2025 and 2035
  • Figure 31: North America Market Y-o-Y Growth Comparison by Technology Type, 2025-2035
  • Figure 32: North America Market Attractiveness Analysis by Technology Type
  • Figure 33: North America Market Value Share and BPS Analysis by Distribution Channel, 2025 and 2035
  • Figure 34: North America Market Y-o-Y Growth Comparison by Distribution Channel, 2025-2035
  • Figure 35: North America Market Attractiveness Analysis by Distribution Channel
  • Figure 36: North America Market Value Share and BPS Analysis by End User, 2025 and 2035
  • Figure 37: North America Market Y-o-Y Growth Comparison by End User, 2025-2035
  • Figure 38: North America Market Attractiveness Analysis by End User
  • Figure 39: Latin America Market Value Share and BPS Analysis by Country, 2025 and 2035
  • Figure 40: Latin America Market Value Share and BPS Analysis by Product Type, 2025 and 2035
  • Figure 41: Latin America Market Y-o-Y Growth Comparison by Product Type, 2025-2035
  • Figure 42: Latin America Market Attractiveness Analysis by Product Type
  • Figure 43: Latin America Market Value Share and BPS Analysis by Technology Type, 2025 and 2035
  • Figure 44: Latin America Market Y-o-Y Growth Comparison by Technology Type, 2025-2035
  • Figure 45: Latin America Market Attractiveness Analysis by Technology Type
  • Figure 46: Latin America Market Value Share and BPS Analysis by Distribution Channel, 2025 and 2035
  • Figure 47: Latin America Market Y-o-Y Growth Comparison by Distribution Channel, 2025-2035
  • Figure 48: Latin America Market Attractiveness Analysis by Distribution Channel
  • Figure 49: Latin America Market Value Share and BPS Analysis by End User, 2025 and 2035
  • Figure 50: Latin America Market Y-o-Y Growth Comparison by End User, 2025-2035
  • Figure 51: Latin America Market Attractiveness Analysis by End User
  • Figure 52: Western Europe Market Value Share and BPS Analysis by Country, 2025 and 2035
  • Figure 53: Western Europe Market Value Share and BPS Analysis by Product Type, 2025 and 2035
  • Figure 54: Western Europe Market Y-o-Y Growth Comparison by Product Type, 2025-2035
  • Figure 55: Western Europe Market Attractiveness Analysis by Product Type
  • Figure 56: Western Europe Market Value Share and BPS Analysis by Technology Type, 2025 and 2035
  • Figure 57: Western Europe Market Y-o-Y Growth Comparison by Technology Type, 2025-2035
  • Figure 58: Western Europe Market Attractiveness Analysis by Technology Type
  • Figure 59: Western Europe Market Value Share and BPS Analysis by Distribution Channel, 2025 and 2035
  • Figure 60: Western Europe Market Y-o-Y Growth Comparison by Distribution Channel, 2025-2035
  • Figure 61: Western Europe Market Attractiveness Analysis by Distribution Channel
  • Figure 62: Western Europe Market Value Share and BPS Analysis by End User, 2025 and 2035
  • Figure 63: Western Europe Market Y-o-Y Growth Comparison by End User, 2025-2035
  • Figure 64: Western Europe Market Attractiveness Analysis by End User
  • Figure 65: Eastern Europe Market Value Share and BPS Analysis by Country, 2025 and 2035
  • Figure 66: Eastern Europe Market Value Share and BPS Analysis by Product Type, 2025 and 2035
  • Figure 67: Eastern Europe Market Y-o-Y Growth Comparison by Product Type, 2025-2035
  • Figure 68: Eastern Europe Market Attractiveness Analysis by Product Type
  • Figure 69: Eastern Europe Market Value Share and BPS Analysis by Technology Type, 2025 and 2035
  • Figure 70: Eastern Europe Market Y-o-Y Growth Comparison by Technology Type, 2025-2035
  • Figure 71: Eastern Europe Market Attractiveness Analysis by Technology Type
  • Figure 72: Eastern Europe Market Value Share and BPS Analysis by Distribution Channel, 2025 and 2035
  • Figure 73: Eastern Europe Market Y-o-Y Growth Comparison by Distribution Channel, 2025-2035
  • Figure 74: Eastern Europe Market Attractiveness Analysis by Distribution Channel
  • Figure 75: Eastern Europe Market Value Share and BPS Analysis by End User, 2025 and 2035
  • Figure 76: Eastern Europe Market Y-o-Y Growth Comparison by End User, 2025-2035
  • Figure 77: Eastern Europe Market Attractiveness Analysis by End User
  • Figure 78: East Asia Market Value Share and BPS Analysis by Country, 2025 and 2035
  • Figure 79: East Asia Market Value Share and BPS Analysis by Product Type, 2025 and 2035
  • Figure 80: East Asia Market Y-o-Y Growth Comparison by Product Type, 2025-2035
  • Figure 81: East Asia Market Attractiveness Analysis by Product Type
  • Figure 82: East Asia Market Value Share and BPS Analysis by Technology Type, 2025 and 2035
  • Figure 83: East Asia Market Y-o-Y Growth Comparison by Technology Type, 2025-2035
  • Figure 84: East Asia Market Attractiveness Analysis by Technology Type
  • Figure 85: East Asia Market Value Share and BPS Analysis by Distribution Channel, 2025 and 2035
  • Figure 86: East Asia Market Y-o-Y Growth Comparison by Distribution Channel, 2025-2035
  • Figure 87: East Asia Market Attractiveness Analysis by Distribution Channel
  • Figure 88: East Asia Market Value Share and BPS Analysis by End User, 2025 and 2035
  • Figure 89: East Asia Market Y-o-Y Growth Comparison by End User, 2025-2035
  • Figure 90: East Asia Market Attractiveness Analysis by End User
  • Figure 91: South Asia & Pacific Market Value Share and BPS Analysis by Country, 2025 and 2035
  • Figure 92: South Asia & Pacific Market Value Share and BPS Analysis by Product Type, 2025 and 2035
  • Figure 93: South Asia & Pacific Market Y-o-Y Growth Comparison by Product Type, 2025-2035
  • Figure 94: South Asia & Pacific Market Attractiveness Analysis by Product Type
  • Figure 95: South Asia & Pacific Market Value Share and BPS Analysis by Technology Type, 2025 and 2035
  • Figure 96: South Asia & Pacific Market Y-o-Y Growth Comparison by Technology Type, 2025-2035
  • Figure 97: South Asia & Pacific Market Attractiveness Analysis by Technology Type
  • Figure 98: South Asia & Pacific Market Value Share and BPS Analysis by Distribution Channel, 2025 and 2035
  • Figure 99: South Asia & Pacific Market Y-o-Y Growth Comparison by Distribution Channel, 2025-2035
  • Figure 100: South Asia & Pacific Market Attractiveness Analysis by Distribution Channel
  • Figure 101: South Asia & Pacific Market Value Share and BPS Analysis by End User, 2025 and 2035
  • Figure 102: South Asia & Pacific Market Y-o-Y Growth Comparison by End User, 2025-2035
  • Figure 103: South Asia & Pacific Market Attractiveness Analysis by End User
  • Figure 104: Middle East and Africa Market Value Share and BPS Analysis by Country, 2025 and 2035
  • Figure 105: Middle East and Africa Market Value Share and BPS Analysis by Product Type, 2025 and 2035
  • Figure 106: Middle East and Africa Market Y-o-Y Growth Comparison by Product Type, 2025-2035
  • Figure 107: Middle East and Africa Market Attractiveness Analysis by Product Type
  • Figure 108: Middle East and Africa Market Value Share and BPS Analysis by Technology Type, 2025 and 2035
  • Figure 109: Middle East and Africa Market Y-o-Y Growth Comparison by Technology Type, 2025-2035
  • Figure 110: Middle East and Africa Market Attractiveness Analysis by Technology Type
  • Figure 111: Middle East and Africa Market Value Share and BPS Analysis by Distribution Channel, 2025 and 2035
  • Figure 112: Middle East and Africa Market Y-o-Y Growth Comparison by Distribution Channel, 2025-2035
  • Figure 113: Middle East and Africa Market Attractiveness Analysis by Distribution Channel
  • Figure 114: Middle East and Africa Market Value Share and BPS Analysis by End User, 2025 and 2035
  • Figure 115: Middle East and Africa Market Y-o-Y Growth Comparison by End User, 2025-2035
  • Figure 116: Middle East and Africa Market Attractiveness Analysis by End User
  • Figure 117: Global Market - Tier Structure Analysis
  • Figure 118: Global Market - Company Share Analysis

Frequently Asked Questions

What is the projected industry value of the eldercare mobility device market in 2025?

The industry is projected to reach USD 11.1 billion in 2025.

What is the expected global CAGR for the eldercare mobility device market from 2025 to 2035?

The industry is expected to grow at a CAGR of 7.1% from 2025 to 2035.

Which segment is expected to dominate the eldercare mobility device market in 2025?

Wheelchairs are expected to capture 31.6% of the market in 2025.

Which region is forecasted to show significant growth in the eldercare mobility device market by 2035?

The Asia Pacific region, particularly India, is projected to register a CAGR of 9.6% from 2025 to 2035.

What is the forecasted industry value of the eldercare mobility device market by 2035?

The industry is projected to reach USD 22.0 billion by 2035.

Explore Similar Insights

Future Market Insights

Eldercare Mobility Device Market