Micro Mobility Market Size and Share Forecast Outlook 2025 to 2035

The global micro mobility market is estimated at USD 84.8 billion in 2025 and is projected to reach USD 287.8 billion by 2035, expanding at a CAGR of 13.0% during the forecast period. Growth is driven by rising demand for sustainable urban transportation, last-mile connectivity solutions, and the increasing adoption of shared e-bikes and e-scooters in metropolitan areas.

Bicycles account for 46.2% of the market share in 2025, supported by their versatility, affordability, and integration into both personal and shared mobility services. Rapid advancements in battery technology, extended range capabilities, and the popularity of subscription and leasing models are further accelerating adoption across both developed and emerging economies.

North America, Asia-Pacific, and Europe are the key growth regions, with governments introducing favorable policies, subsidies, and infrastructure investments to encourage low-emission transport and reduce congestion. In parallel, fleet operators are deploying smart mobility platforms and autonomous navigation technologies to enhance safety and efficiency.

Leading players in the micro mobility market include Giant Bicycles, Brompton Bicycle Ltd., FOCUS Bikes GmbH, Go Trax, Gyroor, Halo Board, Jetson, Yamaha Motors, and Micro Mobility Systems AG. Companies that focus on lightweight designs, ultra-fast charging, and integrated fleet management solutions are expected to strengthen their competitive positioning over the coming decade.

Overall, the micro mobility market is poised for transformative growth, underpinned by technological innovation, favorable regulatory frameworks, and a consumer-driven shift toward flexible, eco-friendly urban transportation.
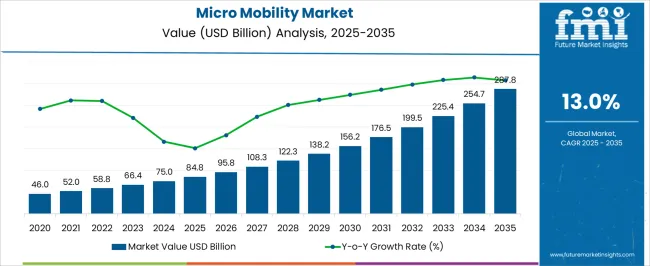
Quick Stats for Micro Mobility Market

  • Micro Mobility Market Value (2025): USD 84.8 billion
  • Micro Mobility Market Forecast Value (2035): USD 287.8 billion
  • Micro Mobility Market Forecast CAGR: 13.0%
  • Leading Segment in Micro Mobility Market in 2025: Bicycles (46.2%)
  • Key Growth Regions in Micro Mobility Market: North America, Asia-Pacific, Europe
  • Key Players in Micro Mobility Market: Giant Bicycles; Brompton Bicycle Ltd.; FOCUS Bikes GmbH; GOTRAX; Gyroor; Halo Board; Jetson (Jetson Electric); Yamaha Motor Co., Ltd.; Micro Mobility Systems AG

Micro Mobility Market Market Value Analysis

Micro Mobility Market Key Takeaways

Metric Value
Micro Mobility Market Estimated Value in (2025 E) USD 84.8 billion
Micro Mobility Market Forecast Value in (2035 F) USD 287.8 billion
Forecast CAGR (2025 to 2035) 13.0%

Why is the Micro Mobility Market Growing?

The micro mobility market is expanding rapidly as urban areas seek efficient, sustainable transportation solutions. Increasing concerns about traffic congestion and air pollution have driven cities and consumers to embrace compact and eco-friendly mobility options.

Advances in battery technology and lightweight materials have improved the practicality and appeal of electric micro mobility devices. Growing investments in dedicated bike lanes and shared mobility infrastructure have further boosted adoption.

The market outlook is promising with a strong focus on reducing carbon footprints and improving last-mile connectivity. Rising urbanization and the popularity of micromobility for short commutes are also key growth drivers. Segment growth is led by bicycles in the type category, electric propulsion systems, and users aged 15 to 30 who represent the primary consumer group adopting these solutions.

Segmental Analysis

The micro mobility market is segmented by type, propulsion, age group, sharing model, business model, and region. By type, the market is divided into bicycles, kick-bikes, skateboards, and hoverboards. In terms of propulsion, it is classified into electric and pedal-assist. Based on age group, the market is segmented into 15–30 years, 31–50 years, and above 50 years. By sharing model, it is divided into dock-less and docked systems. In terms of business model, the market is segmented into B2C and B2B. Regionally, the micro mobility industry is categorized into North America, Latin America, Western Europe, Eastern Europe, Balkan & Baltic Countries, Russia & Belarus, Central Asia, East Asia, South Asia & Pacific, and the Middle East & Africa.
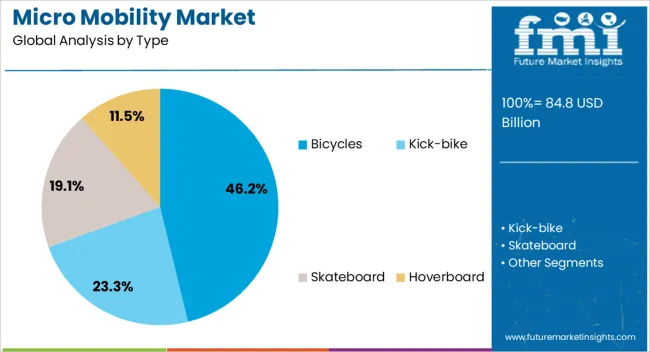
Insights into the Type Segment: Bicycles

Micro Mobility Market Analysis By Type

The Bicycles segment is projected to capture 46.2% of the micro mobility market revenue in 2025, continuing to lead among transport types. This growth reflects the enduring popularity of bicycles for personal mobility, combining affordability with health and environmental benefits.

Bicycles remain favored for their versatility, ease of use, and suitability for diverse urban terrains. Manufacturers have also introduced smart features and durable designs tailored to urban commuting.

The segment benefits from public initiatives promoting cycling and the expansion of cycling infrastructure. As cities encourage sustainable transportation modes, bicycles are expected to retain their dominant position in the micro mobility landscape.
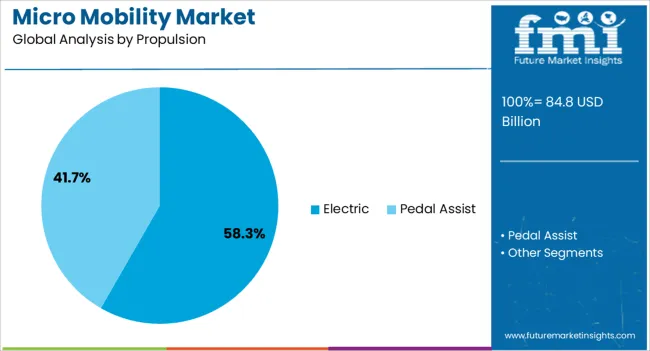
Insights into the Propulsion Segment: Electric

Micro Mobility Market Analysis By Propulsion

The Electric propulsion segment is forecasted to hold 58.3% of the micro mobility market revenue in 2025, establishing itself as the fastest-growing propulsion category. Advances in battery technology have increased range and reduced charging times, making electric micro mobility devices more practical for daily use.

Electric propulsion provides effortless commuting, particularly appealing to urban dwellers navigating hilly terrains or longer distances. Rising environmental awareness and government incentives for electric vehicles have accelerated market adoption.

Additionally, the integration of smart connectivity and safety features has enhanced user experience. The Electric segment is expected to continue leading as technology and infrastructure evolve.
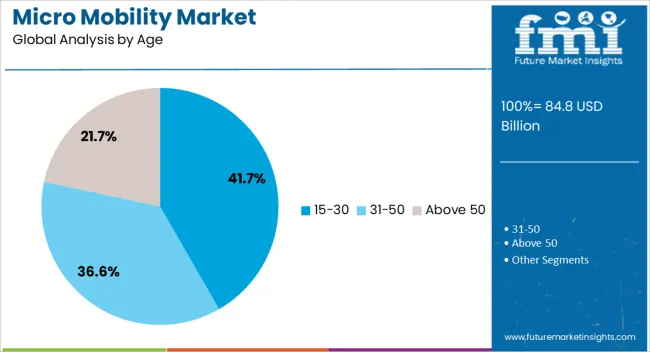
Insights into the Age Segment: 15-30

Micro Mobility Market Analysis By Age

The 15-30 age group is projected to represent 41.7% of the micro mobility market revenue in 2025, marking it as the largest user demographic. This segment includes young professionals and students who prioritize convenience, affordability, and environmental impact in their transportation choices.

The tech-savvy nature of this age group aligns with the adoption of app-based shared mobility services and electric micro mobility devices. Social trends emphasizing sustainability and urban lifestyle preferences have further supported growth in this demographic.

Marketing efforts and product designs targeted toward young users have reinforced their market dominance. As younger generations continue to embrace green mobility solutions, this age segment is expected to drive significant demand.

What are the Drivers, Restraints, and Key Trends of the Micro Mobility Market?

Micro mobility is expanding through a mix of policy support, improved infrastructure, and evolving consumer preferences. Fleet innovations and diversified usage patterns are strengthening its position in modern transport ecosystems.

Growing Adoption Across Commuting and Leisure

Expansion of micro mobility is strongly influenced by its suitability for short-distance travel and leisure purposes. Electric scooters, e-bikes, and compact personal vehicles are increasingly chosen for daily commutes due to lower operational costs and reduced travel times in congested zones. The convenience of on-demand rentals through mobile applications has improved accessibility for a broader user base. Tourists and recreational riders also contribute to the growing ridership, as lightweight transport options provide flexibility in exploring urban and suburban areas. Seasonal events and local festivals further accelerate usage rates. This diverse adoption pattern reinforces micro mobility as a viable alternative to conventional transport in both metropolitan hubs and smaller towns.

Infrastructure Expansion and Policy Support

Government-led investments in cycling lanes, docking stations, and charging infrastructure have created favorable conditions for micro mobility growth. Municipal transport policies are increasingly recognizing the benefits of integrating small-scale electric vehicles into existing transport systems. Pilot programs in multiple cities are testing traffic management solutions that accommodate both micro mobility and pedestrian movement. Regulatory frameworks focusing on safety standards, parking guidelines, and operational permits are shaping industry participation. These initiatives are encouraging private sector investment in fleet expansion and route optimization. The combination of public funding and supportive regulations is enhancing long-term commercial viability.

Advancements in Fleet Operations and Services

Service providers are deploying improved fleet management technologies to maximize efficiency and minimize downtime. The integration of IoT-enabled tracking systems, predictive maintenance tools, and real-time demand mapping allows operators to respond quickly to service needs. Battery-swapping stations are being introduced to reduce vehicle idle times, improving fleet availability. Subscription-based models and loyalty programs are boosting customer retention by offering predictable pricing and value-added services. Strategic partnerships with delivery companies and event organizers are expanding usage beyond individual commuters. These operational enhancements are enabling micro mobility companies to achieve higher asset utilization and stronger profit margins.

Shifting Consumer Preferences and Lifestyle Trends

Changing work patterns, including hybrid and flexible schedules, are influencing demand for adaptable transportation solutions like micro mobility. The appeal lies in cost efficiency, ease of parking, and quick accessibility compared to traditional modes. Younger demographics are driving adoption through app-based rentals, while older age groups are showing increased interest in comfortable, assisted-mobility devices. Social media influence and peer-to-peer recommendations are boosting brand visibility. Environmental awareness campaigns by service providers are aligning with user values without compromising convenience. As consumer trust in vehicle reliability grows, adoption is expected to become a habitual part of daily travel routines.
Analysis of Micro Mobility Market By Key Countries

Micro Mobility Market Cagr Analysis By Country

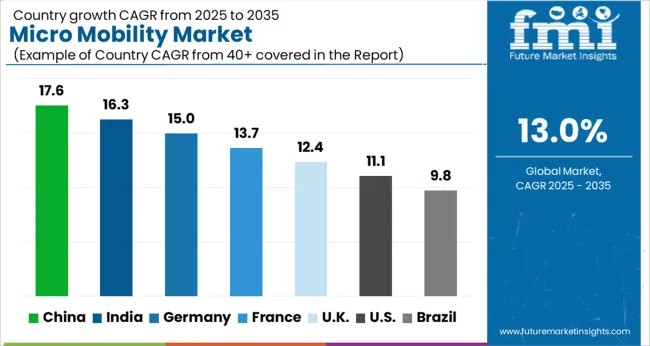
The micro mobility market is projected to grow at a global CAGR of 13.0% from 2025 to 2035, supported by increasing adoption of e-scooters, e-bikes, and compact electric vehicles for last-mile connectivity, enhanced fleet management technologies, and expanding infrastructure integration in urban and semi-urban regions. China leads with a CAGR of 17.6%, driven by large-scale deployment of shared mobility fleets, government-led green transport incentives, and rapid expansion of dedicated cycling and scooter lanes. India follows at 16.3%, supported by rising demand for affordable short-distance transport, integration with public transit hubs, and startup-led fleet expansion.

France records a CAGR of 13.7%, fueled by municipal investments in micro mobility infrastructure, tourism-driven seasonal demand, and adoption for commercial delivery purposes. The United Kingdom achieves 12.4%, reflecting increased policy support for low-emission vehicles, city-specific e-scooter trial expansions, and integration with smart city platforms. The United States posts a CAGR of 11.1%, influenced by suburban adoption, corporate mobility programs, and demand from recreational users. The study covers more than 40 regions, with these markets serving as strategic benchmarks for operational scalability, service diversification, and profitability optimization in the global micro mobility industry.

Assessment of Micro Mobility Market in China

China is projected to expand at a CAGR of 17.6% during 2025–2035, well above the global 13.0% baseline as shared e-bikes, e-scooters, and light cargo vehicles scale across tier-1 and tier-2 cities. In 2020–2024, growth near 14.8% was underpinned by dense app usage, integrated payment ecosystems, and early bike-lane buildouts. The faster pace over the next few years is linked to logistics partnerships, station linkages, and concessions that reward uptime and safety. Operators are standardizing swappable batteries and deploying predictive maintenance to stretch asset life. Tourism recovery and university demand add seasonal spikes, while domestic OEM capacity keeps hardware costs competitive and accelerates network densification.

  • City concessions favor reliable, safety-audited fleets.
  • Swappable batteries lift utilization and uptime.
  • University and tourism demand smooth seasonality.

Demand Forecast for Micro Mobility Market in India

India is projected to post a 16.3% CAGR in 2025–2035, reflecting rapid adoption across metro corridors and expanding suburban townships. The 2020–2024 phase advanced around 13.9%, led by budget e-bikes for commuters, gig-delivery riders, and campus schemes. Faster growth ahead stems from multimodal hubs at metro stations, state-level parking policies, and rising corporate mobility subscriptions that bundle helmets, insurance, and maintenance. Domestic assembly of frames, powertrains, and IoT modules is lowering total cost of ownership for operators. Tier-2/3 cities are opening tendered routes, and lightweight cargo variants are gaining traction for Kirana and pharmacy deliveries, widening the revenue base for platforms and OEMs.
  • Metro hub linkages increase first/last-mile rides.
  • Local assembly reduces capex and spare costs.
  • Light cargo models expand delivery use cases.

Market Outlook for Micro Mobility in France

Micro Mobility Market Europe Country Market Share Analysis, 2025 & 2035

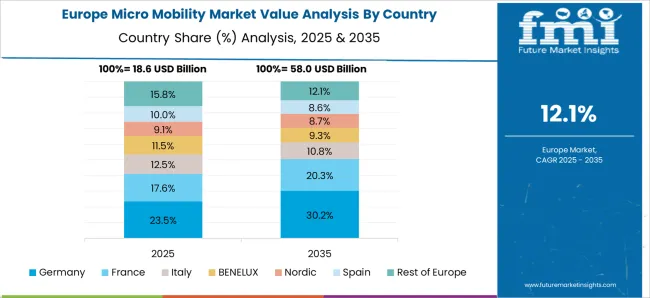
France is expected to grow at 13.7% during 2025–2035 as municipalities standardize parking bays, enforce speed/helmet norms, and expand protected lanes. The 2020–2024 period tracked roughly 11.7%, powered by commuter e-bike incentives and tourism loops in major cities. The step-up is driven by employer purchase subsidies, VAT-friendly leasing for fleets, and integration of delivery-grade e-bikes for grocery and Q-commerce operators. Platform economics are improving through battery-swap networks and depot consolidation, which reduce deadhead kilometers. Data-sharing agreements with cities are cutting impound risks and improving curb compliance, supporting steadier utilization across seasons and strengthening operator margins in dense urban cores.

  • Employer subsidies catalyze commuter e-bike uptake.
  • Battery-swap grids reduce downtime materially.
  • City data-sharing cuts impound and fines.

Growth Analysis for Micro Mobility in the UK

The United Kingdom is forecast to reach 12.4% CAGR in 2025–2035, while the 2020–2024 period is estimated at 10.1%. The earlier rate reflects limited e-scooter trials, fragmented local rules, supply chain delays, and higher import costs that dampened fleet refresh. The rise to 12.4% is explained by broader trial extensions, clearer national guidance on rental operations, more protected cycling corridors, and enterprise subscriptions that bundle maintenance and theft coverage. Delivery platforms are standardizing e-bike fleets, lifting weekday utilization. Unit economics improve through multi-gig connectivity for IoT locks, better battery density, and depot-based swaps. These factors support higher rides per vehicle per day and steadier revenue per kilometer.
  • Trial expansions and clearer rules widen coverage.
  • Depot-swap models boost fleet availability.
  • Enterprise subscriptions stabilize weekday demand.

Micro Mobility Expansion in the USA

Micro Mobility Market Country Value Analysis

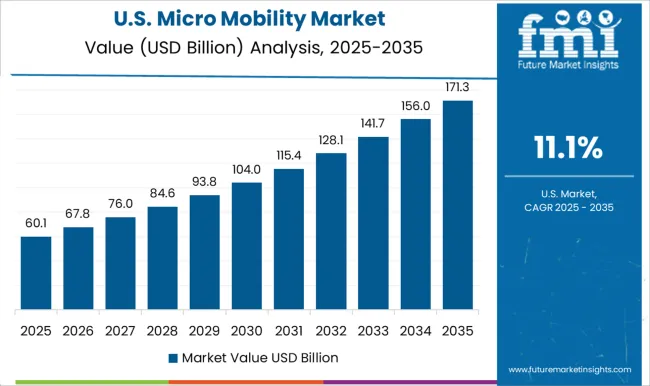
The United States is projected at 11.1% CAGR for 2025–2035 after advancing about 9.6% in 2020–2024. Early momentum centered on college towns and tourist districts with modest fleet sizes. The next leg is guided by suburban adoption, corporate mobility stipends, and logistics partnerships for short-radius delivery. City contracts increasingly reward safety telematics and parking compliance, pushing platforms to integrate geofencing and sidewalk detection. Hardware resilience is improving via modular frames and vandal-resistant components, extending service intervals. Bundled insurance and clearer curb-management APIs with municipalities are lowering operational risk, helping operators unlock multi-year concessions and consistent asset utilization across seasons.
  • Corporate stipends increase commuter ride frequency.
  • Safety telematics strengthen city contract scores.
  • Modular hardware reduces lifecycle costs.

Competitive Landscape of Micro Mobility Market

Micro Mobility Market Analysis By Company

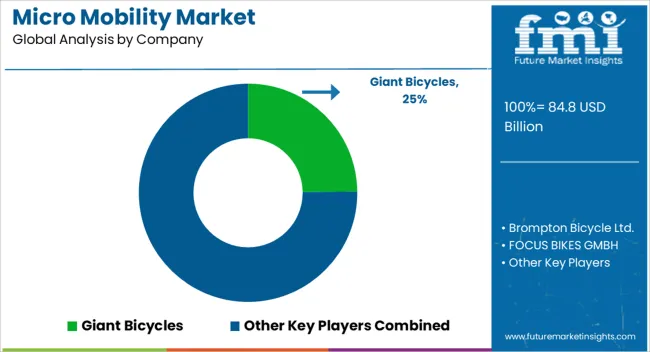
The micro mobility market is defined by intense competition among global and regional manufacturers offering electric bicycles, scooters, boards, and compact urban transport solutions. Giant Bicycles maintains a leadership role through extensive product diversification in e-bikes, city bikes, and performance bicycles, supported by strong dealer networks in Asia, Europe, and North America.

Brompton Bicycle Ltd. is recognized for its premium folding bicycles, appealing to commuters seeking portability and high-quality engineering. FOCUS BIKES GMBH delivers performance-oriented e-bikes and commuter models with advanced drivetrain systems, targeting both recreational and daily-use riders. Go Trax focuses on affordable electric scooters and hoverboards, appealing to entry-level consumers in urban markets. Gyroor is expanding through innovative electric scooters and balance boards, emphasizing portability and modern design.

Halo Board stands out in the electric skateboard segment with lightweight carbon fiber builds and high-speed capabilities. Jetson offers a diverse portfolio of electric scooters, e-bikes, and hoverboards aimed at youth and recreational riders. Yamaha Motors leverages its global manufacturing scale to produce high-performance electric bicycles integrated with proprietary drive systems.

Scope of the Report

Item Value
Quantitative Units USD Billion
Type Bicycles, Kick-bike, Skateboard, and Hoverboard
Propulsion Electric and Pedal Assist
Age 15-30, 31-50, and Above 50
Sharing Dock-less and Docked
Business Model B2C and B2B
Regions Covered North America, Europe, Asia-Pacific, Latin America, Middle East & Africa
Country Covered United States, Canada, Germany, France, United Kingdom, China, Japan, India, Brazil, South Africa
Key Companies Profiled Giant Bicycles; Brompton Bicycle Ltd.; FOCUS Bikes GmbH; GOTRAX; Gyroor; Halo Board; Jetson (Jetson Electric); Yamaha Motor Co., Ltd.; Micro Mobility Systems AG.
Additional Attributes Dollar sales, share, demand trends by vehicle type, regional adoption patterns, competitive landscape, pricing benchmarks, regulatory impacts, infrastructure readiness, and consumer usage preferences.

Micro Mobility Market by Segments

Type:

  • Bicycles
  • Kick-bike
  • Skateboard
  • Hoverboard

Propulsion:

  • Electric
  • Pedal Assist

Age:

  • 15-30
  • 31-50
  • Above 50

Sharing:

  • Dock-less
  • Docked

Business Model:

  • B2C
  • B2B

Region:

  • North America
    • USA
    • Canada
    • Mexico
  • Latin America
    • Brazil
    • Chile
    • Rest of Latin America
  • Western Europe
    • Germany
    • UK
    • Italy
    • Spain
    • France
    • Nordic
    • BENELUX
    • Rest of Western Europe
  • Eastern Europe
    • Russia
    • Poland
    • Hungary
    • Balkan & Baltic
    • Rest of Eastern Europe
  • East Asia
    • China
    • Japan
    • South Korea
  • South Asia and Pacific
    • India
    • ASEAN
    • Australia & New Zealand
    • Rest of South Asia and Pacific
  • Middle East & Africa
    • Kingdom of Saudi Arabia
    • Other GCC Countries
    • Turkiye
    • South Africa
    • Other African Union
    • Rest of Middle East & Africa

Table of Content

  1. Executive Summary
    • Global Market Outlook
    • Demand-side Trends
    • Supply-side Trends
    • Technology Roadmap Analysis
    • Analysis and Recommendations
  2. Market Overview
    • Market Coverage / Taxonomy
    • Market Definition / Scope / Limitations
  3. Market Background
    • Market Dynamics
      • Drivers
      • Restraints
      • Opportunity
      • Trends
    • Scenario Forecast
      • Demand in Optimistic Scenario
      • Demand in Likely Scenario
      • Demand in Conservative Scenario
    • Opportunity Map Analysis
    • Product Life Cycle Analysis
    • Supply Chain Analysis
    • Investment Feasibility Matrix
    • Value Chain Analysis
    • PESTLE and Porter’s Analysis
    • Regulatory Landscape
    • Regional Parent Market Outlook
    • Production and Consumption Statistics
    • Import and Export Statistics
  4. Global Micro Mobility Market Analysis 2020-2024 and Forecast, 2025-2035
    • Historical Market Size Value (USD Mn) Analysis, 2020-2024
    • Current and Future Market Size Value (USD Mn) Projections, 2025-2035
      • Y-o-Y Growth Trend Analysis
      • Absolute $ Opportunity Analysis
  5. Global Micro Mobility Market Pricing Analysis 2020-2024 and Forecast 2025-2035
  6. Global Micro Mobility Market Analysis 2020-2024 and Forecast 2025-2035, By Type
    • Introduction / Key Findings
    • Historical Market Size Value (USD Mn) Analysis By Type , 2020-2024
    • Current and Future Market Size Value (USD Mn) Analysis and Forecast By Type , 2025-2035
      • Bicycles
      • Kick-bike
      • Skateboard
      • Hoverboard
    • Y-o-Y Growth Trend Analysis By Type , 2020-2024
    • Absolute $ Opportunity Analysis By Type , 2025-2035
  7. Global Micro Mobility Market Analysis 2020-2024 and Forecast 2025-2035, By Propulsion
    • Introduction / Key Findings
    • Historical Market Size Value (USD Mn) Analysis By Propulsion, 2020-2024
    • Current and Future Market Size Value (USD Mn) Analysis and Forecast By Propulsion, 2025-2035
      • Electric
      • Pedal Assist
    • Y-o-Y Growth Trend Analysis By Propulsion, 2020-2024
    • Absolute $ Opportunity Analysis By Propulsion, 2025-2035
  8. Global Micro Mobility Market Analysis 2020-2024 and Forecast 2025-2035, By Age
    • Introduction / Key Findings
    • Historical Market Size Value (USD Mn) Analysis By Age, 2020-2024
    • Current and Future Market Size Value (USD Mn) Analysis and Forecast By Age, 2025-2035
      • 15-30
      • 31-50
      • Above 50
    • Y-o-Y Growth Trend Analysis By Age, 2020-2024
    • Absolute $ Opportunity Analysis By Age, 2025-2035
  9. Global Micro Mobility Market Analysis 2020-2024 and Forecast 2025-2035, By Sharing
    • Introduction / Key Findings
    • Historical Market Size Value (USD Mn) Analysis By Sharing, 2020-2024
    • Current and Future Market Size Value (USD Mn) Analysis and Forecast By Sharing, 2025-2035
      • Dock-less
      • Docked
    • Y-o-Y Growth Trend Analysis By Sharing, 2020-2024
    • Absolute $ Opportunity Analysis By Sharing, 2025-2035
  10. Global Micro Mobility Market Analysis 2020-2024 and Forecast 2025-2035, By Business Model
    • Introduction / Key Findings
    • Historical Market Size Value (USD Mn) Analysis By Business Model, 2020-2024
    • Current and Future Market Size Value (USD Mn) Analysis and Forecast By Business Model, 2025-2035
      • B2C
      • B2B
    • Y-o-Y Growth Trend Analysis By Business Model, 2020-2024
    • Absolute $ Opportunity Analysis By Business Model, 2025-2035
  11. Global Micro Mobility Market Analysis 2020-2024 and Forecast 2025-2035, By Region
    • Introduction
    • Historical Market Size Value (USD Mn) Analysis By Region, 2020-2024
    • Current Market Size Value (USD Mn) Analysis and Forecast By Region, 2025-2035
      • North America
      • Latin America
      • Western Europe
      • Eastern Europe
      • East Asia
      • South Asia and Pacific
      • Middle East & Africa
    • Market Attractiveness Analysis By Region
  12. North America Micro Mobility Market Analysis 2020-2024 and Forecast 2025-2035, By Country
    • Historical Market Size Value (USD Mn) Trend Analysis By Market Taxonomy, 2020-2024
    • Market Size Value (USD Mn) Forecast By Market Taxonomy, 2025-2035
      • By Country
        • USA
        • Canada
        • Mexico
      • By Type
      • By Propulsion
      • By Age
      • By Sharing
      • By Business Model
    • Market Attractiveness Analysis
      • By Country
      • By Type
      • By Propulsion
      • By Age
      • By Sharing
      • By Business Model
    • Key Takeaways
  13. Latin America Micro Mobility Market Analysis 2020-2024 and Forecast 2025-2035, By Country
    • Historical Market Size Value (USD Mn) Trend Analysis By Market Taxonomy, 2020-2024
    • Market Size Value (USD Mn) Forecast By Market Taxonomy, 2025-2035
      • By Country
        • Brazil
        • Chile
        • Rest of Latin America
      • By Type
      • By Propulsion
      • By Age
      • By Sharing
      • By Business Model
    • Market Attractiveness Analysis
      • By Country
      • By Type
      • By Propulsion
      • By Age
      • By Sharing
      • By Business Model
    • Key Takeaways
  14. Western Europe Micro Mobility Market Analysis 2020-2024 and Forecast 2025-2035, By Country
    • Historical Market Size Value (USD Mn) Trend Analysis By Market Taxonomy, 2020-2024
    • Market Size Value (USD Mn) Forecast By Market Taxonomy, 2025-2035
      • By Country
        • Germany
        • UK
        • Italy
        • Spain
        • France
        • Nordic
        • BENELUX
        • Rest of Western Europe
      • By Type
      • By Propulsion
      • By Age
      • By Sharing
      • By Business Model
    • Market Attractiveness Analysis
      • By Country
      • By Type
      • By Propulsion
      • By Age
      • By Sharing
      • By Business Model
    • Key Takeaways
  15. Eastern Europe Micro Mobility Market Analysis 2020-2024 and Forecast 2025-2035, By Country
    • Historical Market Size Value (USD Mn) Trend Analysis By Market Taxonomy, 2020-2024
    • Market Size Value (USD Mn) Forecast By Market Taxonomy, 2025-2035
      • By Country
        • Russia
        • Poland
        • Hungary
        • Balkan & Baltic
        • Rest of Eastern Europe
      • By Type
      • By Propulsion
      • By Age
      • By Sharing
      • By Business Model
    • Market Attractiveness Analysis
      • By Country
      • By Type
      • By Propulsion
      • By Age
      • By Sharing
      • By Business Model
    • Key Takeaways
  16. East Asia Micro Mobility Market Analysis 2020-2024 and Forecast 2025-2035, By Country
    • Historical Market Size Value (USD Mn) Trend Analysis By Market Taxonomy, 2020-2024
    • Market Size Value (USD Mn) Forecast By Market Taxonomy, 2025-2035
      • By Country
        • China
        • Japan
        • South Korea
      • By Type
      • By Propulsion
      • By Age
      • By Sharing
      • By Business Model
    • Market Attractiveness Analysis
      • By Country
      • By Type
      • By Propulsion
      • By Age
      • By Sharing
      • By Business Model
    • Key Takeaways
  17. South Asia and Pacific Micro Mobility Market Analysis 2020-2024 and Forecast 2025-2035, By Country
    • Historical Market Size Value (USD Mn) Trend Analysis By Market Taxonomy, 2020-2024
    • Market Size Value (USD Mn) Forecast By Market Taxonomy, 2025-2035
      • By Country
        • India
        • ASEAN
        • Australia & New Zealand
        • Rest of South Asia and Pacific
      • By Type
      • By Propulsion
      • By Age
      • By Sharing
      • By Business Model
    • Market Attractiveness Analysis
      • By Country
      • By Type
      • By Propulsion
      • By Age
      • By Sharing
      • By Business Model
    • Key Takeaways
  18. Middle East & Africa Micro Mobility Market Analysis 2020-2024 and Forecast 2025-2035, By Country
    • Historical Market Size Value (USD Mn) Trend Analysis By Market Taxonomy, 2020-2024
    • Market Size Value (USD Mn) Forecast By Market Taxonomy, 2025-2035
      • By Country
        • Kingdom of Saudi Arabia
        • Other GCC Countries
        • Turkiye
        • South Africa
        • Other African Union
        • Rest of Middle East & Africa
      • By Type
      • By Propulsion
      • By Age
      • By Sharing
      • By Business Model
    • Market Attractiveness Analysis
      • By Country
      • By Type
      • By Propulsion
      • By Age
      • By Sharing
      • By Business Model
    • Key Takeaways
  19. Key Countries Micro Mobility Market Analysis
    • USA
      • Pricing Analysis
      • Market Share Analysis, 2024
        • By Type
        • By Propulsion
        • By Age
        • By Sharing
        • By Business Model
    • Canada
      • Pricing Analysis
      • Market Share Analysis, 2024
        • By Type
        • By Propulsion
        • By Age
        • By Sharing
        • By Business Model
    • Mexico
      • Pricing Analysis
      • Market Share Analysis, 2024
        • By Type
        • By Propulsion
        • By Age
        • By Sharing
        • By Business Model
    • Brazil
      • Pricing Analysis
      • Market Share Analysis, 2024
        • By Type
        • By Propulsion
        • By Age
        • By Sharing
        • By Business Model
    • Chile
      • Pricing Analysis
      • Market Share Analysis, 2024
        • By Type
        • By Propulsion
        • By Age
        • By Sharing
        • By Business Model
    • Germany
      • Pricing Analysis
      • Market Share Analysis, 2024
        • By Type
        • By Propulsion
        • By Age
        • By Sharing
        • By Business Model
    • UK
      • Pricing Analysis
      • Market Share Analysis, 2024
        • By Type
        • By Propulsion
        • By Age
        • By Sharing
        • By Business Model
    • Italy
      • Pricing Analysis
      • Market Share Analysis, 2024
        • By Type
        • By Propulsion
        • By Age
        • By Sharing
        • By Business Model
    • Spain
      • Pricing Analysis
      • Market Share Analysis, 2024
        • By Type
        • By Propulsion
        • By Age
        • By Sharing
        • By Business Model
    • France
      • Pricing Analysis
      • Market Share Analysis, 2024
        • By Type
        • By Propulsion
        • By Age
        • By Sharing
        • By Business Model
    • India
      • Pricing Analysis
      • Market Share Analysis, 2024
        • By Type
        • By Propulsion
        • By Age
        • By Sharing
        • By Business Model
    • ASEAN
      • Pricing Analysis
      • Market Share Analysis, 2024
        • By Type
        • By Propulsion
        • By Age
        • By Sharing
        • By Business Model
    • Australia & New Zealand
      • Pricing Analysis
      • Market Share Analysis, 2024
        • By Type
        • By Propulsion
        • By Age
        • By Sharing
        • By Business Model
    • China
      • Pricing Analysis
      • Market Share Analysis, 2024
        • By Type
        • By Propulsion
        • By Age
        • By Sharing
        • By Business Model
    • Japan
      • Pricing Analysis
      • Market Share Analysis, 2024
        • By Type
        • By Propulsion
        • By Age
        • By Sharing
        • By Business Model
    • South Korea
      • Pricing Analysis
      • Market Share Analysis, 2024
        • By Type
        • By Propulsion
        • By Age
        • By Sharing
        • By Business Model
    • Russia
      • Pricing Analysis
      • Market Share Analysis, 2024
        • By Type
        • By Propulsion
        • By Age
        • By Sharing
        • By Business Model
    • Poland
      • Pricing Analysis
      • Market Share Analysis, 2024
        • By Type
        • By Propulsion
        • By Age
        • By Sharing
        • By Business Model
    • Hungary
      • Pricing Analysis
      • Market Share Analysis, 2024
        • By Type
        • By Propulsion
        • By Age
        • By Sharing
        • By Business Model
    • Kingdom of Saudi Arabia
      • Pricing Analysis
      • Market Share Analysis, 2024
        • By Type
        • By Propulsion
        • By Age
        • By Sharing
        • By Business Model
    • Turkiye
      • Pricing Analysis
      • Market Share Analysis, 2024
        • By Type
        • By Propulsion
        • By Age
        • By Sharing
        • By Business Model
    • South Africa
      • Pricing Analysis
      • Market Share Analysis, 2024
        • By Type
        • By Propulsion
        • By Age
        • By Sharing
        • By Business Model
  20. Market Structure Analysis
    • Competition Dashboard
    • Competition Benchmarking
    • Market Share Analysis of Top Players
      • By Regional
      • By Type
      • By Propulsion
      • By Age
      • By Sharing
      • By Business Model
  21. Competition Analysis
    • Competition Deep Dive
      • Giant Bicycles
        • Overview
        • Product Portfolio
        • Profitability by Market Segments (Product/Age /Sales Channel/Region)
        • Sales Footprint
        • Strategy Overview
          • Marketing Strategy
          • Product Strategy
          • Channel Strategy
      • Brompton Bicycle Ltd.
      • FOCUS BIKES GMBH
      • Go Trax
      • Gyroor
      • Halo Board
      • Jetson
      • Yamaha Motors
      • Micro Mobility Systems AG.
  22. Assumptions & Acronyms Used
  23. Research Methodology

List of Tables

  • Table 1: Global Micro Mobility Market Value (USD Mn) Forecast by Region, 2020-2035
  • Table 2: Global Micro Mobility Market Value (USD Mn) Forecast by Type , 2020-2035
  • Table 3: Global Micro Mobility Market Value (USD Mn) Forecast by Propulsion, 2020-2035
  • Table 4: Global Micro Mobility Market Value (USD Mn) Forecast by Age, 2020-2035
  • Table 5: Global Micro Mobility Market Value (USD Mn) Forecast by Sharing, 2020-2035
  • Table 6: Global Micro Mobility Market Value (USD Mn) Forecast by Business Model, 2020-2035
  • Table 7: North America Micro Mobility Market Value (USD Mn) Forecast by Country, 2020-2035
  • Table 8: North America Micro Mobility Market Value (USD Mn) Forecast by Type , 2020-2035
  • Table 9: North America Micro Mobility Market Value (USD Mn) Forecast by Propulsion, 2020-2035
  • Table 10: North America Micro Mobility Market Value (USD Mn) Forecast by Age, 2020-2035
  • Table 11: North America Micro Mobility Market Value (USD Mn) Forecast by Sharing, 2020-2035
  • Table 12: North America Micro Mobility Market Value (USD Mn) Forecast by Business Model, 2020-2035
  • Table 13: Latin America Micro Mobility Market Value (USD Mn) Forecast by Country, 2020-2035
  • Table 14: Latin America Micro Mobility Market Value (USD Mn) Forecast by Type , 2020-2035
  • Table 15: Latin America Micro Mobility Market Value (USD Mn) Forecast by Propulsion, 2020-2035
  • Table 16: Latin America Micro Mobility Market Value (USD Mn) Forecast by Age, 2020-2035
  • Table 17: Latin America Micro Mobility Market Value (USD Mn) Forecast by Sharing, 2020-2035
  • Table 18: Latin America Micro Mobility Market Value (USD Mn) Forecast by Business Model, 2020-2035
  • Table 19: Western Europe Micro Mobility Market Value (USD Mn) Forecast by Country, 2020-2035
  • Table 20: Western Europe Micro Mobility Market Value (USD Mn) Forecast by Type , 2020-2035
  • Table 21: Western Europe Micro Mobility Market Value (USD Mn) Forecast by Propulsion, 2020-2035
  • Table 22: Western Europe Micro Mobility Market Value (USD Mn) Forecast by Age, 2020-2035
  • Table 23: Western Europe Micro Mobility Market Value (USD Mn) Forecast by Sharing, 2020-2035
  • Table 24: Western Europe Micro Mobility Market Value (USD Mn) Forecast by Business Model, 2020-2035
  • Table 25: Eastern Europe Micro Mobility Market Value (USD Mn) Forecast by Country, 2020-2035
  • Table 26: Eastern Europe Micro Mobility Market Value (USD Mn) Forecast by Type , 2020-2035
  • Table 27: Eastern Europe Micro Mobility Market Value (USD Mn) Forecast by Propulsion, 2020-2035
  • Table 28: Eastern Europe Micro Mobility Market Value (USD Mn) Forecast by Age, 2020-2035
  • Table 29: Eastern Europe Micro Mobility Market Value (USD Mn) Forecast by Sharing, 2020-2035
  • Table 30: Eastern Europe Micro Mobility Market Value (USD Mn) Forecast by Business Model, 2020-2035
  • Table 31: East Asia Micro Mobility Market Value (USD Mn) Forecast by Country, 2020-2035
  • Table 32: East Asia Micro Mobility Market Value (USD Mn) Forecast by Type , 2020-2035
  • Table 33: East Asia Micro Mobility Market Value (USD Mn) Forecast by Propulsion, 2020-2035
  • Table 34: East Asia Micro Mobility Market Value (USD Mn) Forecast by Age, 2020-2035
  • Table 35: East Asia Micro Mobility Market Value (USD Mn) Forecast by Sharing, 2020-2035
  • Table 36: East Asia Micro Mobility Market Value (USD Mn) Forecast by Business Model, 2020-2035
  • Table 37: South Asia and Pacific Micro Mobility Market Value (USD Mn) Forecast by Country, 2020-2035
  • Table 38: South Asia and Pacific Micro Mobility Market Value (USD Mn) Forecast by Type , 2020-2035
  • Table 39: South Asia and Pacific Micro Mobility Market Value (USD Mn) Forecast by Propulsion, 2020-2035
  • Table 40: South Asia and Pacific Micro Mobility Market Value (USD Mn) Forecast by Age, 2020-2035
  • Table 41: South Asia and Pacific Micro Mobility Market Value (USD Mn) Forecast by Sharing, 2020-2035
  • Table 42: South Asia and Pacific Micro Mobility Market Value (USD Mn) Forecast by Business Model, 2020-2035
  • Table 43: Middle East & Africa Micro Mobility Market Value (USD Mn) Forecast by Country, 2020-2035
  • Table 44: Middle East & Africa Micro Mobility Market Value (USD Mn) Forecast by Type , 2020-2035
  • Table 45: Middle East & Africa Micro Mobility Market Value (USD Mn) Forecast by Propulsion, 2020-2035
  • Table 46: Middle East & Africa Micro Mobility Market Value (USD Mn) Forecast by Age, 2020-2035
  • Table 47: Middle East & Africa Micro Mobility Market Value (USD Mn) Forecast by Sharing, 2020-2035
  • Table 48: Middle East & Africa Micro Mobility Market Value (USD Mn) Forecast by Business Model, 2020-2035

List of Figures

  • Figure 1: Global Micro Mobility Market Pricing Analysis
  • Figure 2: Global Micro Mobility Market Value (USD Mn) Forecast 2020–2035
  • Figure 3: Global Micro Mobility Market Value (USD Mn) Share and BPS Analysis by Region, 2025 and 2035
  • Figure 4: Global Micro Mobility Market Y-o-Y Growth Comparison by Region, 2025–2035
  • Figure 5: Global Micro Mobility Market Attractiveness Analysis by Region
  • Figure 6: North America Micro Mobility Market Incremental Dollar Opportunity, 2025–2035
  • Figure 7: Latin America Micro Mobility Market Incremental Dollar Opportunity, 2025–2035
  • Figure 8: Western Europe Micro Mobility Market Incremental Dollar Opportunity, 2025–2035
  • Figure 9: Eastern Europe Micro Mobility Market Incremental Dollar Opportunity, 2025–2035
  • Figure 10: East Asia Micro Mobility Market Incremental Dollar Opportunity, 2025–2035
  • Figure 11: South Asia and Pacific Micro Mobility Market Incremental Dollar Opportunity, 2025–2035
  • Figure 12: Middle East & Africa Micro Mobility Market Incremental Dollar Opportunity, 2025–2035
  • Figure 13: North America Micro Mobility Market Value Share and BPS Analysis by Country, 2025 and 2035
  • Figure 14: Latin America Micro Mobility Market Value Share and BPS Analysis by Country, 2025 and 2035
  • Figure 15: Western Europe Micro Mobility Market Value Share and BPS Analysis by Country, 2025 and 2035
  • Figure 16: Eastern Europe Micro Mobility Market Value Share and BPS Analysis by Country, 2025 and 2035
  • Figure 17: East Asia Micro Mobility Market Value Share and BPS Analysis by Country, 2025 and 2035
  • Figure 18: South Asia and Pacific Micro Mobility Market Value Share and BPS Analysis by Country, 2025 and 2035
  • Figure 19: Middle East & Africa Micro Mobility Market Value Share and BPS Analysis by Country, 2025 and 2035
  • Figure 20: Global Micro Mobility Market – Tier Structure Analysis
  • Figure 21: Global Micro Mobility Market – Company Share Analysis

Frequently Asked Questions

How big is the micro mobility market in 2025?

The global micro mobility market is estimated to be valued at USD 84.8 billion in 2025.

What will be the size of micro mobility market in 2035?

The market size for the micro mobility market is projected to reach USD 287.8 billion by 2035.

How much will be the micro mobility market growth between 2025 and 2035?

The micro mobility market is expected to grow at a 13.0% CAGR between 2025 and 2035.

What are the key product types in the micro mobility market?

The key product types in micro mobility market are bicycles, kick-bike, skateboard and hoverboard.

Which propulsion segment to contribute significant share in the micro mobility market in 2025?

In terms of propulsion, electric segment to command 58.3% share in the micro mobility market in 2025.

Explore Similar Insights

Future Market Insights

Micro Mobility Market

Chat With MaRIA

Chat With

MaRIA

Hi There, I am MaRIA, Your Market Research Intelligence Assistant. How may I help you?