Reports

- Global Locations -

Headquarters

Future Market Insights, Inc.

Christiana Corporate, 200
Continental Drive, Suite 401,
Newark, Delaware - 19713,
United States

T: +1-845-579-5705

Americas

Future Market Insights, Inc.

616 Corporate Way, Suite 2-9018,
Valley Cottage, NY 10989, United States

T: +1-347-918-3531

MEA

Future Market Insights

1602-6 Jumeirah Bay X2 Tower, Plot No: JLT-PH2-X2A,
Jumeirah Lakes Towers, Dubai,
United Arab Emirates

Europe

Future Market Insights

3rd Floor, 207 Regent Street,
W1B 3HH London
United Kingdom

T: + 44 (0) 20 8123 9659
D: +44 (0) 20 3287 4268

Asia Pacific

Future Market Insights

IndiaLand Global Tech Park, Unit UG-1, Behind Grand HighStreet, Phase 1, Hinjawadi, MH, Pune – 411057, India

Commercial Walk in Freezer Market (2023 to 2033)

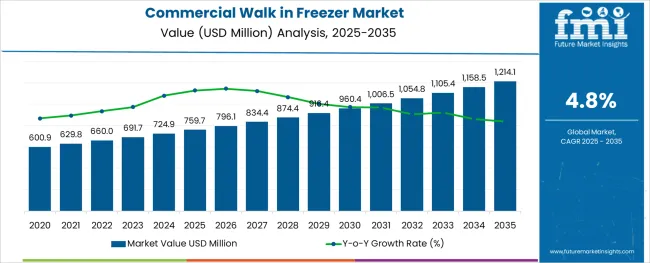
The commercial walk-in freezer market size is estimated to be valued at US$ 691.68 million in 2023 and is projected to reach US$ 1,105.40 million by 2033, growing at a CAGR of 4.8% from 2023 to 2033.

The key factors supporting the growth of the commercial walk in freezer market are:

  • The use of natural refrigerants, improved efficiency, developments in the food sector, and rising demand for ready-to-eat food, egg, meat, and other animal-derived products.
  • Commercial walk in freezers is cold storage devices utilized in commercial settings.
  • In grocery shops, convenience stores, specialized food stores, and supermarkets, reach-in refrigerators and freezers are typical.
  • The walk in refrigerators and freezers used in restaurants and cafeterias are examples of commercial walk in freezer equipment.
  • Vegetables, fruits, meat, and other similar goods are preserved using commercial walk in freezer equipment by maintaining a temperature between 30°C and 40°C, extending the shelf life of the product.

To prevent the growth of germs, certain refrigeration equipment is designed to quickly reduce the temperature of hot food from around 90 degrees Celsius to as low as 30 degrees Celsius. To store and preserve the ingredients for making meals, these establishments use commercial walk in freezers. Keeping frozen and processed foods and drinks for later sale is another application for it in the food and beverage retail sector. To ship frozen, processed goods throughout the globe, commercial walk in freezers are also widely used in the food and beverage distribution sector.

Commercial walk in freezers is being overused due to the rise in the import and export of packaged foods. The demand for seafood processed meals, and frozen goods to be refrigerated has increased along with notable growth in international food traffic. Due to ongoing innovation, the industry has witnessed quick improvements in technologies like liquid-vapor compression and ammonia absorption systems. The energy efficiency of commercial walk in freezers has dramatically increased during the previous five years.

The advent of innovative and inventive commercial walk in freezer products has been made possible by improvements in product design, refrigerants, and overall energy usage throughout time (such as multi-deck display cabinets and open-front refrigerated cases). The lack of doors gives these products better temperature stability and a better aesthetic appeal in addition to higher energy efficiency.

Commercial walk-in freezer demand has increased, which is attributed to a surge in consumer demand for frozen and chilled goods as a result of changing lifestyles and expanding urbanization. Additionally, a notable expansion of the organized retail sector, such as an increase in the number of supermarkets and hypermarkets, boosts total sales of commercial refrigerators, spurring the market's expansion.

Attribute Details
Commercial Walk in Freezer Market Value (2023) US$ 691.68 million
Commercial Walk in Freezer Market Forecast Value (2033) US$ 1,105.40 million
Commercial Walk in Freezer Market CAGR (2023 to 2033) 4.8%
USA Commercial Walk in Freezer Market Size (2033) 213.86 million

Don't pay for what you don't need

Customize your report by selecting specific countries or regions and save 30%!

Major Growth Drivers of Commercial Walk in Freezer Market Share

Natural refrigerants are frequently utilized globally for environmental sustainability. Furthermore, it has been observed that older commercial walk-in freezer technology was less effective than it is now. This equipment is getting more efficient and saves a lot of energy as a result of the usage of LED lighting systems, high-performance glass doors, and high-efficiency motors, which is considered a crucial factor in propelling the expansion of the commercial walk in freezer market globally. The global market for commercial walk-in freezers is growing exponentially due to rising disposable income in both developed and developing countries, as well as rising demand for ready-to-eat meals and other goods including eggs, milk, and meat.

The most significant application for the global commercial walk in freezer market has always been food service. Equipment for commercial walk-in freezers is in higher demand across all application fields. But among all of these categories, the food service application sector has been the most significant, and it is anticipated that it is likely to continue to lead the industry's growth.

Commercial Walk-in Freezer Market Expansion Get Hampered by the Introduction of Alternative Cooling Technologies

The high energy consumption of this system has also been noted to prevent small firms from using it, which is expected to restrain the growth of the commercial walk-in freezer market globally. So, these are some major factors that are preventing this market's expansion. The commercial walk-in freezer market has been significantly impacted by COVID-19. Operations have been suspended, production and demand have declined, and supply has been impacted.

Manufacturers have all reduced capital, spending, and capacity by 30 to 50 percent. The labor shortage is one of the main causes of the decline. Production has decreased on a global scale. The demand for commercial walk-in freezer equipment has decreased as a result of consumers' caution while making new purchases.

Nandini Roy Choudhury

Principal Consultant

Talk to Analyst

Find your sweet spots for generating winning opportunities in this market.

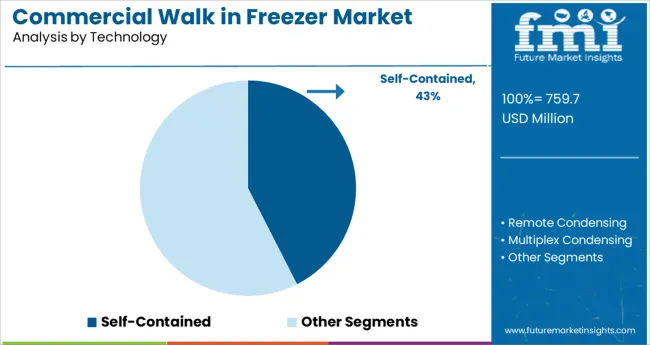
The self-contained segment dominates the market by a large margin throughout the projected period.

With a share of 5.6%, the self-contained walk in freezers segment is anticipated to dominate the commercial walk in freezer market. Self-contained walk-in coolers and freezers have several benefits, including being more portable, and handy, and requiring less maintenance and servicing. During the projection period, the market for walk-in coolers and freezers will continue to develop due to the rising use of self-contained walk-in coolers and freezers for longer-term food storage.

Remote condensing units are anticipated to see the fastest sales increase over the projected period. Plug cases and remote instances are further split into the display cases category. Plug-in cases have made up a higher portion of the global display case market than remote cases. During the anticipated timeframe, it is also anticipated that the market expansion of commercial walk-in freezers is anticipated to be stronger.

Comparative View of the Adjacent Commercial Walk in Freezer Market

Commercial Walk in Freezer Market:

Attributes Commercial Walk in Freezer Market
CAGR (2023 to 2033) 4.8%
Market Value (2033) US$ 1,105.40 million
Growth Factor Some of the major factors supporting the growth of the commercial walk-in freezer market are the use of natural refrigerants, improved efficiency, developments in the food sector, and rising demand for ready-to-eat food, egg, meat, and other animal-derived products.
Opportunity The growing deployment of vaccine storage units by biopharmaceutical firms and research institutes presents potential opportunities for market expansion.
Key Trends The growth of dining establishments and the influx of numerous restaurant chains as a result of the globalization of the food industry have raised the demand for commercial walk-in freezer equipment.

Commercial Refrigeration Equipment Market:

Attributes Commercial Refrigeration Equipment Market
CAGR (2023 to 2033) 5%
Market Value (2033) US$ 66.89 billion
Growth Factor Over the projected period, market growth is anticipated to be driven by the fast expansion of the hotel and tourist industries as well as consumers' rising desire for takeout meals.
Opportunity Positive development possibilities for the market will also be provided by escalating regulatory pressures that lead to the use of reduced Global Warming Potential (GWP) refrigerants together with continuous technological advancements.
Key Trends Shortly, industry players should have plenty of development prospects due to the growing requirement to regulate and keep an eye on the atmosphere of a commercial kitchen.

Walk-in Refrigerator Market:

Attributes Walk-in Refrigerator Market
CAGR (2023 to 2033) 8%
Market Value (2033) US$ 13.04 billion
Growth Factor The expansion of the walk-in refrigerator industry is mostly driven by the availability of new models with improved refrigerants.
Opportunity For end customers like supermarkets, walk-in refrigerator manufacturers strive to construct specialized walk-in refrigerators.
Key Trends Due to its accessibility, indoor walk-in coolers and freezers are increasingly being used to store and prolong the shelf life of perishable goods, which is likely to fuel the market's expansion.

Get the data you need at a Fraction of the cost

Personalize your report by choosing insights you need
and save 40%!

Increased Demand for Commercial Walk-in Freezers in the USA is Being Driven by Rising Frozen Food Consumption

In 2022, the North American commercial walk in freezer market is led by the United States, with a share of 25.7%. With a CAGR of 3.7%, the USA is anticipated to continue to be the most lucrative market for commercial walk-in freezers holding a share of US$ 213.86 million by 2033. Sales of commercial walk in freezers in the United States are likely to be aided by the presence of established retail sectors, increased hotel development, rising demand for commercial walk in coolers, and the presence of major market participants.

In restaurants or at home, a significant portion of Americans eats frozen meals. The American Frozen Food Institute (AFFI) estimates that retail sales of frozen food increased by 21% to about US$ 65.1 billion in 2020. The market for commercial walk in freezers is expanding favorably across the nation as a result.

To preserve the best possible condition for frozen and refrigerated goods, the majority of restaurants and commercial kitchens in the USA feature well-maintained commercial walk-in freezers and coolers. Additionally, expanding use of portable commercial walk in freezers, in addition to conventional ones, in the pharmaceutical and clinical research industries, as well as rising food product sales through online channels, is projected to assist the expansion of the USA commercial walk in freezer market.

Growing Hotel and Bakery Construction to Aid the United Kingdom to Achieve High Growth Potential in Commercial Walk-in Freezers Market

Europe's commercial walk in freezer market generated US$ 5.81 billion in 2020 as the retail, healthcare, and food service industries expanded. Additionally, the expansion of bakeries, restaurants, and hotels throughout the United Kingdom, Germany, France, and Italy is likely to promote regional development.

The commercial walk in freezer market in the United Kingdom is predicted to register at a CAGR of 4.6% during the forecast period, reaching 30.37 million by 2033. This is due to customers' strong desire for takeout options and restaurant meals. In addition, the region's expanding non-residential construction activities are probably going to increase demand for commercial walk-in coolers and freezers.

Korea to Witness Rising Investments in Commercial Walk in Freezers Industry

South Korea is anticipated to dominate the Korean commercial walk in freezer market with a CAGR of 5.5% during the forecast period, reaching a valuation of US$ 48.44 million by 2033.

Governments in South Korea are making significant investments in the retail sector, which is anticipated to support market growth. As an example, the largest retailer in the world, Wal-Mart Stores Inc., committed nearly $179 million to acquire a majority stake in four and six-store locations in South Korea. This move is likely to accelerate the expansion of the commercial walk in freezer market throughout the forecast period. Therefore, it is projected that the rising number of retail establishments across the highly developing nations is anticipated to fuel market expansion.

Thriving Food and Beverage Sector in Japan to Boost Sales of Commercial Walk in Freezer

According to FMI, the Japan commercial walk in freezer market is anticipated to rise at a CAGR of 6.0% during the forecast period, reaching US$ 35.28 million by 2033. The increase in the use of indoor and outdoor commercial walk in freezers by a variety of industries, including food & beverage, healthcare, and chemicals, is responsible for the country's growth. Food preservation has become essential to support such a large population.

Throughout the projection period, Japan is anticipated to expand considerably, mostly as a result of factors including steady employment rates, improving economic conditions, growing gross disposable income, and increased expenditure on leisure activities like traveling and dining out.

Using a Wide Range of Strategies, Arctic Walk in Coolers & Walk-in Freezers Exploring Untapped Growth Potential in Different Market

One of the primary objectives of Arctic Walk in Coolers & Walk in Freezers is to increase the penetration of their products into the commercial refrigeration sector. To increase its sales around the globe, the firm is also implementing several marketing methods, including flexible production with the most space possible and custom-made items. For instance, the business provides walk-in coolers with bespoke shelving for beverage, culinary, and flower applications. This is projected to make it easier for its walk-in goods to enter an untapped market.

Arctic Walk in Coolers & Walk in Freezers is offering a quick-ship COVID-19 vaccine cold storage solution as of November 2020. The walk-in freezers and coolers made by the firm are designed to -40° C for vaccinations that need to be frozen.

To broaden its expertise in commercial refrigeration for the benefit of clients, Viessmann acquired IAC Vestcold AS (a refrigeration and service partner in Norway) in June 2019.

Key players in the commercial walk in freezer market are leaning toward offering effective and dependable specialized commercial refrigeration equipment for a variety of applications, including restaurants, cold storage facilities, restaurants, and floral storage. It is so because each industrial application calls for a distinct product depending on the amount of available space, and equipment like commercial walk-in refrigerators is specially intended to promote convenience and ease of use for applications.

Custom walk-in freezers and coolers are becoming more popular because they offer greater versatility than stand-in coolers and freezers do. Bilt2spec commercial walk in freezers are offered by manufacturers like Master-Bilt Products, LLC, and are custom-made to accommodate practically any size or form.

Top companies in the commercial walk in freezer markets like Viessmann, Danfoss A/S, and others have well-established subsidiaries that are greatly enhancing market penetration in China. For instance, Beijing Viessmann Heating Technology Co., Ltd., a Chinese affiliate of Viessmann, offers cutting-edge freezers with assembly and central refrigeration designs.

Whirlpool Corporation announced in November 2021 that it will invest more than USD 65 million over the following several years in its manufacturing in Ottawa, Ohio, to make it the Premium Refrigeration Factory in North America. The firm will enlarge its Ottawa facility as part of this strategic drive to support the production of high-end refrigeration goods, such as Built-In refrigerators (BIR).

Leading Manufacturers Expanding Product Lines in the Fiercely Competitive Commercial Walk-in Freezers Industry

To control the market, they have used a variety of organic and inorganic techniques, including mergers, partnerships, collaborations, the development of new products, and acquisitions.

  • To comply with the DOE (Department of Energy) regulation, Emerson provided a new platform of annual walk-in energy factor (AWEF) compliant condensing units for walk-in coolers in January 2021.
  • Arctic Industries, a well-known producer of walk-in coolers and freezers supported by Stoic Holdings, joined forces with the Fischer Group in May 2021.
  • A producer of walk-in coolers and freezers situated in Los Angeles, Duracold Refrigeration Manufacturing Company, was purchased by Arctic Industries in September 2018. The purchase will assist the business in extending its geographic reach to the western United States.

Commercial Walk in Freezer Market Report Scope

Attribute Details
Forecast Period 2023 to 2033
Historical Data Available for 2018 to 2022
Market Analysis US$ billion for Value and Units for Volume
Key Regions Covered
  • North America
  • Latin America
  • Europe
  • Asia Pacific
  • Oceania
  • Middle East and Africa (MEA)
Key Countries Covered
  • India
  • The USA
  • Germany
  • China
  • The United Kingdom
  • Japan
  • Denmark
  • Canada
  • Thailand
  • Malaysia
  • Mexico
  • Poland
  • Turkey
  • Vietnam
  • Indonesia
  • Cambodia
  • France
  • Italy
  • Spain
  • South Korea
  • Russia
  • Australia
  • Brazil
  • Argentina
  • South Africa
Key Segments Covered
  • Technology
  • Door Type
  • Mounting type
  • Sales Channel
  • Region
Key Companies Profiled
  • SRC Refrigeration
  • Parker Hannifin Corp.
  • TMP Manufacturing Company
  • Panasonic Corporation
  • American Panel Corporation
  • Others
Report Coverage DROT Analysis, Market Forecast, Company Share Analysis, Market Dynamics and Challenges, Competitive Landscape, and Strategic Growth Initiatives
Customization & Pricing Available upon Request

Commercial Walk in Freezer Market by Category

By Technology:

  • Self-Contained
  • Remote Condensing
  • Multiplex Condensing

By Door Type:

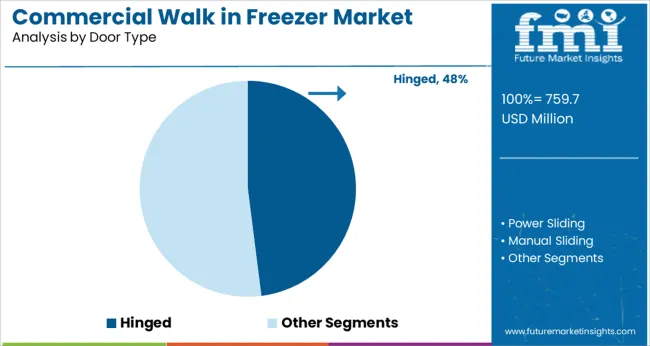
  • Hinged
  • Power Sliding
  • Manual Sliding

By Mounting type:

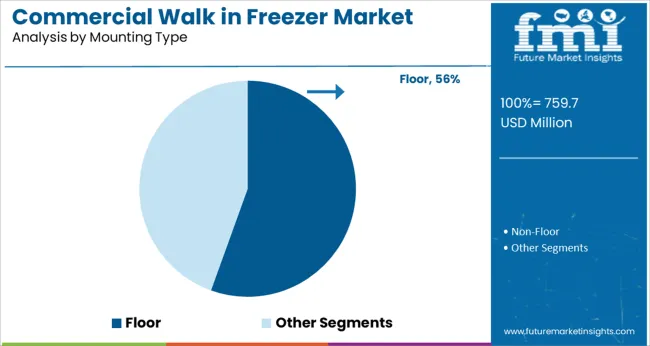
  • Floor
  • Non-Floor

By Sales Channel:

  • OEM
  • Aftermarket

By Region:

  • North America
  • Europe
  • Latin America
  • East Asia
  • South Asia
  • Oceania
  • Middle East and Africa

Frequently Asked Questions

What is the Current Size of the Commercial Walk in Freezer Market?

The commercial walk in freezer market is valued at US$ 660.00 million in 2022.

What is the Projected Market Size of Commercial Walk in 2033?

The commercial walk in freezer market is projected to reach US$ 1,105.40 million by 2033.

What is the Expected Commercial Walk in Freezer Market Growth?

Demand for a commercial walk in freezer is expected to increase at a CAGR of 4.8% through 2033.

How Big is the United States Commercial Walk in Freezer Market?

The United States commercial walk in freezer market is valued at US$ 213.86 million by 2033.

Table of Content

1. Executive Summary | Commercial Walk in Freezer Market

    1.1. Global Market Outlook

    1.2. Demand-side Trends

    1.3. Supply-side Trends

    1.4. Technology Roadmap Analysis

    1.5. Analysis and Recommendations

2. Market Overview

    2.1. Market Coverage / Taxonomy

    2.2. Market Definition / Scope / Limitations

3. Market Background

    3.1. Market Dynamics

        3.1.1. Drivers

        3.1.2. Restraints

        3.1.3. Opportunity

        3.1.4. Trends

    3.2. Scenario Forecast

        3.2.1. Demand in Optimistic Scenario

        3.2.2. Demand in Likely Scenario

        3.2.3. Demand in Conservative Scenario

    3.3. Product launches & Recent Developments

    3.4. Product Life Cycle Analysis

    3.5. Value Chain Analysis

        3.5.1. Supply Side Participants and their Roles

            3.5.1.1. Producers

            3.5.1.2. Mid-Level Participants (Traders/ Agents/ Brokers)

            3.5.1.3. Wholesalers and Distributors

        3.5.2. % of Operating Margin Analysis

        3.5.3. List of Raw Material Suppliers

        3.5.4. List of Existing and Potential Buyer’s

    3.6. Global Market - Pricing Analysis

        3.6.1. Price Point Assessment by Region

        3.6.2. Price Point Assessment by Product Type

        3.6.3. Price Forecast till 2033

        3.6.4. Factors affecting pricing

    3.7. Forecast Factors - Relevance & Impact

    3.8. Regulatory Landscape

        3.8.1. Certifications and Certifying Agency Overview

    3.9. Regional Parent Market Outlook

    3.10. Macro-Economic Factors

    3.11. Product Claims & Nutritional Information Scan by Buyers

4. Global Market Analysis 2018 to 2022 and Forecast, 2033 to 2033

    4.1. Historical Market Size Value (US$ million) & Volume (MT) Analysis, 2018 to 2022

    4.2. Current and Future Market Size Value (US$ million) & Volume (MT) Projections, 2033 to 2033

        4.2.1. Y-o-Y Growth Trend Analysis

        4.2.2. Absolute $ Opportunity Analysis

5. Global Market Analysis 2018 to 2022 and Forecast 2033 to 2033, By Technology

    5.1. Introduction / Key Findings

    5.2. Historical Market Size Value (US$ million) & Volume (MT) Analysis By Technology, 2018 to 2022

    5.3. Current and Future Market Size Value (US$ million) & Volume (MT) Analysis and Forecast By Technology, 2033 to 2033

        5.3.1. Self-Contained

        5.3.2. Remote Condensing

        5.3.3. Multiplex Condensing

    5.4. Y-o-Y Growth Trend Analysis By Technology, 2018 to 2022

    5.5. Absolute $ Opportunity Analysis By Technology, 2033 to 2033

6. Global Market Analysis 2018 to 2022 and Forecast 2033 to 2033, By Door Type

    6.1. Introduction / Key Findings

    6.2. Historical Market Size Value (US$ million) & Volume (MT) Analysis By Door Type, 2018 to 2022

    6.3. Current and Future Market Size Value (US$ million) & Volume (MT) Analysis and Forecast By Door Type, 2033 to 2033

        6.3.1. Hinged

        6.3.2. Power Sliding

        6.3.3. Manual Sliding

    6.4. Y-o-Y Growth Trend Analysis By Door Type, 2018 to 2022

    6.5. Absolute $ Opportunity Analysis By Door Type, 2033 to 2033

7. Global Market Analysis 2018 to 2022 and Forecast 2033 to 2033, By Mounting type

    7.1. Introduction / Key Findings

    7.2. Historical Market Size Value (US$ million) & Volume (MT) Analysis By Mounting type, 2018 to 2022

    7.3. Current and Future Market Size Value (US$ million) & Volume (MT) Analysis and Forecast By Mounting type, 2033 to 2033

        7.3.1. Floor

        7.3.2. Non-Floor

    7.4. Y-o-Y Growth Trend Analysis By Mounting type, 2018 to 2022

    7.5. Absolute $ Opportunity Analysis By Mounting type, 2033 to 2033

8. Global Market Analysis 2018 to 2022 and Forecast 2033 to 2033, By Sales Channel 

    8.1. Introduction / Key Findings

    8.2. Historical Market Size Value (US$ million) & Volume (MT) Analysis By Sales Channel , 2018 to 2022

    8.3. Current and Future Market Size Value (US$ million) & Volume (MT) Analysis and Forecast By Sales Channel , 2033 to 2033

        8.3.1. Original Equipment Manufacturer

        8.3.2. Aftermarket

    8.4. Y-o-Y Growth Trend Analysis By Sales Channel , 2018 to 2022

    8.5. Absolute $ Opportunity Analysis By Sales Channel , 2033 to 2033

9. Global Market Analysis 2018 to 2022 and Forecast 2033 to 2033, By Region

    9.1. Introduction

    9.2. Historical Market Size Value (US$ million) & Volume (MT) Analysis By Region, 2018 to 2022

    9.3. Current Market Size Value (US$ million) & Volume (MT) Analysis and Forecast By Region, 2033 to 2033

        9.3.1. North America

        9.3.2. Latin America

        9.3.3. Europe

        9.3.4. East Asia

        9.3.5. South Asia

        9.3.6. Oceania

        9.3.7. Middle East and Africa (MEA)

    9.4. Market Attractiveness Analysis By Region

10. North America Market Analysis 2018 to 2022 and Forecast 2033 to 2033, By Country

    10.1. Historical Market Size Value (US$ million) & Volume (MT) Trend Analysis By Market Taxonomy, 2018 to 2022

    10.2. Market Size Value (US$ million) & Volume (MT) Forecast By Market Taxonomy, 2033 to 2033

        10.2.1. By Country

            10.2.1.1. U.S.

            10.2.1.2. Canada

        10.2.2. By Technology

        10.2.3. By Door Type

        10.2.4. By Mounting type

        10.2.5. By Sales Channel

    10.3. Market Attractiveness Analysis

        10.3.1. By Country

        10.3.2. By Technology

        10.3.3. By Door Type

        10.3.4. By Mounting type

        10.3.5. By Sales Channel

    10.4. Key Takeaways

11. Latin America Market Analysis 2018 to 2022 and Forecast 2033 to 2033, By Country

    11.1. Historical Market Size Value (US$ million) & Volume (MT) Trend Analysis By Market Taxonomy, 2018 to 2022

    11.2. Market Size Value (US$ million) & Volume (MT) Forecast By Market Taxonomy, 2033 to 2033

        11.2.1. By Country

            11.2.1.1. Brazil

            11.2.1.2. Mexico

            11.2.1.3. Argentina

            11.2.1.4. Chile

            11.2.1.5. Peru

            11.2.1.6. Rest of Latin America

        11.2.2. By Technology

        11.2.3. By Door Type

        11.2.4. By Mounting type

        11.2.5. By Sales Channel

    11.3. Market Attractiveness Analysis

        11.3.1. By Country

        11.3.2. By Technology

        11.3.3. By Door Type

        11.3.4. By Mounting type

        11.3.5. By Sales Channel

    11.4. Key Takeaways

12. Europe Market Analysis 2018 to 2022 and Forecast 2033 to 2033, By Country

    12.1. Historical Market Size Value (US$ million) & Volume (MT) Trend Analysis By Market Taxonomy, 2018 to 2022

    12.2. Market Size Value (US$ million) & Volume (MT) Forecast By Market Taxonomy, 2033 to 2033

        12.2.1. By Country

            12.2.1.1. Germany

            12.2.1.2. Italy

            12.2.1.3. France

            12.2.1.4. U.K.

            12.2.1.5. Spain

            12.2.1.6. Russia

            12.2.1.7. BENELUX

            12.2.1.8. Poland

            12.2.1.9. Nordic Countries

            12.2.1.10. Rest of Europe

        12.2.2. By Technology

        12.2.3. By Door Type

        12.2.4. By Mounting type

        12.2.5. By Sales Channel

    12.3. Market Attractiveness Analysis

        12.3.1. By Country

        12.3.2. By Technology

        12.3.3. By Door Type

        12.3.4. By Mounting type

        12.3.5. By Sales Channel

    12.4. Key Takeaways

13. East Asia Market Analysis 2018 to 2022 and Forecast 2033 to 2033, By Country

    13.1. Historical Market Size Value (US$ million) & Volume (MT) Trend Analysis By Market Taxonomy, 2018 to 2022

    13.2. Market Size Value (US$ million) & Volume (MT) Forecast By Market Taxonomy, 2033 to 2033

        13.2.1. By Country

            13.2.1.1. China

            13.2.1.2. Japan

            13.2.1.3. South Korea

        13.2.2. By Technology

        13.2.3. By Door Type

        13.2.4. By Mounting type

        13.2.5. By Sales Channel

    13.3. Market Attractiveness Analysis

        13.3.1. By Country

        13.3.2. By Technology

        13.3.3. By Door Type

        13.3.4. By Mounting type

        13.3.5. By Sales Channel

    13.4. Key Takeaways

14. South Asia Market Analysis 2018 to 2022 and Forecast 2033 to 2033, By Country

    14.1. Historical Market Size Value (US$ million) & Volume (MT) Trend Analysis By Market Taxonomy, 2018 to 2022

    14.2. Market Size Value (US$ million) & Volume (MT) Forecast By Market Taxonomy, 2033 to 2033

        14.2.1. By Country

            14.2.1.1. India

            14.2.1.2. Thailand

            14.2.1.3. Malaysia

            14.2.1.4. Indonesia

            14.2.1.5. Singapore

            14.2.1.6. Rest of South Asia

        14.2.2. By Technology

        14.2.3. By Door Type

        14.2.4. By Mounting type

        14.2.5. By Sales Channel

    14.3. Market Attractiveness Analysis

        14.3.1. By Country

        14.3.2. By Technology

        14.3.3. By Door Type

        14.3.4. By Mounting type

        14.3.5. By Sales Channel

    14.4. Key Takeaways

15. Oceania Market Analysis 2018 to 2022 and Forecast 2033 to 2033, By Country

    15.1. Historical Market Size Value (US$ million) & Volume (MT) Trend Analysis By Market Taxonomy, 2018 to 2022

    15.2. Market Size Value (US$ million) & Volume (MT) Forecast By Market Taxonomy, 2033 to 2033

        15.2.1. By Country

            15.2.1.1. Australia

            15.2.1.2. New Zealand

        15.2.2. By Technology

        15.2.3. By Door Type

        15.2.4. By Mounting type

        15.2.5. By Sales Channel

    15.3. Market Attractiveness Analysis

        15.3.1. By Country

        15.3.2. By Technology

        15.3.3. By Door Type

        15.3.4. By Mounting type

        15.3.5. By Sales Channel

    15.4. Key Takeaways

16. MEA Market Analysis 2018 to 2022 and Forecast 2033 to 2033, By Country

    16.1. Historical Market Size Value (US$ million) & Volume (MT) Trend Analysis By Market Taxonomy, 2018 to 2022

    16.2. Market Size Value (US$ million) & Volume (MT) Forecast By Market Taxonomy, 2033 to 2033

        16.2.1. By Country

            16.2.1.1. GCC Countries

            16.2.1.2. South Africa

            16.2.1.3. Central Africa

            16.2.1.4. North Africa

        16.2.2. By Technology

        16.2.3. By Door Type

        16.2.4. By Mounting type

        16.2.5. By Sales Channel

    16.3. Market Attractiveness Analysis

        16.3.1. By Country

        16.3.2. By Technology

        16.3.3. By Door Type

        16.3.4. By Mounting type

        16.3.5. By Sales Channel

    16.4. Key Takeaways

17. Key Countries Market Analysis

    17.1. The USA

        17.1.1. Pricing Analysis

        17.1.2. Market Share Analysis, 2022

            17.1.2.1. By Technology

            17.1.2.2. By Door Type

            17.1.2.3. By Mounting type

            17.1.2.4. By Sales Channel

    17.2. Canada

        17.2.1. Pricing Analysis

        17.2.2. Market Share Analysis, 2022

            17.2.2.1. By Technology

            17.2.2.2. By Door Type

            17.2.2.3. By Mounting type

            17.2.2.4. By Sales Channel

    17.3. Brazil

        17.3.1. Pricing Analysis

        17.3.2. Market Share Analysis, 2022

            17.3.2.1. By Technology

            17.3.2.2. By Door Type

            17.3.2.3. By Mounting type

            17.3.2.4. By Sales Channel

    17.4. Mexico

        17.4.1. Pricing Analysis

        17.4.2. Market Share Analysis, 2022

            17.4.2.1. By Technology

            17.4.2.2. By Door Type

            17.4.2.3. By Mounting type

            17.4.2.4. By Sales Channel

    17.5. Argentina

        17.5.1. Pricing Analysis

        17.5.2. Market Share Analysis, 2022

            17.5.2.1. By Technology

            17.5.2.2. By Door Type

            17.5.2.3. By Mounting type

            17.5.2.4. By Sales Channel

    17.6. Chile

        17.6.1. Pricing Analysis

        17.6.2. Market Share Analysis, 2022

            17.6.2.1. By Technology

            17.6.2.2. By Door Type

            17.6.2.3. By Mounting type

            17.6.2.4. By Sales Channel

    17.7. Peru

        17.7.1. Pricing Analysis

        17.7.2. Market Share Analysis, 2022

            17.7.2.1. By Technology

            17.7.2.2. By Door Type

            17.7.2.3. By Mounting type

            17.7.2.4. By Sales Channel

    17.8. Germany

        17.8.1. Pricing Analysis

        17.8.2. Market Share Analysis, 2022

            17.8.2.1. By Technology

            17.8.2.2. By Door Type

            17.8.2.3. By Mounting type

            17.8.2.4. By Sales Channel

    17.9. Italy

        17.9.1. Pricing Analysis

        17.9.2. Market Share Analysis, 2022

            17.9.2.1. By Technology

            17.9.2.2. By Door Type

            17.9.2.3. By Mounting type

            17.9.2.4. By Sales Channel

    17.10. France

        17.10.1. Pricing Analysis

        17.10.2. Market Share Analysis, 2022

            17.10.2.1. By Technology

            17.10.2.2. By Door Type

            17.10.2.3. By Mounting type

            17.10.2.4. By Sales Channel

    17.11. Spain

        17.11.1. Pricing Analysis

        17.11.2. Market Share Analysis, 2022

            17.11.2.1. By Technology

            17.11.2.2. By Door Type

            17.11.2.3. By Mounting type

            17.11.2.4. By Sales Channel

    17.12. The United Kingdom

        17.12.1. Pricing Analysis

        17.12.2. Market Share Analysis, 2022

            17.12.2.1. By Technology

            17.12.2.2. By Door Type

            17.12.2.3. By Mounting type

            17.12.2.4. By Sales Channel

    17.13. Russia

        17.13.1. Pricing Analysis

        17.13.2. Market Share Analysis, 2022

            17.13.2.1. By Technology

            17.13.2.2. By Door Type

            17.13.2.3. By Mounting type

            17.13.2.4. By Sales Channel

    17.14. Poland

        17.14.1. Pricing Analysis

        17.14.2. Market Share Analysis, 2022

            17.14.2.1. By Technology

            17.14.2.2. By Door Type

            17.14.2.3. By Mounting type

            17.14.2.4. By Sales Channel

    17.15. BENELUX

        17.15.1. Pricing Analysis

        17.15.2. Market Share Analysis, 2022

            17.15.2.1. By Technology

            17.15.2.2. By Door Type

            17.15.2.3. By Mounting type

            17.15.2.4. By Sales Channel

    17.16. Nordic Countries

        17.16.1. Pricing Analysis

        17.16.2. Market Share Analysis, 2022

            17.16.2.1. By Technology

            17.16.2.2. By Door Type

            17.16.2.3. By Mounting type

            17.16.2.4. By Sales Channel

    17.17. China

        17.17.1. Pricing Analysis

        17.17.2. Market Share Analysis, 2022

            17.17.2.1. By Technology

            17.17.2.2. By Door Type

            17.17.2.3. By Mounting type

            17.17.2.4. By Sales Channel

    17.18. Japan

        17.18.1. Pricing Analysis

        17.18.2. Market Share Analysis, 2022

            17.18.2.1. By Technology

            17.18.2.2. By Door Type

            17.18.2.3. By Mounting type

            17.18.2.4. By Sales Channel

    17.19. South Korea

        17.19.1. Pricing Analysis

        17.19.2. Market Share Analysis, 2022

            17.19.2.1. By Technology

            17.19.2.2. By Door Type

            17.19.2.3. By Mounting type

            17.19.2.4. By Sales Channel

    17.20. India

        17.20.1. Pricing Analysis

        17.20.2. Market Share Analysis, 2022

            17.20.2.1. By Technology

            17.20.2.2. By Door Type

            17.20.2.3. By Mounting type

            17.20.2.4. By Sales Channel

    17.21. Thailand

        17.21.1. Pricing Analysis

        17.21.2. Market Share Analysis, 2022

            17.21.2.1. By Technology

            17.21.2.2. By Door Type

            17.21.2.3. By Mounting type

            17.21.2.4. By Sales Channel

    17.22. Indonesia

        17.22.1. Pricing Analysis

        17.22.2. Market Share Analysis, 2022

            17.22.2.1. By Technology

            17.22.2.2. By Door Type

            17.22.2.3. By Mounting type

            17.22.2.4. By Sales Channel

    17.23. Malaysia

        17.23.1. Pricing Analysis

        17.23.2. Market Share Analysis, 2022

            17.23.2.1. By Technology

            17.23.2.2. By Door Type

            17.23.2.3. By Mounting type

            17.23.2.4. By Sales Channel

    17.24. Singapore

        17.24.1. Pricing Analysis

        17.24.2. Market Share Analysis, 2022

            17.24.2.1. By Technology

            17.24.2.2. By Door Type

            17.24.2.3. By Mounting type

            17.24.2.4. By Sales Channel

    17.25. Australia

        17.25.1. Pricing Analysis

        17.25.2. Market Share Analysis, 2022

            17.25.2.1. By Technology

            17.25.2.2. By Door Type

            17.25.2.3. By Mounting type

            17.25.2.4. By Sales Channel

    17.26. New Zealand

        17.26.1. Pricing Analysis

        17.26.2. Market Share Analysis, 2022

            17.26.2.1. By Technology

            17.26.2.2. By Door Type

            17.26.2.3. By Mounting type

            17.26.2.4. By Sales Channel

    17.27. GCC Countries

        17.27.1. Pricing Analysis

        17.27.2. Market Share Analysis, 2022

            17.27.2.1. By Technology

            17.27.2.2. By Door Type

            17.27.2.3. By Mounting type

            17.27.2.4. By Sales Channel

    17.28. South Africa

        17.28.1. Pricing Analysis

        17.28.2. Market Share Analysis, 2022

            17.28.2.1. By Technology

            17.28.2.2. By Door Type

            17.28.2.3. By Mounting type

            17.28.2.4. By Sales Channel

    17.29. North Africa

        17.29.1. Pricing Analysis

        17.29.2. Market Share Analysis, 2022

            17.29.2.1. By Technology

            17.29.2.2. By Door Type

            17.29.2.3. By Mounting type

            17.29.2.4. By Sales Channel

    17.30. Central Africa

        17.30.1. Pricing Analysis

        17.30.2. Market Share Analysis, 2022

            17.30.2.1. By Technology

            17.30.2.2. By Door Type

            17.30.2.3. By Mounting type

            17.30.2.4. By Sales Channel

18. Market Structure Analysis

    18.1. Competition Dashboard

    18.2. Competition Benchmarking

    18.3. Market Share Analysis of Top Players

        18.3.1. By Regional

        18.3.2. By Technology

        18.3.3. By Door Type

        18.3.4. By Mounting type

        18.3.5. By Sales Channel

19. Competition Analysis

    19.1. Competition Deep Dive

        19.1.1. SRC Refrigeration

            19.1.1.1. Overview

            19.1.1.2. Product Portfolio

            19.1.1.3. Profitability by Market Segments (Product/Age /Sales Channel/Region)

            19.1.1.4. Sales Footprint

            19.1.1.5. Strategy Overview

                19.1.1.5.1. Marketing Strategy

                19.1.1.5.2. Product Strategy

                19.1.1.5.3. Channel Strategy

        19.1.2. Parker Hannifin Corp

            19.1.2.1. Overview

            19.1.2.2. Product Portfolio

            19.1.2.3. Profitability by Market Segments (Product/Age /Sales Channel/Region)

            19.1.2.4. Sales Footprint

            19.1.2.5. Strategy Overview

                19.1.2.5.1. Marketing Strategy

                19.1.2.5.2. Product Strategy

                19.1.2.5.3. Channel Strategy

        19.1.3. TMP Manufacturing Company

            19.1.3.1. Overview

            19.1.3.2. Product Portfolio

            19.1.3.3. Profitability by Market Segments (Product/Age /Sales Channel/Region)

            19.1.3.4. Sales Footprint

            19.1.3.5. Strategy Overview

                19.1.3.5.1. Marketing Strategy

                19.1.3.5.2. Product Strategy

                19.1.3.5.3. Channel Strategy

        19.1.4. Panasonic Corporation

            19.1.4.1. Overview

            19.1.4.2. Product Portfolio

            19.1.4.3. Profitability by Market Segments (Product/Age /Sales Channel/Region)

            19.1.4.4. Sales Footprint

            19.1.4.5. Strategy Overview

                19.1.4.5.1. Marketing Strategy

                19.1.4.5.2. Product Strategy

                19.1.4.5.3. Channel Strategy

        19.1.5. American Panel Corporation

            19.1.5.1. Overview

            19.1.5.2. Product Portfolio

            19.1.5.3. Profitability by Market Segments (Product/Age /Sales Channel/Region)

            19.1.5.4. Sales Footprint

            19.1.5.5. Strategy Overview

                19.1.5.5.1. Marketing Strategy

                19.1.5.5.2. Product Strategy

                19.1.5.5.3. Channel Strategy

        19.1.6. Other (as per requirement)

            19.1.6.1. Overview

            19.1.6.2. Product Portfolio

            19.1.6.3. Profitability by Market Segments (Product/Age /Sales Channel/Region)

            19.1.6.4. Sales Footprint

            19.1.6.5. Strategy Overview

                19.1.6.5.1. Marketing Strategy

                19.1.6.5.2. Product Strategy

                19.1.6.5.3. Channel Strategy

20. Assumptions & Acronyms Used

21. Research Methodology

Don't pay for what you don't need

Customize your report by selecting specific countries or regions and save 30%!

List of Tables

Table 1: Global Market Value (US$ million) Forecast by Region, 2018 to 2033

Table 2: Global Market Volume (Units) Forecast by Region, 2018 to 2033

Table 3: Global Market Value (US$ million) Forecast by Technology, 2018 to 2033

Table 4: Global Market Volume (Units) Forecast by Technology, 2018 to 2033

Table 5: Global Market Value (US$ million) Forecast by Door Type, 2018 to 2033

Table 6: Global Market Volume (Units) Forecast by Door Type, 2018 to 2033

Table 7: Global Market Value (US$ million) Forecast by Mounting Type, 2018 to 2033

Table 8: Global Market Volume (Units) Forecast by Mounting Type, 2018 to 2033

Table 9: Global Market Value (US$ million) Forecast by Sales Channel, 2018 to 2033

Table 10: Global Market Volume (Units) Forecast by Sales Channel, 2018 to 2033

Table 11: North America Market Value (US$ million) Forecast by Country, 2018 to 2033

Table 12: North America Market Volume (Units) Forecast by Country, 2018 to 2033

Table 13: North America Market Value (US$ million) Forecast by Technology, 2018 to 2033

Table 14: North America Market Volume (Units) Forecast by Technology, 2018 to 2033

Table 15: North America Market Value (US$ million) Forecast by Door Type, 2018 to 2033

Table 16: North America Market Volume (Units) Forecast by Door Type, 2018 to 2033

Table 17: North America Market Value (US$ million) Forecast by Mounting Type, 2018 to 2033

Table 18: North America Market Volume (Units) Forecast by Mounting Type, 2018 to 2033

Table 19: North America Market Value (US$ million) Forecast by Sales Channel, 2018 to 2033

Table 20: North America Market Volume (Units) Forecast by Sales Channel, 2018 to 2033

Table 21: Latin America Market Value (US$ million) Forecast by Country, 2018 to 2033

Table 22: Latin America Market Volume (Units) Forecast by Country, 2018 to 2033

Table 23: Latin America Market Value (US$ million) Forecast by Technology, 2018 to 2033

Table 24: Latin America Market Volume (Units) Forecast by Technology, 2018 to 2033

Table 25: Latin America Market Value (US$ million) Forecast by Door Type, 2018 to 2033

Table 26: Latin America Market Volume (Units) Forecast by Door Type, 2018 to 2033

Table 27: Latin America Market Value (US$ million) Forecast by Mounting Type, 2018 to 2033

Table 28: Latin America Market Volume (Units) Forecast by Mounting Type, 2018 to 2033

Table 29: Latin America Market Value (US$ million) Forecast by Sales Channel, 2018 to 2033

Table 30: Latin America Market Volume (Units) Forecast by Sales Channel, 2018 to 2033

Table 31: Europe Market Value (US$ million) Forecast by Country, 2018 to 2033

Table 32: Europe Market Volume (Units) Forecast by Country, 2018 to 2033

Table 33: Europe Market Value (US$ million) Forecast by Technology, 2018 to 2033

Table 34: Europe Market Volume (Units) Forecast by Technology, 2018 to 2033

Table 35: Europe Market Value (US$ million) Forecast by Door Type, 2018 to 2033

Table 36: Europe Market Volume (Units) Forecast by Door Type, 2018 to 2033

Table 37: Europe Market Value (US$ million) Forecast by Mounting Type, 2018 to 2033

Table 38: Europe Market Volume (Units) Forecast by Mounting Type, 2018 to 2033

Table 39: Europe Market Value (US$ million) Forecast by Sales Channel, 2018 to 2033

Table 40: Europe Market Volume (Units) Forecast by Sales Channel, 2018 to 2033

Table 41: East Asia Market Value (US$ million) Forecast by Country, 2018 to 2033

Table 42: East Asia Market Volume (Units) Forecast by Country, 2018 to 2033

Table 43: East Asia Market Value (US$ million) Forecast by Technology, 2018 to 2033

Table 44: East Asia Market Volume (Units) Forecast by Technology, 2018 to 2033

Table 45: East Asia Market Value (US$ million) Forecast by Door Type, 2018 to 2033

Table 46: East Asia Market Volume (Units) Forecast by Door Type, 2018 to 2033

Table 47: East Asia Market Value (US$ million) Forecast by Mounting Type, 2018 to 2033

Table 48: East Asia Market Volume (Units) Forecast by Mounting Type, 2018 to 2033

Table 49: East Asia Market Value (US$ million) Forecast by Sales Channel, 2018 to 2033

Table 50: East Asia Market Volume (Units) Forecast by Sales Channel, 2018 to 2033

Table 51: South Asia Market Value (US$ million) Forecast by Country, 2018 to 2033

Table 52: South Asia Market Volume (Units) Forecast by Country, 2018 to 2033

Table 53: South Asia Market Value (US$ million) Forecast by Technology, 2018 to 2033

Table 54: South Asia Market Volume (Units) Forecast by Technology, 2018 to 2033

Table 55: South Asia Market Value (US$ million) Forecast by Door Type, 2018 to 2033

Table 56: South Asia Market Volume (Units) Forecast by Door Type, 2018 to 2033

Table 57: South Asia Market Value (US$ million) Forecast by Mounting Type, 2018 to 2033

Table 58: South Asia Market Volume (Units) Forecast by Mounting Type, 2018 to 2033

Table 59: South Asia Market Value (US$ million) Forecast by Sales Channel, 2018 to 2033

Table 60: South Asia Market Volume (Units) Forecast by Sales Channel, 2018 to 2033

Table 61: Oceania Market Value (US$ million) Forecast by Country, 2018 to 2033

Table 62: Oceania Market Volume (Units) Forecast by Country, 2018 to 2033

Table 63: Oceania Market Value (US$ million) Forecast by Technology, 2018 to 2033

Table 64: Oceania Market Volume (Units) Forecast by Technology, 2018 to 2033

Table 65: Oceania Market Value (US$ million) Forecast by Door Type, 2018 to 2033

Table 66: Oceania Market Volume (Units) Forecast by Door Type, 2018 to 2033

Table 67: Oceania Market Value (US$ million) Forecast by Mounting Type, 2018 to 2033

Table 68: Oceania Market Volume (Units) Forecast by Mounting Type, 2018 to 2033

Table 69: Oceania Market Value (US$ million) Forecast by Sales Channel, 2018 to 2033

Table 70: Oceania Market Volume (Units) Forecast by Sales Channel, 2018 to 2033

Table 71: MEA Market Value (US$ million) Forecast by Country, 2018 to 2033

Table 72: MEA Market Volume (Units) Forecast by Country, 2018 to 2033

Table 73: MEA Market Value (US$ million) Forecast by Technology, 2018 to 2033

Table 74: MEA Market Volume (Units) Forecast by Technology, 2018 to 2033

Table 75: MEA Market Value (US$ million) Forecast by Door Type, 2018 to 2033

Table 76: MEA Market Volume (Units) Forecast by Door Type, 2018 to 2033

Table 77: MEA Market Value (US$ million) Forecast by Mounting Type, 2018 to 2033

Table 78: MEA Market Volume (Units) Forecast by Mounting Type, 2018 to 2033

Table 79: MEA Market Value (US$ million) Forecast by Sales Channel, 2018 to 2033

Table 80: MEA Market Volume (Units) Forecast by Sales Channel, 2018 to 2033
Nandini Roy Choudhury

Principal Consultant

Talk to Analyst

Find your sweet spots for generating winning opportunities in this market.

List of Charts

Figure 1: Global Market Value (US$ Million) by Technology, 2023 to 2033

Figure 2: Global Market Value (US$ Million) by Door Type, 2023 to 2033

Figure 3: Global Market Value (US$ Million) by Mounting type, 2023 to 2033

Figure 4: Global Market Value (US$ Million) by Sales Channel, 2023 to 2033

Figure 5: Global Market Value (US$ Million) by Region, 2023 to 2033

Figure 6: Global Market Value (US$ Million) Analysis by Region, 2018 to 2033

Figure 7: Global Market Volume (Units) Analysis by Region, 2018 to 2033

Figure 8: Global Market Value Share (%) and BPS Analysis by Region, 2023 to 2033

Figure 9: Global Market Y-o-Y Growth (%) Projections by Region, 2023 to 2033

Figure 10: Global Market Value (US$ Million) Analysis by Technology, 2018 to 2033

Figure 11: Global Market Volume (Units) Analysis by Technology, 2018 to 2033

Figure 12: Global Market Value Share (%) and BPS Analysis by Technology, 2023 to 2033

Figure 13: Global Market Y-o-Y Growth (%) Projections by Technology, 2023 to 2033

Figure 14: Global Market Value (US$ Million) Analysis by Door Type, 2018 to 2033

Figure 15: Global Market Volume (Units) Analysis by Door Type, 2018 to 2033

Figure 16: Global Market Value Share (%) and BPS Analysis by Door Type, 2023 to 2033

Figure 17: Global Market Y-o-Y Growth (%) Projections by Door Type, 2023 to 2033

Figure 18: Global Market Value (US$ Million) Analysis by Mounting type, 2018 to 2033

Figure 19: Global Market Volume (Units) Analysis by Mounting type, 2018 to 2033

Figure 20: Global Market Value Share (%) and BPS Analysis by Mounting type, 2023 to 2033

Figure 21: Global Market Y-o-Y Growth (%) Projections by Mounting type, 2023 to 2033

Figure 22: Global Market Value (US$ Million) Analysis by Sales Channel, 2018 to 2033

Figure 23: Global Market Volume (Units) Analysis by Sales Channel, 2018 to 2033

Figure 24: Global Market Value Share (%) and BPS Analysis by Sales Channel, 2023 to 2033

Figure 25: Global Market Y-o-Y Growth (%) Projections by Sales Channel, 2023 to 2033

Figure 26: Global Market Attractiveness by Technology, 2023 to 2033

Figure 27: Global Market Attractiveness by Door Type, 2023 to 2033

Figure 28: Global Market Attractiveness by Mounting type, 2023 to 2033

Figure 29: Global Market Attractiveness by Sales Channel, 2023 to 2033

Figure 30: Global Market Attractiveness by Region, 2023 to 2033

Figure 31: North America Market Value (US$ Million) by Technology, 2023 to 2033

Figure 32: North America Market Value (US$ Million) by Door Type, 2023 to 2033

Figure 33: North America Market Value (US$ Million) by Mounting type, 2023 to 2033

Figure 34: North America Market Value (US$ Million) by Sales Channel, 2023 to 2033

Figure 35: North America Market Value (US$ Million) by Country, 2023 to 2033

Figure 36: North America Market Value (US$ Million) Analysis by Country, 2018 to 2033

Figure 37: North America Market Volume (Units) Analysis by Country, 2018 to 2033

Figure 38: North America Market Value Share (%) and BPS Analysis by Country, 2023 to 2033

Figure 39: North America Market Y-o-Y Growth (%) Projections by Country, 2023 to 2033

Figure 40: North America Market Value (US$ Million) Analysis by Technology, 2018 to 2033

Figure 41: North America Market Volume (Units) Analysis by Technology, 2018 to 2033

Figure 42: North America Market Value Share (%) and BPS Analysis by Technology, 2023 to 2033

Figure 43: North America Market Y-o-Y Growth (%) Projections by Technology, 2023 to 2033

Figure 44: North America Market Value (US$ Million) Analysis by Door Type, 2018 to 2033

Figure 45: North America Market Volume (Units) Analysis by Door Type, 2018 to 2033

Figure 46: North America Market Value Share (%) and BPS Analysis by Door Type, 2023 to 2033

Figure 47: North America Market Y-o-Y Growth (%) Projections by Door Type, 2023 to 2033

Figure 48: North America Market Value (US$ Million) Analysis by Mounting type, 2018 to 2033

Figure 49: North America Market Volume (Units) Analysis by Mounting type, 2018 to 2033

Figure 50: North America Market Value Share (%) and BPS Analysis by Mounting type, 2023 to 2033

Figure 51: North America Market Y-o-Y Growth (%) Projections by Mounting type, 2023 to 2033

Figure 52: North America Market Value (US$ Million) Analysis by Sales Channel, 2018 to 2033

Figure 53: North America Market Volume (Units) Analysis by Sales Channel, 2018 to 2033

Figure 54: North America Market Value Share (%) and BPS Analysis by Sales Channel, 2023 to 2033

Figure 55: North America Market Y-o-Y Growth (%) Projections by Sales Channel, 2023 to 2033

Figure 56: North America Market Attractiveness by Technology, 2023 to 2033

Figure 57: North America Market Attractiveness by Door Type, 2023 to 2033

Figure 58: North America Market Attractiveness by Mounting type, 2023 to 2033

Figure 59: North America Market Attractiveness by Sales Channel, 2023 to 2033

Figure 60: North America Market Attractiveness by Country, 2023 to 2033

Figure 61: Latin America Market Value (US$ Million) by Technology, 2023 to 2033

Figure 62: Latin America Market Value (US$ Million) by Door Type, 2023 to 2033

Figure 63: Latin America Market Value (US$ Million) by Mounting type, 2023 to 2033

Figure 64: Latin America Market Value (US$ Million) by Sales Channel, 2023 to 2033

Figure 65: Latin America Market Value (US$ Million) by Country, 2023 to 2033

Figure 66: Latin America Market Value (US$ Million) Analysis by Country, 2018 to 2033

Figure 67: Latin America Market Volume (Units) Analysis by Country, 2018 to 2033

Figure 68: Latin America Market Value Share (%) and BPS Analysis by Country, 2023 to 2033

Figure 69: Latin America Market Y-o-Y Growth (%) Projections by Country, 2023 to 2033

Figure 70: Latin America Market Value (US$ Million) Analysis by Technology, 2018 to 2033

Figure 71: Latin America Market Volume (Units) Analysis by Technology, 2018 to 2033

Figure 72: Latin America Market Value Share (%) and BPS Analysis by Technology, 2023 to 2033

Figure 73: Latin America Market Y-o-Y Growth (%) Projections by Technology, 2023 to 2033

Figure 74: Latin America Market Value (US$ Million) Analysis by Door Type, 2018 to 2033

Figure 75: Latin America Market Volume (Units) Analysis by Door Type, 2018 to 2033

Figure 76: Latin America Market Value Share (%) and BPS Analysis by Door Type, 2023 to 2033

Figure 77: Latin America Market Y-o-Y Growth (%) Projections by Door Type, 2023 to 2033

Figure 78: Latin America Market Value (US$ Million) Analysis by Mounting type, 2018 to 2033

Figure 79: Latin America Market Volume (Units) Analysis by Mounting type, 2018 to 2033

Figure 80: Latin America Market Value Share (%) and BPS Analysis by Mounting type, 2023 to 2033

Figure 81: Latin America Market Y-o-Y Growth (%) Projections by Mounting type, 2023 to 2033

Figure 82: Latin America Market Value (US$ Million) Analysis by Sales Channel, 2018 to 2033

Figure 83: Latin America Market Volume (Units) Analysis by Sales Channel, 2018 to 2033

Figure 84: Latin America Market Value Share (%) and BPS Analysis by Sales Channel, 2023 to 2033

Figure 85: Latin America Market Y-o-Y Growth (%) Projections by Sales Channel, 2023 to 2033

Figure 86: Latin America Market Attractiveness by Technology, 2023 to 2033

Figure 87: Latin America Market Attractiveness by Door Type, 2023 to 2033

Figure 88: Latin America Market Attractiveness by Mounting type, 2023 to 2033

Figure 89: Latin America Market Attractiveness by Sales Channel, 2023 to 2033

Figure 90: Latin America Market Attractiveness by Country, 2023 to 2033

Figure 91: Europe Market Value (US$ Million) by Technology, 2023 to 2033

Figure 92: Europe Market Value (US$ Million) by Door Type, 2023 to 2033

Figure 93: Europe Market Value (US$ Million) by Mounting type, 2023 to 2033

Figure 94: Europe Market Value (US$ Million) by Sales Channel, 2023 to 2033

Figure 95: Europe Market Value (US$ Million) by Country, 2023 to 2033

Figure 96: Europe Market Value (US$ Million) Analysis by Country, 2018 to 2033

Figure 97: Europe Market Volume (Units) Analysis by Country, 2018 to 2033

Figure 98: Europe Market Value Share (%) and BPS Analysis by Country, 2023 to 2033

Figure 99: Europe Market Y-o-Y Growth (%) Projections by Country, 2023 to 2033

Figure 100: Europe Market Value (US$ Million) Analysis by Technology, 2018 to 2033

Figure 101: Europe Market Volume (Units) Analysis by Technology, 2018 to 2033

Figure 102: Europe Market Value Share (%) and BPS Analysis by Technology, 2023 to 2033

Figure 103: Europe Market Y-o-Y Growth (%) Projections by Technology, 2023 to 2033

Figure 104: Europe Market Value (US$ Million) Analysis by Door Type, 2018 to 2033

Figure 105: Europe Market Volume (Units) Analysis by Door Type, 2018 to 2033

Figure 106: Europe Market Value Share (%) and BPS Analysis by Door Type, 2023 to 2033

Figure 107: Europe Market Y-o-Y Growth (%) Projections by Door Type, 2023 to 2033

Figure 108: Europe Market Value (US$ Million) Analysis by Mounting type, 2018 to 2033

Figure 109: Europe Market Volume (Units) Analysis by Mounting type, 2018 to 2033

Figure 110: Europe Market Value Share (%) and BPS Analysis by Mounting type, 2023 to 2033

Figure 111: Europe Market Y-o-Y Growth (%) Projections by Mounting type, 2023 to 2033

Figure 112: Europe Market Value (US$ Million) Analysis by Sales Channel, 2018 to 2033

Figure 113: Europe Market Volume (Units) Analysis by Sales Channel, 2018 to 2033

Figure 114: Europe Market Value Share (%) and BPS Analysis by Sales Channel, 2023 to 2033

Figure 115: Europe Market Y-o-Y Growth (%) Projections by Sales Channel, 2023 to 2033

Figure 116: Europe Market Attractiveness by Technology, 2023 to 2033

Figure 117: Europe Market Attractiveness by Door Type, 2023 to 2033

Figure 118: Europe Market Attractiveness by Mounting type, 2023 to 2033

Figure 119: Europe Market Attractiveness by Sales Channel, 2023 to 2033

Figure 120: Europe Market Attractiveness by Country, 2023 to 2033

Figure 121: East Asia Market Value (US$ Million) by Technology, 2023 to 2033

Figure 122: East Asia Market Value (US$ Million) by Door Type, 2023 to 2033

Figure 123: East Asia Market Value (US$ Million) by Mounting type, 2023 to 2033

Figure 124: East Asia Market Value (US$ Million) by Sales Channel, 2023 to 2033

Figure 125: East Asia Market Value (US$ Million) by Country, 2023 to 2033

Figure 126: East Asia Market Value (US$ Million) Analysis by Country, 2018 to 2033

Figure 127: East Asia Market Volume (Units) Analysis by Country, 2018 to 2033

Figure 128: East Asia Market Value Share (%) and BPS Analysis by Country, 2023 to 2033

Figure 129: East Asia Market Y-o-Y Growth (%) Projections by Country, 2023 to 2033

Figure 130: East Asia Market Value (US$ Million) Analysis by Technology, 2018 to 2033

Figure 131: East Asia Market Volume (Units) Analysis by Technology, 2018 to 2033

Figure 132: East Asia Market Value Share (%) and BPS Analysis by Technology, 2023 to 2033

Figure 133: East Asia Market Y-o-Y Growth (%) Projections by Technology, 2023 to 2033

Figure 134: East Asia Market Value (US$ Million) Analysis by Door Type, 2018 to 2033

Figure 135: East Asia Market Volume (Units) Analysis by Door Type, 2018 to 2033

Figure 136: East Asia Market Value Share (%) and BPS Analysis by Door Type, 2023 to 2033

Figure 137: East Asia Market Y-o-Y Growth (%) Projections by Door Type, 2023 to 2033

Figure 138: East Asia Market Value (US$ Million) Analysis by Mounting type, 2018 to 2033

Figure 139: East Asia Market Volume (Units) Analysis by Mounting type, 2018 to 2033

Figure 140: East Asia Market Value Share (%) and BPS Analysis by Mounting type, 2023 to 2033

Figure 141: East Asia Market Y-o-Y Growth (%) Projections by Mounting type, 2023 to 2033

Figure 142: East Asia Market Value (US$ Million) Analysis by Sales Channel, 2018 to 2033

Figure 143: East Asia Market Volume (Units) Analysis by Sales Channel, 2018 to 2033

Figure 144: East Asia Market Value Share (%) and BPS Analysis by Sales Channel, 2023 to 2033

Figure 145: East Asia Market Y-o-Y Growth (%) Projections by Sales Channel, 2023 to 2033

Figure 146: East Asia Market Attractiveness by Technology, 2023 to 2033

Figure 147: East Asia Market Attractiveness by Door Type, 2023 to 2033

Figure 148: East Asia Market Attractiveness by Mounting type, 2023 to 2033

Figure 149: East Asia Market Attractiveness by Sales Channel, 2023 to 2033

Figure 150: East Asia Market Attractiveness by Country, 2023 to 2033

Figure 151: South Asia Market Value (US$ Million) by Technology, 2023 to 2033

Figure 152: South Asia Market Value (US$ Million) by Door Type, 2023 to 2033

Figure 153: South Asia Market Value (US$ Million) by Mounting type, 2023 to 2033

Figure 154: South Asia Market Value (US$ Million) by Sales Channel, 2023 to 2033

Figure 155: South Asia Market Value (US$ Million) by Country, 2023 to 2033

Figure 156: South Asia Market Value (US$ Million) Analysis by Country, 2018 to 2033

Figure 157: South Asia Market Volume (Units) Analysis by Country, 2018 to 2033

Figure 158: South Asia Market Value Share (%) and BPS Analysis by Country, 2023 to 2033

Figure 159: South Asia Market Y-o-Y Growth (%) Projections by Country, 2023 to 2033

Figure 160: South Asia Market Value (US$ Million) Analysis by Technology, 2018 to 2033

Figure 161: South Asia Market Volume (Units) Analysis by Technology, 2018 to 2033

Figure 162: South Asia Market Value Share (%) and BPS Analysis by Technology, 2023 to 2033

Figure 163: South Asia Market Y-o-Y Growth (%) Projections by Technology, 2023 to 2033

Figure 164: South Asia Market Value (US$ Million) Analysis by Door Type, 2018 to 2033

Figure 165: South Asia Market Volume (Units) Analysis by Door Type, 2018 to 2033

Figure 166: South Asia Market Value Share (%) and BPS Analysis by Door Type, 2023 to 2033

Figure 167: South Asia Market Y-o-Y Growth (%) Projections by Door Type, 2023 to 2033

Figure 168: South Asia Market Value (US$ Million) Analysis by Mounting type, 2018 to 2033

Figure 169: South Asia Market Volume (Units) Analysis by Mounting type, 2018 to 2033

Figure 170: South Asia Market Value Share (%) and BPS Analysis by Mounting type, 2023 to 2033

Figure 171: South Asia Market Y-o-Y Growth (%) Projections by Mounting type, 2023 to 2033

Figure 172: South Asia Market Value (US$ Million) Analysis by Sales Channel, 2018 to 2033

Figure 173: South Asia Market Volume (Units) Analysis by Sales Channel, 2018 to 2033

Figure 174: South Asia Market Value Share (%) and BPS Analysis by Sales Channel, 2023 to 2033

Figure 175: South Asia Market Y-o-Y Growth (%) Projections by Sales Channel, 2023 to 2033

Figure 176: South Asia Market Attractiveness by Technology, 2023 to 2033

Figure 177: South Asia Market Attractiveness by Door Type, 2023 to 2033

Figure 178: South Asia Market Attractiveness by Mounting type, 2023 to 2033

Figure 179: South Asia Market Attractiveness by Sales Channel, 2023 to 2033

Figure 180: South Asia Market Attractiveness by Country, 2023 to 2033

Figure 181: Oceania Market Value (US$ Million) by Technology, 2023 to 2033

Figure 182: Oceania Market Value (US$ Million) by Door Type, 2023 to 2033

Figure 183: Oceania Market Value (US$ Million) by Mounting type, 2023 to 2033

Figure 184: Oceania Market Value (US$ Million) by Sales Channel, 2023 to 2033

Figure 185: Oceania Market Value (US$ Million) by Country, 2023 to 2033

Figure 186: Oceania Market Value (US$ Million) Analysis by Country, 2018 to 2033

Figure 187: Oceania Market Volume (Units) Analysis by Country, 2018 to 2033

Figure 188: Oceania Market Value Share (%) and BPS Analysis by Country, 2023 to 2033

Figure 189: Oceania Market Y-o-Y Growth (%) Projections by Country, 2023 to 2033

Figure 190: Oceania Market Value (US$ Million) Analysis by Technology, 2018 to 2033

Figure 191: Oceania Market Volume (Units) Analysis by Technology, 2018 to 2033

Figure 192: Oceania Market Value Share (%) and BPS Analysis by Technology, 2023 to 2033

Figure 193: Oceania Market Y-o-Y Growth (%) Projections by Technology, 2023 to 2033

Figure 194: Oceania Market Value (US$ Million) Analysis by Door Type, 2018 to 2033

Figure 195: Oceania Market Volume (Units) Analysis by Door Type, 2018 to 2033

Figure 196: Oceania Market Value Share (%) and BPS Analysis by Door Type, 2023 to 2033

Figure 197: Oceania Market Y-o-Y Growth (%) Projections by Door Type, 2023 to 2033

Figure 198: Oceania Market Value (US$ Million) Analysis by Mounting type, 2018 to 2033

Figure 199: Oceania Market Volume (Units) Analysis by Mounting type, 2018 to 2033

Figure 200: Oceania Market Value Share (%) and BPS Analysis by Mounting type, 2023 to 2033

Figure 201: Oceania Market Y-o-Y Growth (%) Projections by Mounting type, 2023 to 2033

Figure 202: Oceania Market Value (US$ Million) Analysis by Sales Channel, 2018 to 2033

Figure 203: Oceania Market Volume (Units) Analysis by Sales Channel, 2018 to 2033

Figure 204: Oceania Market Value Share (%) and BPS Analysis by Sales Channel, 2023 to 2033

Figure 205: Oceania Market Y-o-Y Growth (%) Projections by Sales Channel, 2023 to 2033

Figure 206: Oceania Market Attractiveness by Technology, 2023 to 2033

Figure 207: Oceania Market Attractiveness by Door Type, 2023 to 2033

Figure 208: Oceania Market Attractiveness by Mounting type, 2023 to 2033

Figure 209: Oceania Market Attractiveness by Sales Channel, 2023 to 2033

Figure 210: Oceania Market Attractiveness by Country, 2023 to 2033

Figure 211: MEA Market Value (US$ Million) by Technology, 2023 to 2033

Figure 212: MEA Market Value (US$ Million) by Door Type, 2023 to 2033

Figure 213: MEA Market Value (US$ Million) by Mounting type, 2023 to 2033

Figure 214: MEA Market Value (US$ Million) by Sales Channel, 2023 to 2033

Figure 215: MEA Market Value (US$ Million) by Country, 2023 to 2033

Figure 216: MEA Market Value (US$ Million) Analysis by Country, 2018 to 2033

Figure 217: MEA Market Volume (Units) Analysis by Country, 2018 to 2033

Figure 218: MEA Market Value Share (%) and BPS Analysis by Country, 2023 to 2033

Figure 219: MEA Market Y-o-Y Growth (%) Projections by Country, 2023 to 2033

Figure 220: MEA Market Value (US$ Million) Analysis by Technology, 2018 to 2033

Figure 221: MEA Market Volume (Units) Analysis by Technology, 2018 to 2033

Figure 222: MEA Market Value Share (%) and BPS Analysis by Technology, 2023 to 2033

Figure 223: MEA Market Y-o-Y Growth (%) Projections by Technology, 2023 to 2033

Figure 224: MEA Market Value (US$ Million) Analysis by Door Type, 2018 to 2033

Figure 225: MEA Market Volume (Units) Analysis by Door Type, 2018 to 2033

Figure 226: MEA Market Value Share (%) and BPS Analysis by Door Type, 2023 to 2033

Figure 227: MEA Market Y-o-Y Growth (%) Projections by Door Type, 2023 to 2033

Figure 228: MEA Market Value (US$ Million) Analysis by Mounting type, 2018 to 2033

Figure 229: MEA Market Volume (Units) Analysis by Mounting type, 2018 to 2033

Figure 230: MEA Market Value Share (%) and BPS Analysis by Mounting type, 2023 to 2033

Figure 231: MEA Market Y-o-Y Growth (%) Projections by Mounting type, 2023 to 2033

Figure 232: MEA Market Value (US$ Million) Analysis by Sales Channel, 2018 to 2033

Figure 233: MEA Market Volume (Units) Analysis by Sales Channel, 2018 to 2033

Figure 234: MEA Market Value Share (%) and BPS Analysis by Sales Channel, 2023 to 2033

Figure 235: MEA Market Y-o-Y Growth (%) Projections by Sales Channel, 2023 to 2033

Figure 236: MEA Market Attractiveness by Technology, 2023 to 2033

Figure 237: MEA Market Attractiveness by Door Type, 2023 to 2033

Figure 238: MEA Market Attractiveness by Mounting type, 2023 to 2033

Figure 239: MEA Market Attractiveness by Sales Channel, 2023 to 2033

Figure 240: MEA Market Attractiveness by Country, 2023 to 2033

Explore Process Automation Insights

View Reports

Commercial Walk in Freezer Market