Composable-Disaggregated Infrastructure Market
Market Insights on Composable-Disaggregated Infrastructure covering sales outlook, demand forecast & up-to-date key trends
Composable-Disaggregated Infrastructure Market By Component (Disaggregated Hardware, Composable Software, Services), End Users (Cloud Providers, Colocation Providers, Enterprises), Enterprise Size (Small and Medium Enterprises, Large Enterprises) & Region - Forecast to 2021 - 2031
Composable-Disaggregated Infrastructure Industry Snapshot
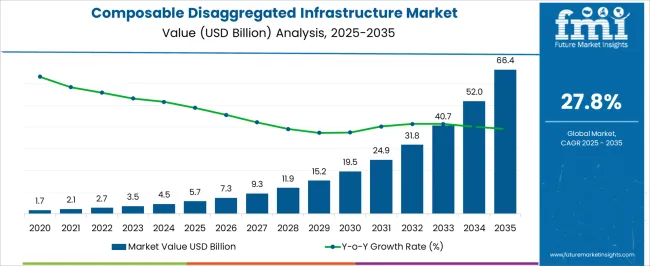
[312 pages] The composable-disaggregated infrastructure solutions revenue totalled ~US$ 1.8 Bn for 2020, according to Future Market Insights. The overall market is expected to reach ~US$ 22.7 Bn by 2031, at a CAGR of 26.3% through 2031. The demand for composable-disaggregated infrastructure solutions will accelerate with top 5 providers holding around 55.5% of total market in 2020.
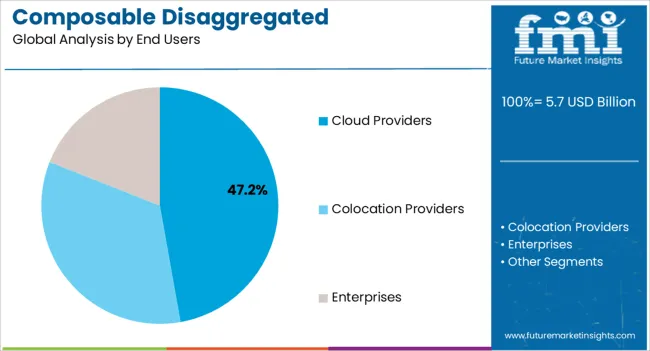
Newly released data on the composable-disaggregated infrastructure demand outlook indicates 24.5% y-o-y growth in 2021. Among end users, the market share for cloud providers segment is largest among all. However, the enterprise segment will grow at 28.6% CAGR to remain dominant through the assessment period.
Let us know your requirement to get
100% FREE customization
Key Points Covered
- Market estimates and forecast 2016-2031
- Key drivers and restraints impacting market growth
- Segment-wise, Country-wise, and Region-wise Analysis
- Competition Mapping and Benchmarking
- Market Share Analysis
- Key Product Innovations and Regulatory Climate
- COVID-19 Impact on Composable-Disaggregated Infrastructure market and how to Navigate
- Recommendation on Key Winning Strategies
2016-2020 Composable-Disaggregated Infrastructure Demand Outlook Compared to 2021-2031 Forecast
Enterprises are generating more data than ever, but they also need applications that can make sense of all this information. Many are turning to AI, big data analytics and other advanced technologies that can derive meaningful insights from the data. Such applications require adequate IT infrastructure to support them.
Infrastructure alone is seldom enough. Requirements can vary significantly from one application to the next and even fluctuate within the same application. These changing application requirements make it difficult for traditional infrastructure to meet the demands of the advanced workloads. For this reason, many organizations are now looking to composable disaggregated infrastructure.
The sales for composable-disaggregated infrastructure solutions is estimated to rise at 26.3% CAGR between 2021 and 2031 in comparison with 22.2% CAGR registered during 2016-2020.
Integration with automation software assembling components dynamically into a complete solution for the workload is one of the primary growth factors for the market. Increasing number of IT enterprises are shifting to DevOps methodology for application development is also expected to contribute significantly to the composable disaggregated infrastructure market. Overall, dynamic applications of composable disaggregated infrastructure, and the growing awareness of them, is what drives the overall industry growth.
The global composable-disaggregated infrastructure growth scenario is anticipated to witness an increase in revenue from US$ 2.2 Bn in 2021 to US$ 39.5 Bn by 2031.
How Demand for New Memory-Centric Infrastructure Shaping the Market Growth?
Data-hungry applications will create demand for new infrastructure architectures that can provide cloudlike agility and scale but with the on-premises security. Such infrastructure will need to shed the compute-centric design and be built using newer (radical) memory-centric principles. Composable-disaggregated infrastructure is an avenue to achieving that reality. Memory-centric infrastructure platforms built with low-latency, high-bandwidth fabrics have the potential to indelibly change the server and storage market dynamics.
Furthermore, the traditional siloed datacenter architectures are unable to provide flexibility required by business critical applications of modern world. Additionally, increasing number of IT enterprises are shifting to DevOps methodology for application development, which requires an agile infrastructure to keep up with the rapidly evolving application demands and often uses an “infrastructure as code” approach to optimize allocation of resources.
What Is the Impact of COVID-19 Crisis on Composable-Disaggregated Infrastructure Solutions Demand?
The rapid spread of COVID-19 has disrupted the world’s economy. IT service companies have also experienced significant slowdown in growth during this period. However, IT infrastructure still remains the backbone of smooth business operations.
There has been significant increase in demand for IT infrastructure monitoring tools as a result of COVID-19 lockdown measures, as most employees are working remotely. Companies are making their IT departments ensure that all applications that are required for business operations are running smoothly for all the employees. Thus, during the pandemic period, demand for IT infrastructure monitoring tools has surged.
Over the past few years, there is increasing demand for data globally. Although the digital transformation has been underway for some time, the COVID-19 pandemic has accelerated the transition. Enterprises of all sizes are expanding rapidly, driving demand for robust regional IT infrastructure. Countries has experienced intensified data demand during the pandemic and underscored the importance of digital technology and data centers. Thus, all the major countries have experienced an increase in demand for data centers during the pandemic.
Thus, the demand for composable-disaggregated infrastructure is estimated to witness a noteworthy growth from around 21.7% to 24.5% Y-o-Y from 2019 to 2021.
Find your sweet spots for generating winning opportunities in this market.
Talk to AnalystCountry-wise Insights
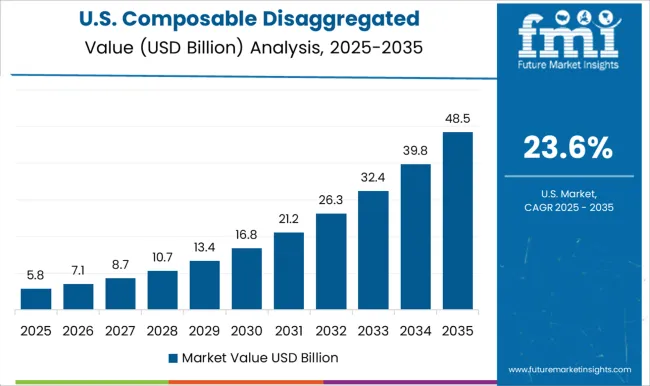
How Big is the Opportunity in the U.S.?
North America is predicted to remain one of the most attractive markets during the forecast period, according to Future Market Insights. According to the study, the U.S. is expected to account for more than 79% of the North America share through 2031.
Presence of well-established players, such as HPE, Dell, DriveScale, and Liqid Inc. is the major factor driving the market growth in the U.S. Growing demand for enterprise applications and simplification of existing IT with the advent of new technologies are also improving the demand.
Furthermore, surging demand for scalability in solutions, reduction in operational expenditure, and low total ownership cost on IT infrastructure are the prime factors driving the growth of the composable-disaggregated infrastructure demand in the U.S.
The economy of the U.S. comprises a better infrastructure and hence can provide better internet penetration. This helps in faster implementation of new technologies, which is driving the adoption of composable-disaggregated infrastructure in the U.S.
How will the Growth of Composable-Disaggregated Infrastructure Unfold in India?
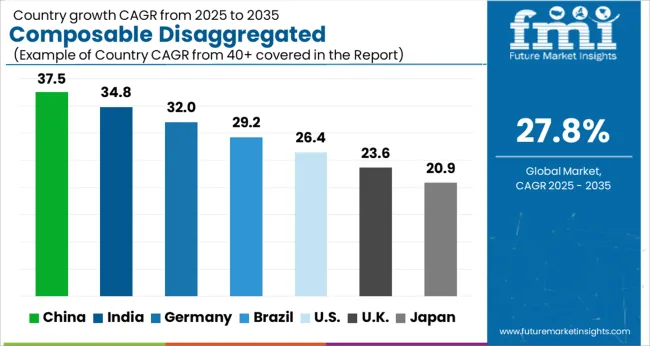
Sales in India is estimated to exhibit tremendous growth at 35% CAGR between 2021 & 2031. Demand for composable-disaggregated infrastructure has increased rapidly in major economies of South Asia and Pacific, including India, Australia and New Zealand, which has created lucrative growth opportunities for market participants.
Government in India has implemented a number of ICT initiatives under the National e-Governance Plan (NeGP), including creation of ICT infrastructure both at the centre and state levels.
The infrastructure thus created will provide the basis for adoption of cloud computing for the government with the objective of making optimum use of existing infrastructure, reuse of applications, efficient service delivery to the citizens, and increasing the number of e-transactions in the country, thus helping achieve the ultimate goal of NeGP.
Consequently, demand for composable-disaggregated infrastructure solutions is projected to rise at an impressive rate as enterprises seek cost-efficient solutions.
How is China Contributing Towards the Composable-Disaggregated Infrastructure Sales?
Demand for composable-disaggregated infrastructure in China is estimated to account for a total sale of US$ 210.5 Mn by 2021-end. Small- and medium-sized businesses in China are adopting public and private cloud offerings for their digital transformation strategies, while enterprises are adopting a multi-cloud, hybrid approach.
For all these scenarios, both, IT and DevOps teams are tasked with managing the ever-increasing complexity of the infrastructure to provide a better user experience.
Furthermore, China's growing adoption and optimization of digital services emphasizes the need to deliver top-notch user experience to customers. Companies are actively engaged in bridging the operational gap for DevOps and IT teams with their deep monitoring insights that provide better visibility into performance trends and user impact, reducing time to repair and refine.
Categorywise Insights
Why is the Demand for Disaggregated Hardware Continuously Rising?
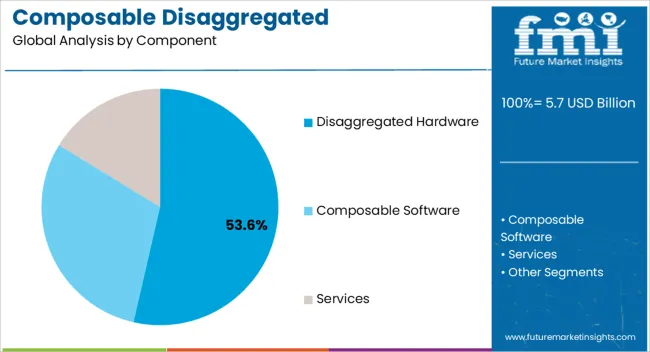
Based on component, disaggregated hardware is expected to contribute for nearly 63% of the overall share in 2021. Initial disaggregation of subsystems within physical servers begins with the decoupling of the storage and networking from the CPU and memory.
Networking is shared by all resources, CPU and memory are housed on distinct nodes/trays from storage trays/nodes, and latency complications still prevent the separation of CPU from the memory.
The disaggregation of the components provides ample flexibility in the architecture to achieve the best ratio of compute to I/O to storage for a wide range of workloads and provides the ability to compose optimal configurations to address compute-intensive, data-intensive, and/or balanced workloads based on the unique requirements of specific applications.
Why Enterprises Mostly Prefer the Composable-Disaggregated Infrastructure?
The enterprises segment, among end users, is projected to register a massive demand, exhibiting noteworthy growth at a CAGR of 28.6% over the coming years. In today's enterprise, data can come from transactional systems, IoT devices, social media sites, web logs, user devices, monitored IT systems and a variety of other sources.
By deriving insights from this data, organizations can realize multiple benefits. For example, they might use this information to optimize IT operations or increase employee productivity. Alternatively, they might use it to improve customer services or gain competitive edge.
Resources become elastic building blocks for delivering an optimal environment that's provisioned and configured to support a specific workload without having to wait on lengthy IT allocation processes.
With composable-disaggregated infrastructure, enterprises can enhance configurations as workload requirements change, assembling and reassembling resources in response to evolving application and business requirements.
When the application no longer needs those resources, they're returned to the resource pool and are ready for use by other applications. Thus, enterprises are likely to witness tremendous growth over the forecast period.
What are the Prospects for Sales of Composable-Disaggregated Infrastructure Solutions for SMEs?
In terms of enterprise size, the market is segmented into small & medium enterprises (SMEs) and large enterprises. The SMEs segment is expected to register astounding growth at a CAGR of 27.9%, while also creating an incremental opportunity of US$ 9.7 Bn through 2031.
With today’s cutting-edge technologies, the IT landscapes of small- and mid-sized organizations tend to be just as complex as those of larger counterparts, just on a much smaller scale.
A sound IT infrastructure, including the company network, is just as important to small- and mid-sized companies as it is to larger businesses. However, smaller companies often have small IT teams or even a single administrator.
Hence, auxiliary tools such as composable-disaggregated infrastructure solutions are gaining immense popularity among smaller businesses.
Composable-disaggregated infrastructure has the potential to deliver incalculable value to mid-sized companies. Consequently, paving a way for lucrative opportunities within small- and mid-sized enterprises. Thereby propelling market growth.

An unified Market Research Subscription Platform, built for today’s disparate research needs.
Competitive Landscape
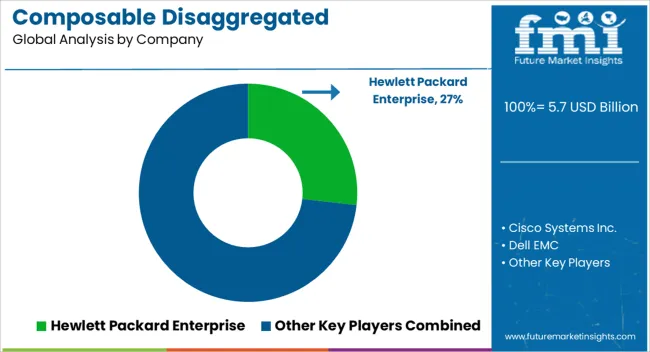
The composable-disaggregated infrastructure industry is highly concentrated and controlled by dominant players, like Hewlett Packard Enterprise, Cisco Systems Inc., Dell EMC, and Ericsson.
Key companies are focusing on introduction of new solutions and strategic partnerships to increase their business revenue. However, with product innovations and technological advancements, midsize to smaller firms are growing their market presence by securing new contracts and tapping new markets.
- For instance, in February 2021, Dell Technologies announced an investment of US$ 50 million over three years since 2019 in the establishment of a Global Innovation Hub (GIH) in Singapore. The GIH will focus on advancing multiple growth areas for digital transformation including augmented/mixed reality, data analytics, cloud-native, cybersecurity and edge computing. It will also be the home to a specialized team responsible for enhancing user experiences through innovation.
Scope of Report
Attribute |
Details |
Forecast Period |
2021-2031 |
Historical Data Available for |
2016-2020 |
Market Analysis |
USD Million for Value |
Key Regions Covered |
North America, Latin America, Europe, East Asia, South Asia & Pacific, and the Middle East & Africa |
Key Countries Covered |
US, Canada, Germany, U.K., France, Italy, Spain, Russia, China, Japan, South Korea, India, Malaysia, Indonesia, Singapore, Australia & New Zealand, GCC Countries, Turkey, North Africa and South Africa |
Key Segments Covered |
Component, End User, Enterprise Size, and Region |
Key Companies Profiled |
|
Report Coverage |
Market Forecast, Company Share Analysis, Competition Intelligence, DROT Analysis, Market Dynamics and Challenges, and Strategic Growth Initiatives |
Customization & Pricing |
Available upon Request |
Key Highlights from Report
-
Which region is expected to showcase significant growth in composable-disaggregated infrastructure solutions demand?
South Asia & Pacific are expected to register strong growth in the market at 32.8% CAGR between 2021 & 2031. However, North America currently leads the market, with share of ~29% in 2021.
-
Which is the most attractive component in the composable-disaggregated infrastructure market?
Disaggregated hardware is currently the most attractive, accounting for over 62% of revenue generated in 2020. Moreover, the segment is expected to witness robust growth at a CAGR of 27% throughout the forecast period.
-
Which are some of the leading companies offering composable-disaggregated infrastructure solutions?
Some of the leading market players are Hewlett Packard Enterprise, Cisco Systems, and DriveScale, among others. Nearly 75% of the market share is currently covered by the top 9 players.
-
Who are the leading end users of composable-disaggregated infrastructure solutions?
Cloud providers segment is expected to dominate over the forecast period, generating revenue of US$ 10.1 Bn by 2031. However, enterprises segment is likely to expand with a CAGR of ~28% through 2031.
-
How much is the global composable-disaggregated infrastructure demand worth?
The market was valued at ~US$ 1.8 Bn in 2020, and is estimated to grow at an exceptional pace with a CAGR of 26.3% to reach ~US$ 22.7 Bn in 2031.
-
What will be the demand outlook/ sales forecast for Composable-Disaggregated infrastructure?
Sales of composable-disaggregated infrastructure solutions is expected to be valued at ~US$ 2.2 Bn by the end of 2021, and is likely to reach ~US$ 22.7 Bn by 2031.
-
At what rate did the composable-disaggregated infrastructure market grow during 2016-2020?
The market in last 5 years (2016 – 2020) grew at a CAGR of 22.2%.
-
What is driving demand of composable-disaggregated infrastructure?
Increase in business analytics workload, implementation of methodologies such as DevOps, increased customer expectations, rise of automation and standardization tools and emergence of hybrid cloud are the key factors driving the market growth.
-
Which countries are key providers of Composable-Disaggregated infrastructure solutions?
Countries involved in providing Composable-Disaggregated Infrastructure solutions include the U.S., India, U.K., and Japan.
-
What is the current composable-disaggregated infrastructure market value?
The global composable-disaggregated infrastructure market is expected to register growth at 24.5% CAGR in 2021.
-
What are the top 5 countries driving demand?
Top 5 countries driving demand for composable-disaggregated infrastructure include the U.S., Japan, India, Germany, and U.K.
-
What is the North America Market Outlook?
North America is predicted to remain most attractive markets during the forecast period, according to FMI. The U.S. is expected to account for over 79% of the North America market through 2031.
-
How will the Europe composable-disaggregated infrastructure industry growth unfold?
The composable-disaggregated infrastructure industry in Europe is estimated to expand at a CAGR of 22.2% over the forecast period.
-
What is the key market statistics in South Korea and Japan?
The demand in Japan and South Korea was valued at US$ 102.5 Mn and US$ 59.5 Mn in 2020, respectively, and is projected to register CAGR of 27.3% and 29.3% through 2031.
Composable-Disaggregated Infrastructure Outlook by Category
By Component:
- Disaggregated Hardware
- Composable Software
- Services
By End Users:
- Cloud Providers
- Colocation Providers
- Enterprises
By Enterprise Size:
- Small and Medium Enterprises (SMEs)
- Large Enterprises
By Region:
- North America
- Latin America
- Europe
- East Asia
- South Asia & Pacific
- Middle East and Africa (MEA)
Frequently Asked Questions
The composable-dissagregated Infrastructure market is predicted to grow at 26.3% CAGR through 2032.
India composable-dissagregated Infrastructure market holds the highest growth potential.
The composable-dissagregated Infrastructure market is expected to surpass US$ 29.6 Billion by 2032.
The composable-dissagregated Infrastructure market size is anticipated to be over US$ 2.9 Billion in 2022.
Table of Content
1. Executive Summary
1.1. Global Market Outlook
1.2. Demand Side Trends
1.3. Supply Side Trends
1.4. Analysis and Recommendations
2. Market Overview
2.1. Market Coverage / Taxonomy
2.2. Market Definition / Scope / Limitations
3. Key Market Trends
3.1. Key Trends Impacting the Market
3.2. Composable-Disaggregated Infrastructures Innovation / Development Trends
3.3. Key Success Factors
4. Pricing Analysis
4.1. Pricing Analysis, By Component
4.2. Average Pricing Analysis Benchmark
5. Market Structure Analysis
5.1. Market Share Analysis, By Vendors
5.2. Market Presence Analysis, By Regional Footprint
5.3. Market Analysis by Revenue Tier of Vendors (Tier 1/2/3)
6. Composable-Disaggregated Infrastructure Systems, Key Attributes
6.1. Independent Scaling
6.2. Unified APIs
6.3. Management and Templates
6.4. Others
7. COVID-19 Pandemic Crisis Impact Analysis
7.1. Impact of COVID-19 Pandemic Crisis on Composable-Disaggregated Infrastructure Market
7.1.1. Pre-COVID-19 Analysis
7.1.2. Post-COVID-19 Analysis
7.2. Expected Recovery Scenario (Short-term / Mid-term / Long-term)
7.3. Key Action Points for Composable-Disaggregated Infrastructure Vendors
8. Global Composable-Disaggregated Infrastructure Market Demand (in Value in US$ Mn) Analysis 2016-2020 and Forecast, 2021-2031
8.1. Historical Market Value (US$ Mn) Analysis, 2016-2020
8.2. Current and Future Market Value (US$ Mn) Projections, 2021-2031
8.2.1. Y-o-Y Growth Trend Analysis
8.2.2. Absolute $ Opportunity Analysis
9. Global Composable-Disaggregated Infrastructure Market Demand (Volume in Mn Units) Analysis 2016-2020 and Forecast, 2021-2031
9.1. Historical Market Volume (Mn Units) Analysis, 2016-2020
9.2. Current and Future Market Volume (Mn Units) Projections, 2021-2031
9.2.1. Y-o-Y Growth Trend Analysis
10. Market Background
10.1. Macro-Economic Factors
10.1.1. Global GDP Growth Outlook
10.1.2. Global ICT Market Outlook
10.1.3. Regulations & Norms
10.2. Forecast Factors - Relevance & Impact
10.2.1. Historic Growth Rate of Composable-Disaggregated Infrastructure Vendors
10.2.2. Business Impact of COVID-19 on Global Economy
10.2.3. Composable Infrastructure Market Growth
10.2.4. Global Data Center Market Outlook
10.3. Market Dynamics
10.3.1. Drivers
10.3.2. Restraints
10.3.3. Opportunities
11. Global Composable-Disaggregated Infrastructure Market Analysis 2016-2020 and Forecast 2021-2031, by Component
11.1. Introduction / Key Findings
11.2. Historical Market Size (US$ Mn) Analysis By Component, 2016 - 2020
11.3. Current and Future Market Size (US$ Mn) Analysis and Forecast By Component, 2021 - 2031
11.3.1. Disaggregated Hardware
11.3.2. Composable software
11.3.3. Services
11.3.3.1. Professional Services
11.3.3.1.1. Consulting Services
11.3.3.1.2. Support & Maintenance
11.3.3.1.3. Integration & Deployment Services
11.3.3.2. Managed Services
11.4. Market Attractiveness Analysis By Component
12. Global Composable-Disaggregated Infrastructure Market Analysis 2016-2020 and Forecast 2021-2031, by Enterprise Size
12.1. Introduction / Key Findings
12.2. Historical Market Size (US$ Mn) Analysis By Enterprise Size, 2016 - 2020
12.3. Current and Future Market Size (US$ Mn) Analysis and Forecast By Enterprise Size, 2021 - 2031
12.3.1. Large Enterprises
12.3.2. Small and Mid-sized Enterprises (SMEs)
12.4. Market Attractiveness Analysis By Enterprise Size
13. Global Composable-Disaggregated Infrastructure Market Analysis 2016-2020 and Forecast 2021-2031, by End User
13.1. Introduction / Key Findings
13.2. Historical Market Size (US$ Mn) Analysis By End User, 2016 - 2020
13.3. Current and Future Market Size (US$ Mn) Analysis and Forecast By End User, 2021 - 2031
13.3.1. Cloud Providers
13.3.2. Colocation providers
13.3.3. Enterprises
13.4. Market Attractiveness Analysis By End User
14. Global Composable-Disaggregated Infrastructure Market Analysis 2016-2020 and Forecast 2021-2031, by Region
14.1. Introduction / Key Findings
14.2. Historical Market Size (US$ Mn) Analysis By Region, 2016 - 2020
14.3. Current and Future Market Size (US$ Mn) Analysis and Forecast By Region, 2021 - 2031
14.3.1. North America
14.3.2. Latin America
14.3.3. Europe
14.3.4. East Asia
14.3.5. South Asia & Pacific
14.3.6. Middle East & Africa
14.4. Market Attractiveness Analysis By Region
15. North America Composable-Disaggregated Infrastructure Market Analysis 2016-2020 and Forecast 2021-2031
15.1. Introduction
15.2. Historical Market Size (US$ Mn) Trend Analysis By Market Taxonomy, 2016 - 2020
15.3. Current and Future Market Size (US$ Mn) Forecast By Market Taxonomy, 2021 - 2031
15.3.1. By Component
15.3.2. By Enterprise Size
15.3.3. By End User
15.3.4. By Country
15.3.4.1. U.S.
15.3.4.2. Canada
15.4. Market Attractiveness Analysis
15.4.1. By Component
15.4.2. By Enterprise Size
15.4.3. By End User
15.4.4. By Country
15.5. Market Trends
15.6. Key Market Participants - Intensity Mapping
16. Latin America Composable-Disaggregated Infrastructure Market Analysis 2016-2020 and Forecast 2021-2031
16.1. Introduction
16.2. Historical Market Size (US$ Mn) Trend Analysis By Market Taxonomy, 2016 - 2020
16.3. Current and Future Market Size (US$ Mn) Forecast By Market Taxonomy, 2021 - 2031
16.3.1. By Component
16.3.2. By Enterprise Size
16.3.3. By End User
16.3.4. By Country
16.3.4.1. Brazil
16.3.4.2. Mexico
16.3.4.3. Rest of Latin America
16.4. Market Attractiveness Analysis
16.4.1. By Component
16.4.2. By Enterprise Size
16.4.3. By End User
16.4.4. By Country
16.5. Market Trends
16.6. Key Market Participants - Intensity Mapping
17. Europe Composable-Disaggregated Infrastructure Market Analysis 2016-2020 and Forecast 2021-2031
17.1. Introduction
17.2. Historical Market Size (US$ Mn) Trend Analysis By Market Taxonomy, 2016 - 2020
17.3. Current and Future Market Size (US$ Mn) Forecast By Market Taxonomy, 2021 - 2031
17.3.1. By Component
17.3.2. By Enterprise Size
17.3.3. By End User
17.3.4. By Country
17.3.4.1. Germany
17.3.4.2. Italy
17.3.4.3. France
17.3.4.4. U.K.
17.3.4.5. Spain
17.3.4.6. BENELUX
17.3.4.7. Russia
17.3.4.8. Rest of Europe
17.4. Market Attractiveness Analysis
17.4.1. By Component
17.4.2. By Enterprise Size
17.4.3. By End User
17.4.4. By Country
17.5. Market Trends
17.6. Key Market Participants - Intensity Mapping
18. East Asia Composable-Disaggregated Infrastructure Market Analysis 2016-2020 and Forecast 2021-2031
18.1. Introduction
18.2. Historical Market Size (US$ Mn) Trend Analysis By Market Taxonomy, 2016 - 2020
18.3. Current and Future Market Size (US$ Mn) Forecast By Market Taxonomy, 2021 - 2031
18.3.1. By Component
18.3.2. By Enterprise Size
18.3.3. By End User
18.3.4. By Country
18.3.4.1. China
18.3.4.2. Japan
18.3.4.3. South Korea
18.4. Market Attractiveness Analysis
18.4.1. By Component
18.4.2. By Enterprise Size
18.4.3. By End User
18.4.4. By Country
18.5. Market Trends
18.6. Key Market Participants - Intensity Mapping
19. South Asia & Pacific Composable-Disaggregated Infrastructure Market Analysis 2016-2020 and Forecast 2021-2031
19.1. Introduction
19.2. Historical Market Size (US$ Mn) Trend Analysis By Market Taxonomy, 2016 - 2020
19.3. Current and Future Market Size (US$ Mn) Forecast By Market Taxonomy, 2021 - 2031
19.3.1. By Component
19.3.2. By Enterprise Size
19.3.3. By End User
19.3.4. By Country
19.3.4.1. India
19.3.4.2. Thailand
19.3.4.3. Indonesia
19.3.4.4. Malaysia
19.3.4.5. Australia & New Zealand
19.3.4.6. Rest of South Asia
19.4. Market Attractiveness Analysis
19.4.1. By Component
19.4.2. By Enterprise Size
19.4.3. By End User
19.4.4. By Country
19.5. Market Trends
19.6. Key Market Participants - Intensity Mapping
20. Middle East and Africa Composable-Disaggregated Infrastructure Market Analysis 2016-2020 and Forecast 2021-2031
20.1. Introduction
20.2. Historical Market Size (US$ Mn) Trend Analysis By Market Taxonomy, 2016 - 2020
20.3. Current and Future Market Size (US$ Mn) Forecast By Market Taxonomy, 2021 - 2031
20.3.1. By Component
20.3.2. By Enterprise Size
20.3.3. By End User
20.3.4. By Country
20.3.4.1. GCC Countries
20.3.4.2. Turkey
20.3.4.3. South Africa
20.3.4.4. Rest of Middle East and Africa
20.4. Market Attractiveness Analysis
20.4.1. By Component
20.4.2. By Enterprise Size
20.4.3. By End User
20.4.4. By Country
20.5. Market Trends
20.6. Key Market Participants - Intensity Mapping
21. Key Countries Analysis- Composable-Disaggregated Infrastructure Market
21.1. U.S. Composable-Disaggregated Infrastructure Market Analysis
21.1.1. By Component
21.1.2. By Enterprise Size
21.1.3. By End User
21.2. Canada Composable-Disaggregated Infrastructure Market Analysis
21.2.1. By Component
21.2.2. By Enterprise Size
21.2.3. By End User
21.3. Mexico Composable-Disaggregated Infrastructure Market Analysis
21.3.1. By Component
21.3.2. By Enterprise Size
21.3.3. By End User
21.4. Brazil Composable-Disaggregated Infrastructure Market Analysis
21.4.1. By Component
21.4.2. By Enterprise Size
21.4.3. By End User
21.5. Germany Composable-Disaggregated Infrastructure Market Analysis
21.5.1. By Component
21.5.2. By Enterprise Size
21.5.3. By End User
21.6. Italy Composable-Disaggregated Infrastructure Market Analysis
21.6.1. By Component
21.6.2. By Enterprise Size
21.6.3. By End User
21.7. France Composable-Disaggregated Infrastructure Market Analysis
21.7.1. By Component
21.7.2. By Enterprise Size
21.7.3. By End User
21.8. U.K. Composable-Disaggregated Infrastructure Market Analysis
21.8.1. By Component
21.8.2. By Enterprise Size
21.8.3. By End User
21.9. Spain Composable-Disaggregated Infrastructure Market Analysis
21.9.1. By Component
21.9.2. By Enterprise Size
21.9.3. By End User
21.10. BENELUX Composable-Disaggregated Infrastructure Market Analysis
21.10.1. By Component
21.10.2. By Enterprise Size
21.10.3. By End User
21.11. Russia Composable-Disaggregated Infrastructure Market Analysis
21.11.1. By Component
21.11.2. By Enterprise Size
21.11.3. By End User
21.12. China Composable-Disaggregated Infrastructure Market Analysis
21.12.1. By Component
21.12.2. By Enterprise Size
21.12.3. By End User
21.13. Japan Composable-Disaggregated Infrastructure Market Analysis
21.13.1. By Component
21.13.2. By Enterprise Size
21.13.3. By End User
21.14. South Korea Composable-Disaggregated Infrastructure Market Analysis
21.14.1. By Component
21.14.2. By Enterprise Size
21.14.3. By End User
21.15. India Composable-Disaggregated Infrastructure Market Analysis
21.15.1. By Component
21.15.2. By Enterprise Size
21.15.3. By End User
21.16. ASEAN Composable-Disaggregated Infrastructure Market Analysis
21.16.1. By Component
21.16.2. By Enterprise Size
21.16.3. By End User
21.17. Australia and New Zealand Composable-Disaggregated Infrastructure Market Analysis
21.17.1. By Component
21.17.2. By Enterprise Size
21.17.3. By End User
21.18. GCC Countries Composable-Disaggregated Infrastructure Market Analysis
21.18.1. By Component
21.18.2. By Enterprise Size
21.18.3. By End User
21.19. Turkey Composable-Disaggregated Infrastructure Market Analysis
21.19.1. By Component
21.19.2. By Enterprise Size
21.19.3. By End User
21.20. South Africa Composable-Disaggregated Infrastructure Market Analysis
21.20.1. By Component
21.20.2. By Enterprise Size
21.20.3. By End User
22. Competition Analysis
22.1. Dashboard for Key Composable-Disaggregated Infrastructure Vendors
22.2. Competition Deep Dive
22.2.1. Hewlett Packard Enterprise
22.2.1.1. Business Overview
22.2.1.2. Product & Service Portfolio
22.2.1.3. Key Financial Outlook (Business Segment/Region)
22.2.1.4. Key Market Developments
22.2.1.5. Strategy Overview
22.2.2. Cisco Systems Inc.
22.2.2.1. Business Overview
22.2.2.2. Product & Service Portfolio
22.2.2.3. Key Financial Outlook (Business Segment/Region)
22.2.2.4. Key Market Developments
22.2.2.5. Strategy Overview
22.2.3. Dell EMC
22.2.3.1. Business Overview
22.2.3.2. Product & Service Portfolio
22.2.3.3. Key Financial Outlook (Business Segment/Region)
22.2.3.4. Key Market Developments
22.2.3.5. Strategy Overview
22.2.4. Ericsson
22.2.4.1. Business Overview
22.2.4.2. Product & Service Portfolio
22.2.4.3. Key Financial Outlook (Business Segment/Region)
22.2.4.4. Key Market Developments
22.2.4.5. Strategy Overview
22.2.5. DriveScale, Inc. (Twitter)
22.2.5.1. Business Overview
22.2.5.2. Product & Service Portfolio
22.2.5.3. Key Financial Outlook (Business Segment/Region)
22.2.5.4. Key Market Developments
22.2.5.5. Strategy Overview
22.2.6. Wiwynn
22.2.6.1. Business Overview
22.2.6.2. Product & Service Portfolio
22.2.6.3. Key Financial Outlook (Business Segment/Region)
22.2.6.4. Key Market Developments
22.2.6.5. Strategy Overview
22.2.7. Liqid Inc.
22.2.7.1. Business Overview
22.2.7.2. Product & Service Portfolio
22.2.7.3. Key Financial Outlook (Business Segment/Region)
22.2.7.4. Key Market Developments
22.2.7.5. Strategy Overview
22.2.8. Fungible, Inc.
22.2.8.1. Business Overview
22.2.8.2. Product & Service Portfolio
22.2.8.3. Key Financial Outlook (Business Segment/Region)
22.2.8.4. Key Market Developments
22.2.8.5. Strategy Overview
22.2.9. TidalScale
22.2.9.1. Business Overview
22.2.9.2. Product & Service Portfolio
22.2.9.3. Key Financial Outlook (Business Segment/Region)
22.2.9.4. Key Market Developments
22.2.9.5. Strategy Overview
23. Assumptions and Acronyms Used
24. Research Methodology
Let us know your requirement to get
100% FREE customization
List of Tables
Table 01: Global Composable-Disaggregated Infrastructure Market Value (US$ Mn) Analysis (2016 – 2020) by Component
Table 02: Global Composable-Disaggregated Infrastructure Market Value (US$ Mn) Analysis (2021 – 2031) by Component
Table 03: Global Composable-Disaggregated Infrastructure Market Value (US$ Mn) Analysis (2016 – 2020) by Enterprise Size
Table 04: Global Composable-Disaggregated Infrastructure Market Value (US$ Mn) Analysis (2021 – 2031) by Enterprise Size
Table 05: Global Composable-Disaggregated Infrastructure Market Value (US$ Mn) Analysis (2016 – 2020) by End user
Table 06: Global Composable-Disaggregated Infrastructure Market Value (US$ Mn) Forecast (2021 – 2031) by End user
Table 07: Global Composable-Disaggregated Infrastructure Market Value (US$ Mn) Analysis (2016 – 2020) by Region
Table 08: Global Composable-Disaggregated Infrastructure Market Value (US$ Mn) Analysis (2021 – 2031) by Region
Table 09: North America Composable-Disaggregated Infrastructure Market Value (US$ Mn) Analysis (2016 – 2020) by Component
Table 10: North America Composable-Disaggregated Infrastructure Market Value (US$ Mn) Analysis (2021 – 2031) by Component
Table 11: North America Composable-Disaggregated Infrastructure Market Value (US$ Mn) Analysis (2016 – 2020) by Enterprise Size
Table 12: North America Composable-Disaggregated Infrastructure Market Value (US$ Mn) Analysis (2021 – 2031) by Enterprise Size
Table 13: North America Composable-Disaggregated Infrastructure Market Value (US$ Mn) Analysis (2016 – 2020) by End user
Table 14: North America Composable-Disaggregated Infrastructure Market Value (US$ Mn) Forecast (2021 – 2031) by End user
Table 15: North America Composable-Disaggregated Infrastructure Market Value (US$ Mn) Analysis (2016 – 2020) by Country
Table 16: North America Composable-Disaggregated Infrastructure Market Value (US$ Mn) Forecast (2021 – 2031) by Country
Table 17: Latin America Composable-Disaggregated Infrastructure Market Value (US$ Mn) Analysis (2016 – 2020) by Component
Table 18: Latin America Composable-Disaggregated Infrastructure Market Value (US$ Mn) Analysis (2021 – 2031) by Component
Table 19: Latin America Composable-Disaggregated Infrastructure Market Value (US$ Mn) Analysis (2016 – 2020) by Enterprise Size
Table 20: Latin America Composable-Disaggregated Infrastructure Market Value (US$ Mn) Analysis (2021 – 2031) by Enterprise Size
Table 21: Latin America Composable-Disaggregated Infrastructure Market Value (US$ Mn) Analysis (2016 – 2020) by End user
Table 22: Latin America Composable-Disaggregated Infrastructure Market Value (US$ Mn) Forecast (2021 – 2031) by End user
Table 23: Latin America Composable-Disaggregated Infrastructure Market Value (US$ Mn) Analysis (2016 – 2020) by Country
Table 24: Latin America Composable-Disaggregated Infrastructure Market Value (US$ Mn) Forecast (2021 – 2031) by Country
Table 25: Europe Composable-Disaggregated Infrastructure Market Value (US$ Mn) Analysis (2016 – 2020) by Component
Table 26: Europe Composable-Disaggregated Infrastructure Market Value (US$ Mn) Analysis (2021 – 2031) by Component
Table 27: Europe Composable-Disaggregated Infrastructure Market Value (US$ Mn) Analysis (2016 – 2020) by Enterprise Size
Table 28: Europe Composable-Disaggregated Infrastructure Market Value (US$ Mn) Analysis (2021 – 2031) by Enterprise Size
Table 29: Europe Composable-Disaggregated Infrastructure Market Value (US$ Mn) Analysis (2016 – 2020) by End user
Table 30: Europe Composable-Disaggregated Infrastructure Market Value (US$ Mn) Forecast (2021 – 2031) by End user
Table 31: Europe Composable-Disaggregated Infrastructure Market Value (US$ Mn) Analysis (2016 – 2020) by Country
Table 32: Europe Composable-Disaggregated Infrastructure Market Value (US$ Mn) Forecast (2021 – 2031) by Country
Table 33: East Asia Composable-Disaggregated Infrastructure Market Value (US$ Mn) Analysis (2016 – 2020) by Component
Table 34: East Asia Composable-Disaggregated Infrastructure Market Value (US$ Mn) Analysis (2021 – 2031) by Component
Table 35: East Asia Composable-Disaggregated Infrastructure Market Value (US$ Mn) Analysis (2016 – 2020) by Enterprise Size
Table 36: East Asia Composable-Disaggregated Infrastructure Market Value (US$ Mn) Analysis (2021 – 2031) by Enterprise Size
Table 37: East Asia Composable-Disaggregated Infrastructure Market Value (US$ Mn) Analysis (2016 – 2020) by End user
Table 38: East Asia Composable-Disaggregated Infrastructure Market Value (US$ Mn) Forecast (2021 – 2031) by End user
Table 39: East Asia Composable-Disaggregated Infrastructure Market Value (US$ Mn) Analysis (2016 – 2020) by Country
Table 40: East Asia Composable-Disaggregated Infrastructure Market Value (US$ Mn) Forecast (2021 – 2031) by Country
Table 41: South Asia & Pacific Composable-Disaggregated Infrastructure Market Value (US$ Mn) Analysis (2016 – 2020) by Component
Table 42: South Asia & Pacific Composable-Disaggregated Infrastructure Market Value (US$ Mn) Analysis (2021 – 2031) by Component
Table 43: South Asia & Pacific Composable-Disaggregated Infrastructure Market Value (US$ Mn) Analysis (2016 – 2020) by Enterprise Size
Table 44: South Asia & Pacific Composable-Disaggregated Infrastructure Market Value (US$ Mn) Analysis (2021 – 2031) by Enterprise Size
Table 45: South Asia & Pacific Composable-Disaggregated Infrastructure Market Value (US$ Mn) Analysis (2016 – 2020) by End user
Table 46: South Asia & Pacific Composable-Disaggregated Infrastructure Market Value (US$ Mn) Forecast (2021 – 2031) by End user
Table 47: South Asia & Pacific Composable-Disaggregated Infrastructure Market Value (US$ Mn) Analysis (2016 – 2020) by Country
Table 48: South Asia & Pacific Composable-Disaggregated Infrastructure Market Value (US$ Mn) Forecast (2021 – 2031) by Country
Table 49: Middle East & Africa Composable-Disaggregated Infrastructure Market Value (US$ Mn) Analysis (2016 – 2020) by Component
Table 50: Middle East & Africa Composable-Disaggregated Infrastructure Market Value (US$ Mn) Analysis (2021 – 2031) by Component
Table 51: Middle East & Africa Composable-Disaggregated Infrastructure Market Value (US$ Mn) Analysis (2016 – 2020) by Enterprise Size
Table 52: Middle East & Africa Composable-Disaggregated Infrastructure Market Value (US$ Mn) Analysis (2021 – 2031) by Enterprise Size
Table 53: Middle East & Africa Composable-Disaggregated Infrastructure Market Value (US$ Mn) Analysis (2016 – 2020) by End user
Table 54: Middle East & Africa Composable-Disaggregated Infrastructure Market Value (US$ Mn) Forecast (2021 – 2031) by End user
Table 55: Middle East & Africa Composable-Disaggregated Infrastructure Market Value (US$ Mn) Analysis (2016 – 2020) by Country
Table 56: Middle East & Africa Composable-Disaggregated Infrastructure Market Value (US$ Mn) Forecast (2021 – 2031) by Country
Find your sweet spots for generating winning opportunities in this market.
Talk to AnalystList of Charts
Figure 01: Global Composable/ Disaggregated Infrastructure Market Size and Y-o-Y Growth Rate from 2021 – 2031
Figure 02: Global Composable/ Disaggregated Infrastructure Market Absolute $ Opportunity (US$ Mn), 2020 – 2031
Figure 03: Global Composable/ Disaggregated Infrastructure Market Volume in Units and Y-o-Y Growth Rate from 2020 – 2030
Figure 04: Global Composable-Disaggregated Infrastructure Market Value (US$ Mn), 2016-2020
Figure 05: Global Composable-Disaggregated Infrastructure Market Value (US$ Mn), 2021-2031
Figure 06: Global Composable-Disaggregated Infrastructure Market Value Share Analysis (2021 – 2031) by Component
Figure 07: Global Composable-Disaggregated Infrastructure Market Value Y-o-Y Growth Trend Analysis (2019 – 2031) by Component
Figure 08: Global Composable-Disaggregated Infrastructure Market Attractiveness by Component
Figure 09: Global Composable-Disaggregated Infrastructure Market Value Share Analysis (2021 – 2031) by Enterprise Size
Figure 10: Global Composable-Disaggregated Infrastructure Market Value Y-o-Y Growth Trend Analysis (2019 – 2031) by Enterprise Size
Figure 11: Global Composable-Disaggregated Infrastructure Market Attractiveness by Enterprise Size
Figure 12: Global Composable-Disaggregated Infrastructure Market Value Share Analysis (2021 – 2031) by End user
Figure 13: Global Composable-Disaggregated Infrastructure Market Value Y-o-Y Growth Trend Analysis (2019 – 2031) by End user
Figure 14: Global Composable-Disaggregated Infrastructure Market Attractiveness by End user
Figure 15: Global Composable-Disaggregated Infrastructure Market Value Share Analysis (2021 – 2031) by Region
Figure 16: Global Composable-Disaggregated Infrastructure Market Value Y-o-Y Growth Trend Analysis (2019 – 2031) by Region
Figure 17: Global Composable-Disaggregated Infrastructure Market Attractiveness by Region
Figure 18: North America Composable-Disaggregated Infrastructure Market Absolute $ Opportunity (US$ Mn), 2016 – 2031
Figure 19: Latin America Composable-Disaggregated Infrastructure Market Absolute $ Opportunity (US$ Mn), 2016 – 2031
Figure 20: Europe Composable-Disaggregated Infrastructure Market Absolute $ Opportunity (US$ Mn), 2016 – 2031
Figure 21: East Asia Composable-Disaggregated Infrastructure Market Absolute $ Opportunity (US$ Mn), 2016 – 2031
Figure 22: South Asia and Pacific Composable-Disaggregated Infrastructure Market Absolute $ Opportunity (US$ Mn), 2016 – 2031
Figure 23: Middle East and Africa Composable-Disaggregated Infrastructure Market Absolute $ Opportunity (US$ Mn), 2016 – 2031
Figure 24: North America Composable-Disaggregated Infrastructure Market Value (US$ Mn), 2016-2020
Figure 25: North America Composable-Disaggregated Infrastructure Market Value (US$ Mn), 2021-2031
Figure 26: North America Composable-Disaggregated Infrastructure Market Value Share Analysis (2021 – 2031) by Component
Figure 27: North America Composable-Disaggregated Infrastructure Market Value Y-o-Y Growth Trend Analysis (2019 – 2031) by Component
Figure 28: North America Composable-Disaggregated Infrastructure Market Attractiveness by Component
Figure 29: North America Composable-Disaggregated Infrastructure Market Value Share Analysis (2021 – 2031) by Enterprise Size
Figure 30: North America Composable-Disaggregated Infrastructure Market Value Y-o-Y Growth Trend Analysis (2019 – 2031) by Enterprise Size
Figure 31: North America Composable-Disaggregated Infrastructure Market Attractiveness by Enterprise Size
Figure 32: North America Composable-Disaggregated Infrastructure Market Value Share Analysis (2021 – 2031) by End user
Figure 33: North America Composable-Disaggregated Infrastructure Market Value Y-o-Y Growth Trend Analysis (2019 – 2031) by End user
Figure 34: North America Composable-Disaggregated Infrastructure Market Attractiveness by End user
Figure 35: North America Composable-Disaggregated Infrastructure Market Value Share Analysis (2021 – 2031) by Country
Figure 36: North America Composable-Disaggregated Infrastructure Market Value Y-o-Y Growth Trend Analysis (2019 – 2031) by Country
Figure 37: North America Composable-Disaggregated Infrastructure Market Attractiveness by Country
Figure 38: U.S. Composable-Disaggregated Infrastructure Market Absolute $ Opportunity (US$ Mn), 2016 – 2031
Figure 39: Canada Composable-Disaggregated Infrastructure Market Absolute $ Opportunity (US$ Mn), 2016 – 2031
Figure 40: Latin America Composable-Disaggregated Infrastructure Market Value (US$ Mn), 2016-2020
Figure 41: Latin America Composable-Disaggregated Infrastructure Market Value (US$ Mn), 2021-2031
Figure 42: Latin America Composable-Disaggregated Infrastructure Market Value Share Analysis (2021 – 2031) by Component
Figure 43: Latin America Composable-Disaggregated Infrastructure Market Value Y-o-Y Growth Trend Analysis (2019 – 2031) by Component
Figure 44: Latin America Composable-Disaggregated Infrastructure Market Attractiveness by Component
Figure 45: Latin America Composable-Disaggregated Infrastructure Market Value Share Analysis (2021 – 2031) by Enterprise Size
Figure 46: Latin America Composable-Disaggregated Infrastructure Market Value Y-o-Y Growth Trend Analysis (2019 – 2031) by Enterprise Size
Figure 47: Latin America Composable-Disaggregated Infrastructure Market Attractiveness by Enterprise Size
Figure 48: Latin America Composable-Disaggregated Infrastructure Market Value Share Analysis (2021 – 2031) by End user
Figure 49: Latin America Composable-Disaggregated Infrastructure Market Value Y-o-Y Growth Trend Analysis (2019 – 2031) by End user
Figure 50: Latin America Composable-Disaggregated Infrastructure Market Attractiveness by End user
Figure 51: Latin America Composable-Disaggregated Infrastructure Market Value Share Analysis (2021 – 2031) by Country
Figure 52: Latin America Composable-Disaggregated Infrastructure Market Value Y-o-Y Growth Trend Analysis (2019 – 2031) by Country
Figure 53: Latin America Composable-Disaggregated Infrastructure Market Attractiveness by Country
Figure 54: Brazil Composable-Disaggregated Infrastructure Market Absolute $ Opportunity (US$ Mn), 2016 – 2031
Figure 55: Mexico Composable-Disaggregated Infrastructure Market Absolute $ Opportunity (US$ Mn), 2016 – 2031
Figure 56: Rest of Latin America Composable-Disaggregated Infrastructure Market Absolute $ Opportunity (US$ Mn), 2016 – 2031
Figure 57: Europe Composable-Disaggregated Infrastructure Market Value (US$ Mn), 2016-2020
Figure 58: Europe Composable-Disaggregated Infrastructure Market Value (US$ Mn), 2021-2031
Figure 59: Europe Composable-Disaggregated Infrastructure Market Value Share Analysis (2021 – 2031) by Component
Figure 60: Europe Composable-Disaggregated Infrastructure Market Value Y-o-Y Growth Trend Analysis (2019 – 2031) by Component
Figure 61: Europe Composable-Disaggregated Infrastructure Market Attractiveness by Component
Figure 62: Europe Composable-Disaggregated Infrastructure Market Value Share Analysis (2021 – 2031) by Enterprise Size
Figure 63: Europe Composable-Disaggregated Infrastructure Market Value Y-o-Y Growth Trend Analysis (2019 – 2031) by Enterprise Size
Figure 64: Europe Composable-Disaggregated Infrastructure Market Attractiveness by Enterprise Size
Figure 65: Europe Composable-Disaggregated Infrastructure Market Value Share Analysis (2021 – 2031) by End user
Figure 66: Europe Composable-Disaggregated Infrastructure Market Value Y-o-Y Growth Trend Analysis (2019 – 2031) by End user
Figure 67: Europe Composable-Disaggregated Infrastructure Market Attractiveness by End user
Figure 68: Europe Composable-Disaggregated Infrastructure Market Value Share Analysis (2021 – 2031) by Country
Figure 69: Europe Composable-Disaggregated Infrastructure Market Value Y-o-Y Growth Trend Analysis (2019 – 2031) by Country
Figure 70: Europe Composable-Disaggregated Infrastructure Market Attractiveness by Country
Figure 71: Germany Composable-Disaggregated Infrastructure Market Absolute $ Opportunity (US$ Mn), 2016 – 2031
Figure 72: Italy Composable-Disaggregated Infrastructure Market Absolute $ Opportunity (US$ Mn), 2016 – 2031
Figure 73: U.K. Composable-Disaggregated Infrastructure Market Absolute $ Opportunity (US$ Mn), 2016 – 2031
Figure 74: France Composable-Disaggregated Infrastructure Market Absolute $ Opportunity (US$ Mn), 2016 – 2031
Figure 75: Spain Composable-Disaggregated Infrastructure Market Absolute $ Opportunity (US$ Mn), 2016 – 2031
Figure 76: BENELUX Composable-Disaggregated Infrastructure Market Absolute $ Opportunity (US$ Mn), 2016 – 2031
Figure 77: Russia Composable-Disaggregated Infrastructure Market Absolute $ Opportunity (US$ Mn), 2016 – 2031
Figure 78: Rest of Europe Composable-Disaggregated Infrastructure Market Absolute $ Opportunity (US$ Mn), 2016 – 2031
Figure 79: East Asia Composable-Disaggregated Infrastructure Market Value (US$ Mn), 2016-2020
Figure 80: East Asia Composable-Disaggregated Infrastructure Market Value (US$ Mn), 2021-2031
Figure 81: East Asia Composable-Disaggregated Infrastructure Market Value Share Analysis (2021 – 2031) by Component
Figure 82: East Asia Composable-Disaggregated Infrastructure Market Value Y-o-Y Growth Trend Analysis (2019 – 2031) by Component
Figure 83: East Asia Composable-Disaggregated Infrastructure Market Attractiveness by Component
Figure 84: East Asia Composable-Disaggregated Infrastructure Market Value Share Analysis (2021 – 2031) by Enterprise Size
Figure 85: East Asia Composable-Disaggregated Infrastructure Market Value Y-o-Y Growth Trend Analysis (2019 – 2031) by Enterprise Size
Figure 86: East Asia Composable-Disaggregated Infrastructure Market Attractiveness by Enterprise Size
Figure 87: East Asia Composable-Disaggregated Infrastructure Market Value Share Analysis (2021 – 2031) by End user
Figure 88: East Asia Composable-Disaggregated Infrastructure Market Value Y-o-Y Growth Trend Analysis (2019 – 2031) by End user
Figure 89: East Asia Composable-Disaggregated Infrastructure Market Attractiveness by End user
Figure 90: East Asia Composable-Disaggregated Infrastructure Market Value Share Analysis (2021 – 2031) by Country
Figure 91: East Asia Composable-Disaggregated Infrastructure Market Value Y-o-Y Growth Trend Analysis (2019 – 2031) by Country
Figure 92: East Asia Composable-Disaggregated Infrastructure Market Attractiveness by Country
Figure 93: China Composable-Disaggregated Infrastructure Market Absolute $ Opportunity (US$ Mn), 2016 – 2031
Figure 94: Japan Composable-Disaggregated Infrastructure Market Absolute $ Opportunity (US$ Mn), 2016 – 2031
Figure 95: South Korea Composable-Disaggregated Infrastructure Market Absolute $ Opportunity (US$ Mn), 2016 – 2031
Figure 96: South Asia & Pacific Composable-Disaggregated Infrastructure Market Value (US$ Mn), 2016-2020
Figure 97: South Asia & Pacific Composable-Disaggregated Infrastructure Market Value (US$ Mn), 2021-2031
Figure 98: South Asia & Pacific Composable-Disaggregated Infrastructure Market Value Share Analysis (2021 – 2031) by Component
Figure 99: South Asia & Pacific Composable-Disaggregated Infrastructure Market Value Y-o-Y Growth Trend Analysis (2019 – 2031) by Component
Figure 100: South Asia & Pacific Composable-Disaggregated Infrastructure Market Attractiveness by Component
Figure 101: South Asia & Pacific Composable-Disaggregated Infrastructure Market Value Share Analysis (2021 – 2031) by Enterprise Size
Figure 102: South Asia & Pacific Composable-Disaggregated Infrastructure Market Value Y-o-Y Growth Trend Analysis (2019 – 2031) by Enterprise Size
Figure 103: South Asia & Pacific Composable-Disaggregated Infrastructure Market Attractiveness by Enterprise Size
Figure 104: South Asia & Pacific Composable-Disaggregated Infrastructure Market Value Share Analysis (2021 – 2031) by End user
Figure 105: South Asia & Pacific Composable-Disaggregated Infrastructure Market Value Y-o-Y Growth Trend Analysis (2019 – 2031) by End user
Figure 106: South Asia & Pacific Composable-Disaggregated Infrastructure Market Attractiveness by End user
Figure 107: South Asia & Pacific Composable-Disaggregated Infrastructure Market Value Share Analysis (2021 – 2031) by Country
Figure 108: South Asia & Pacific Composable-Disaggregated Infrastructure Market Value Y-o-Y Growth Trend Analysis (2019 – 2031) by Country
Figure 109: South Asia & Pacific Composable-Disaggregated Infrastructure Market Attractiveness by Country
Figure 110: India Composable-Disaggregated Infrastructure Market Absolute $ Opportunity (US$ Mn), 2016 – 2031
Figure 111: Malaysia Composable-Disaggregated Infrastructure Market Absolute $ Opportunity (US$ Mn), 2016 – 2031
Figure 112: Indonesia Composable-Disaggregated Infrastructure Market Absolute $ Opportunity (US$ Mn), 2016 – 2031
Figure 113: Singapore Composable-Disaggregated Infrastructure Market Absolute $ Opportunity (US$ Mn), 2016 – 2031
Figure 114: Australia & New Zealand Composable-Disaggregated Infrastructure Market Absolute $ Opportunity (US$ Mn), 2016 – 2031
Figure 115: Rest of South Asia & Pacific Composable-Disaggregated Infrastructure Market Absolute $ Opportunity (US$ Mn), 2016 – 2031
Figure 116: Middle East & Africa Composable-Disaggregated Infrastructure Market Value (US$ Mn), 2016-2020
Figure 117: Middle East & Africa Composable-Disaggregated Infrastructure Market Value (US$ Mn), 2021-2031
Figure 118: Middle East & Africa Composable-Disaggregated Infrastructure Market Value Share Analysis (2021 – 2031) by Component
Figure 119: Middle East & Africa Composable-Disaggregated Infrastructure Market Value Y-o-Y Growth Trend Analysis (2019 – 2031) by Component
Figure 120: Middle East & Africa Composable-Disaggregated Infrastructure Market Attractiveness by Component
Figure 121: Middle East & Africa Composable-Disaggregated Infrastructure Market Value Share Analysis (2021 – 2031) by Enterprise Size
Figure 122: Middle East & Africa Composable-Disaggregated Infrastructure Market Value Y-o-Y Growth Trend Analysis (2019 – 2031) by Enterprise Size
Figure 123: Middle East & Africa Composable-Disaggregated Infrastructure Market Attractiveness by Enterprise Size
Figure 124: Middle East & Africa Composable-Disaggregated Infrastructure Market Value Share Analysis (2021 – 2031) by End user
Figure 125: Middle East & Africa Composable-Disaggregated Infrastructure Market Value Y-o-Y Growth Trend Analysis (2019 – 2031) by End user
Figure 126: Middle East & Africa Composable-Disaggregated Infrastructure Market Attractiveness by End user
Figure 127: Middle East & Africa Composable-Disaggregated Infrastructure Market Value Share Analysis (2021 – 2031) by Country
Figure 128: Middle East & Africa Composable-Disaggregated Infrastructure Market Value Y-o-Y Growth Trend Analysis (2019 – 2031) by Country
Figure 129: Middle East & Africa Composable-Disaggregated Infrastructure Market Attractiveness by Country
Figure 130: GCC Countries Composable-Disaggregated Infrastructure Market Absolute $ Opportunity (US$ Mn), 2016 – 2031
Figure 131: Turkey Composable-Disaggregated Infrastructure Market Absolute $ Opportunity (US$ Mn), 2016 – 2031
Figure 132: South Africa Composable-Disaggregated Infrastructure Market Absolute $ Opportunity (US$ Mn), 2016 – 2031
Figure 133: North Africa Composable-Disaggregated Infrastructure Market Absolute $ Opportunity (US$ Mn), 2016 – 2031
Figure 134: Rest of Middle East & Africa Composable-Disaggregated Infrastructure Market Absolute $ Opportunity (US$ Mn), 2016 – 2031
Figure 135: U.S. Composable-Disaggregated Infrastructure Market Incremental Opportunity Share Analysis, 2021 – 2031
Figure 136: Canada Composable-Disaggregated Infrastructure Market Incremental Opportunity Share Analysis, 2021 – 2031
Figure 137: Brazil Composable-Disaggregated Infrastructure Market Incremental Opportunity Share Analysis, 2021 – 2031
Figure 138: Mexico Composable-Disaggregated Infrastructure Market Incremental Opportunity Share Analysis, 2021 – 2031
Figure 139: Germany Composable-Disaggregated Infrastructure Market Incremental Opportunity Share Analysis, 2021 – 2031
Figure 140: Italy Composable-Disaggregated Infrastructure Market Incremental Opportunity Share Analysis, 2021 – 2031
Figure 141: France Composable-Disaggregated Infrastructure Market Incremental Opportunity Share Analysis, 2021 – 2031
Figure 142: U.K. Composable-Disaggregated Infrastructure Market Incremental Opportunity Share Analysis, 2021 – 2031
Figure 143: Spain Composable-Disaggregated Infrastructure Market Incremental Opportunity Share Analysis, 2021 – 2031
Figure 144: BENELUX Composable-Disaggregated Infrastructure Market Incremental Opportunity Share Analysis, 2021 – 2031
Figure 145: Russia Composable-Disaggregated Infrastructure Market Incremental Opportunity Share Analysis, 2021 – 2031
Figure 146: China Composable-Disaggregated Infrastructure Market Incremental Opportunity Share Analysis, 2021 – 2031
Figure 147: Japan Composable-Disaggregated Infrastructure Market Incremental Opportunity Share Analysis, 2021 – 2031
Figure 148: South Korea Composable-Disaggregated Infrastructure Market Incremental Opportunity Share Analysis, 2021 – 2031
Figure 149: India Composable-Disaggregated Infrastructure Market Incremental Opportunity Share Analysis, 2021 – 2031
Figure 150: Malaysia Composable-Disaggregated Infrastructure Market Incremental Opportunity Share Analysis, 2021 – 2031
Figure 151: Indonesia Composable-Disaggregated Infrastructure Market Incremental Opportunity Share Analysis, 2021 – 2031
Figure 152: Singapore Composable-Disaggregated Infrastructure Market Incremental Opportunity Share Analysis, 2021 – 2031
Figure 153: Australia & New Zealand Composable-Disaggregated Infrastructure Market Incremental Opportunity Share Analysis, 2021 – 2031
Figure 154: GCC Countries Composable-Disaggregated Infrastructure Market Incremental Opportunity Share Analysis, 2021 – 2031
Figure 155: Turkey Composable-Disaggregated Infrastructure Market Incremental Opportunity Share Analysis, 2021 – 2031
Figure 156: South Africa Composable-Disaggregated Infrastructure Market Incremental Opportunity Share Analysis, 2021 – 2031
Figure 157: North Africa Composable-Disaggregated Infrastructure Market Incremental Opportunity Share Analysis, 2021 – 2031
Need specific information?
Request CustomizationExplore Technology Insights
View Reports