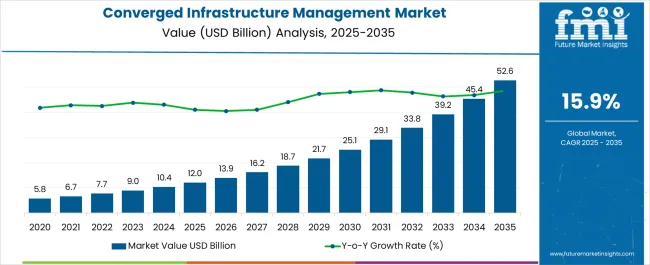
The Converged Infrastructure Management Market is estimated to be valued at USD 12.0 billion in 2025 and is projected to reach USD 52.6 billion by 2035, registering a compound annual growth rate (CAGR) of 15.9% over the forecast period.
| Metric | Value |
|---|---|
| Converged Infrastructure Management Market Estimated Value in (2025 E) | USD 12.0 billion |
| Converged Infrastructure Management Market Forecast Value in (2035 F) | USD 52.6 billion |
| Forecast CAGR (2025 to 2035) | 15.9% |
The converged infrastructure management market is experiencing steady expansion, underpinned by the rising need for simplified IT operations and optimized resource utilization across enterprises. Industry briefings and corporate disclosures have emphasized how converged infrastructure enables organizations to integrate computing, storage, networking, and virtualization into a unified system, reducing complexity and operational costs.
With digital transformation initiatives accelerating globally, enterprises are prioritizing solutions that support workload flexibility, scalability, and streamlined management. The increasing demand for real-time data processing, coupled with the adoption of cloud-native applications, has further strengthened the relevance of converged infrastructure management.
Additionally, security concerns and compliance requirements have driven businesses to invest in centralized infrastructure control systems to safeguard critical data and ensure regulatory adherence. Looking forward, the market is expected to grow as hybrid and multi-cloud strategies expand, with vendors introducing advanced automation, AI-driven analytics, and container management capabilities to enhance system efficiency and support evolving enterprise workloads.
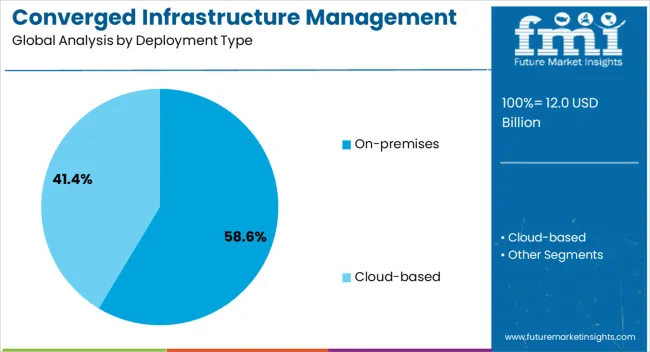
The on-premises segment is projected to account for 58.6% of the converged infrastructure management market revenue in 2025, maintaining its leadership due to enterprise preferences for data control and security. Growth of this segment has been influenced by organizations operating in highly regulated sectors that prioritize infrastructure ownership and compliance over shared environments.
Annual reports from technology providers have highlighted continued demand for on-premises solutions in industries handling sensitive information, where latency reduction and direct control of hardware resources are critical. Additionally, legacy application integration and existing IT investments have encouraged enterprises to retain on-premises infrastructure while modernizing their systems with converged management platforms.
Concerns over cloud dependency, coupled with the need for predictable cost structures, have further reinforced the preference for on-premises deployment. As enterprises balance modernization with control, the on-premises segment is expected to sustain its prominent share of the market.
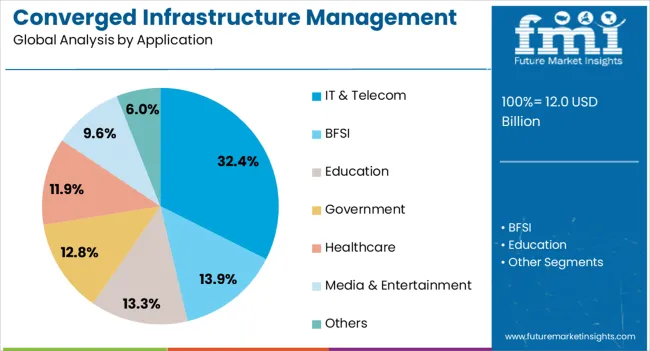
The IT & Telecom segment is projected to contribute 32.4% of the converged infrastructure management market revenue in 2025, positioning itself as the leading application area. Growth of this segment has been supported by the industry’s continuous demand for efficient data handling, rapid service delivery, and scalable infrastructure solutions.
Telecom operators have increasingly relied on converged infrastructure management to support the rollout of 5G networks, edge computing, and bandwidth-intensive applications. IT service providers, on the other hand, have prioritized converged platforms to streamline operations, reduce downtime, and enhance service quality for enterprise clients.
Industry publications have underscored the significance of centralized infrastructure control in enabling rapid provisioning of resources and optimizing workloads in dynamic environments. With the IT & Telecom sector driving large-scale digital transformation projects globally, the demand for converged infrastructure management is expected to remain strong, solidifying the segment’s leadership in application adoption.
The global demand for converged infrastructure management is projected to increase at a CAGR of 22.2% during the forecast period between 2025 and 2035, reaching a total of USD 65,048.6 Million in 2035, according to a report from Future Market Insights (FMI). From 2020 to 2024, sales witnessed significant growth, registering a CAGR of 20.1%.
The primary reasons driving the converged infrastructure management market are the rising need for data security advancements, the aging of traditional data centers, IT operational efficiency, and cost reduction in IT. Cloud-based convergent infrastructure solutions have enhanced the number of options for enterprises, fuelling market development.
The benefits of converged infrastructure include advances in commercial services given by giving streamlined access to the cloud. Factors limiting the growth of the converged infrastructure management market include restricted flexibility, high costs, and a lack of awareness regarding converged infrastructure management solutions.
Digital Transformation in End-User Industries to Drive Demand
Increasing adoption of converged infrastructure solutions for digital transformation in end-user sectors such as e-commerce, retail, IT & Telecom, and others, are expected to benefit the market in the coming time. For instance, in June 2020, HP launched converged infrastructure solutions to assist businesses to implement applications and operate in a complication-free environment.
Players in the market are launching various technologies and solutions to enhance their storage capacities, which is anticipated to drive market growth during the forecast period. In November 2024, VMware launched software-defined HCI Mesh Solutions.
The modern solution provides implementation flexibility to compute and storage disaggregation and boosts native file services capacity. Such factors are anticipated to augment the market size in the forecast period.
High Power Requirements to Hinder Market Augmentation
High power requirements for integrated infrastructure management are projected to stymie market expansion throughout the forecast period. Other obstacles such as high costs, a lack of knowledge, and restricted flexibility are expected to stymie business expansion in the next years.
However, cloud-based converged infrastructure solutions are expected to counter the hampering factors and act as a salient opportunity for the market in the forecast period.
Prevalence of Gigantic Players to Widen Growth Prospects
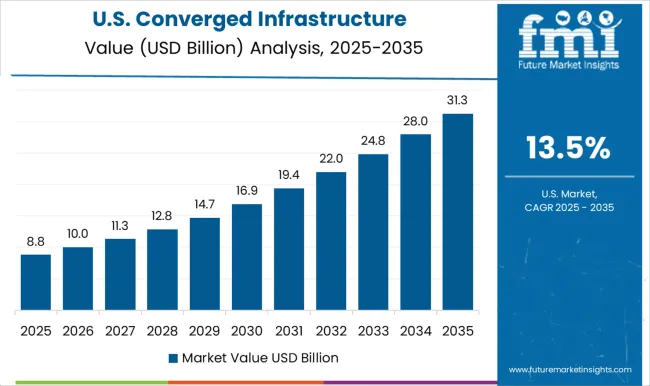
North America is expected to lead the worldwide converged infrastructure management market throughout the forecast period, according to the report. The region is expected to have 40.5% by 2025. The prevalence of gigantic players can be linked to the region's dominance. Dell Technologies, Cisco Systems, IBM Corp, and Microsoft Corp, among others, are expected to play a large part in the industry's development.
Furthermore, activities by companies are expected to increase market size shortly. For example, in April 2024, Microsoft Corporation announced a strategic agreement with Malaysian local organizations and government agencies to invest USD 1 billion in the country to establish a new data center. Because of these reasons, North America is expected to continue its dominant position over the projection period.
Region's Established Companies' Quick Digital Transformation Activities to Boost Market Growth
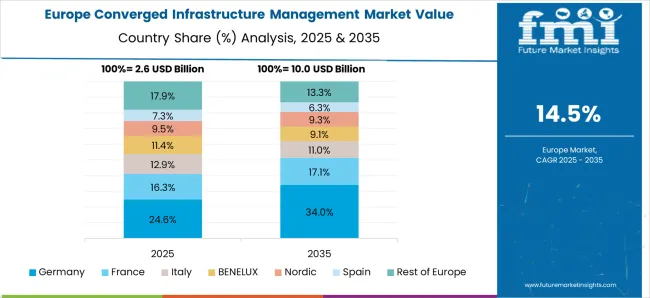
According to the research, Europe will be the second-largest regional market in the worldwide integrated infrastructure management industry. Europe is anticipated to have around 21.7% of the worldwide market share by 2025.
The market's expansion may be ascribed to the region's established companies' quick digital transformation activities. The adoption of beneficial measures by the governments of several European nations is another element driving market expansion.
For example, in November 2024, the European Commission announced the establishment of the Digital Europe Programme, which would receive D2.24 billion in financing to digitally change the region's businesses. As a result, the region is likely to grow dramatically in the next years.
The BSFI Segment to Have the Highest Demand
The BFSI accounted for one-fourth of the market. Hyper-converged systems check all the boxes in the banking, financial services, and insurance (BFSI) business, such as lowering infrastructure management time while also providing infrastructure scalability, availability of important workloads, and disaster recovery (DR).
Furthermore, these solutions address the issue of single-vendor networking infrastructure. As a result, the use of HCI in BFSI is projected to increase in the next years. Thus, by vertical, the BFSI is expected to grow at a 19% CAGR in the converged infrastructure management market in the sales indicator period 2025 to 2035.
Some of the developing companies that might enhance market growth over the projected period are Nutanix, SimpliVity, Scale Computing, Pivot3, Skyport Systems, Coho Data, Sunlight, StarWind Software, Springpath, and Hypergrid.
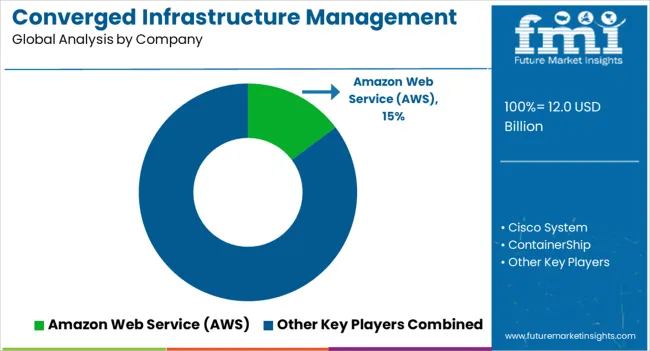
Dell Inc., Egenera Inc., IBM Corporation, Avnet Inc., Amazon Inc., Microsoft Corporation, Hitachi Data Systems Corporation, Hewlett NetApp, Packard Enterprises, Melillo Consulting, Cisco Systems Inc., ACS, CTC Global Pte Ltd., CA Technologies, MTI, and Conres IT Solutions are key players in the global converged infrastructure management market.
Recent Developments In The Converged Management Infrastructure Management Market
| Report Attribute | Details |
|---|---|
| Growth Rate | 15.9% CAGR from 2025 to 2035 |
| Market Value in 2025 | USD 10,201.5 million |
| Market Value in 2035 | USD 44,745 million |
| Base Year for Estimation | 2025 |
| Historical Data | 2020 to 2025 |
| Forecast Period | 2025 to 2035 |
| Quantitative Units | USD million for Value |
| Report Coverage | Revenue Forecast, Volume Forecast, Company Ranking, Competitive Landscape, Growth Factors, Trends, and Pricing Analysis |
| Segments Covered | Type, Verticals, Region |
| Regions Covered | North America; Latin America; Europe; Asia Pacific; Middle East & Africa |
| Key Countries Profiled | USA, Canada, Brazil, Mexico, Germany, UK, France, Spain, Italy, China, Japan, South Korea, Malaysia, Singapore, Australia, New Zealand, GCC, South Africa, Turkey |
| Key Companies Profiled | Dell Inc.; Egenera Inc.; IBM Corporation; Microsoft Corporation; Amazon Web Services; Avnet Inc.; Hitachi Data Systems Corporation; Hewlett NetApp; Packard Enterprises; Melillo Consulting; Cisco Systems Inc.; ACS; CTC Global Pte Ltd.; CA Technologies; MTI; Conres IT Solutions |
| Customization Scope | Available upon Request |
The global converged infrastructure management market is estimated to be valued at USD 12.0 billion in 2025.
The market size for the converged infrastructure management market is projected to reach USD 52.6 billion by 2035.
The converged infrastructure management market is expected to grow at a 15.9% CAGR between 2025 and 2035.
The key product types in converged infrastructure management market are on-premises and cloud-based.
In terms of application, it & telecom segment to command 32.4% share in the converged infrastructure management market in 2025.


Full Research Suite comprises of:
Market outlook & trends analysis
Interviews & case studies
Strategic recommendations
Vendor profiles & capabilities analysis
5-year forecasts
8 regions and 60+ country-level data splits
Market segment data splits
12 months of continuous data updates
DELIVERED AS:
PDF EXCEL ONLINE
Converged Data Platform Market Size and Share Forecast Outlook 2025 to 2035
Converged Infrastructure Market
Hyper-Converged Systems Market Analysis 2025 to 2035 by Component, Enterprise Size, Application, Industry, and Region
5G Infrastructure Market Size and Share Forecast Outlook 2025 to 2035
IT Infrastructure Management Tools Market
Cloud Infrastructure-As-A-Service Market
Cloud Infrastructure Entitlement Management Market Report – Trends & Forecast 2024-2034
Virtual Infrastructure Manager Market Size and Share Forecast Outlook 2025 to 2035
Hosting Infrastructure Services Market Analysis - Size Share and Forecast Outlook 2025 to 2035
Managed Infrastructure Services Market Analysis by Solution, Application, and Region Through 2035
Carrier Infrastructure in Telecom Applications Market - Forecast 2025 to 2035
Cloud IT Infrastructure Hardware Market Size and Share Forecast Outlook 2025 to 2035
Wireless Infrastructure Market Size and Share Forecast Outlook 2025 to 2035
Catenary Infrastructure Inspection Market Insights - Demand & Forecast 2025 to 2035
Critical Infrastructure Monitoring Market
Critical Infrastructure Protection Market
Oil & Gas Infrastructure Market Size and Share Forecast Outlook 2025 to 2035
Automated Infrastructure Management Solution Market Size and Share Forecast Outlook 2025 to 2035
Automated Infrastructure Management (AIM) Solutions Market Size and Share Forecast Outlook 2025 to 2035
Datacenter Infrastructure Services Market Size and Share Forecast Outlook 2025 to 2035

Thank you!
You will receive an email from our Business Development Manager. Please be sure to check your SPAM/JUNK folder too.
Chat With
MaRIA