Reports

- Global Locations -

Headquarters

Future Market Insights, Inc.

Christiana Corporate, 200
Continental Drive, Suite 401,
Newark, Delaware - 19713,
United States

T: +1-845-579-5705

Americas

Future Market Insights, Inc.

616 Corporate Way, Suite 2-9018,
Valley Cottage, NY 10989, United States

T: +1-347-918-3531

MEA

Future Market Insights

1602-6 Jumeirah Bay X2 Tower, Plot No: JLT-PH2-X2A,
Jumeirah Lakes Towers, Dubai,
United Arab Emirates

Europe

Future Market Insights

3rd Floor, 207 Regent Street,
W1B 3HH London
United Kingdom

T: + 44 (0) 20 8123 9659
D: +44 (0) 20 3287 4268

Asia Pacific

Future Market Insights

IndiaLand Global Tech Park, Unit UG-1, Behind Grand HighStreet, Phase 1, Hinjawadi, MH, Pune – 411057, India

Composite Insulator Market Outlook (2023 to 2033)

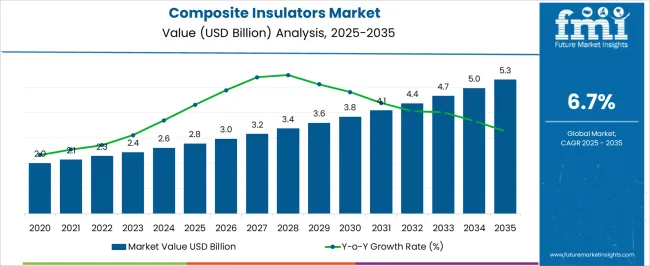
The global composite insulator market size reached US$ 2,975.7 million in 2018. Demand for composite insulators grew by 4.1% in 2022, and is estimated to reach US$ 3,433.3 million in 2023.

Worldwide product demand is projected to exhibit a 6.4% CAGR over the assessment period from 2023 to 2033. It is predicted to result in a market size of US$ 6,413.1 million by the end of 2033.

Demand for composite insulators is on the rise due to their superior performance and durability compared to traditional insulator materials. Composite insulators are made from a combination of materials such as fiberglass reinforced plastic (FRP) and silicone rubber. These offer excellent electrical insulation properties and high mechanical strength.

It makes them highly resistant to cracking, corrosion, and damage from environmental factors such as UV radiation, pollution, and extreme weather conditions. As a result, composite insulators have become increasingly popular in various sectors. A few of these include power transmission & distribution, railways, and telecommunications.

Another factor pushing demand for composite insulators is their lightweight nature. Compared to traditional ceramic or porcelain insulators, composite insulators are significantly lighter. It makes them easier to handle, install, and transport.

Their lightweight characteristic not only reduces labor and installation costs but also enables the use of longer insulator strings. It allows for increased spans between support structures. This is particularly beneficial in applications such as overhead power lines, where longer spans can lead to reduced infrastructure requirements and project costs.

Increasing adoption of renewable energy sources such as wind and solar power, has further contributed to rising demand for composite insulators. These energy sources often require long-distance transmission of electricity from remote areas to population centers.

Composite insulators provide a reliable and efficient solution for transmitting high-voltage power over long distances with minimal power loss. Their resistance to environmental factors such as UV radiation and extreme temperatures ensures their longevity and reliability in renewable energy projects. Hence, it is capable of meeting the growing demand for sustainable energy infrastructure.

Composite insulators also exhibit excellent pollution performance, making them ideal for areas with high levels of airborne contaminants. Traditional insulators made of ceramic or porcelain are prone to pollution flashover. This is a phenomenon where the accumulation of pollutants on the insulator surface can cause an electrical breakdown.

In contrast, composite insulators have hydrophobic properties that repel water and pollutants, reducing the risk of flashovers. This makes them particularly suitable for regions with heavy industrial activity, coastal areas, and areas prone to dust or salt deposition, where pollution flashovers pose a significant challenge.

Attributes Key Insights
Composite Insulator Market Estimated Size (2023E) US$ 3,433.3 million
Projected Market Valuation (2033F) US$ 6,413.1 million
Value-based CAGR (2023 to 2033) 6.4%
Collective Value Share: Top 3 Countries (2023E) 38.7%

Don't pay for what you don't need

Customize your report by selecting specific countries or regions and save 30%!

2018 to 2022 Composite Insulator Sales Outlook Compared to Demand Forecast from 2023 to 2033

The global composite insulator market volume is estimated to reach 24,809 units by 2023. It is projected to expand at a CAGR of 6.1% to reach 44,981 units by the end of 2033. For the forecast period between 2023 and 2033, the market is expected to surge with a significant growth rate of 6.4%.

The market is anticipated to witness rapid smart grid implementation over the forecast period. Smart grid leverages advanced technology to improve efficiency, reliability, and sustainability of power transmission & distribution systems. These advancements are likely to open up new opportunities and drive growth.

Traditional insulator materials such as porcelain and glass have certain limitations in terms of mechanical strength, resistance to environmental factors, and electrical insulation properties. Composite insulators offer superior performance in these areas.

They are designed to withstand higher electrical loads, have better resistance to cracking, and exhibit excellent resistance to UV radiation, pollution, and extreme weather conditions. These enhanced performance characteristics are set to push composite insulator demand as they provide a more reliable and durable solution.

Composite insulators have demonstrated cost advantages over traditional materials. Their lightweight nature makes them easier and more cost-effective to transport, handle, and install.

Their resistance to cracking and damage further reduces maintenance and replacement costs. Long lifespan of composite insulators might also contribute to cost savings over time, as they require fewer replacements compared to traditional insulators.

Advances in material science and manufacturing techniques have played a significant role in driving demand for composite insulators. Development of high-quality FRP materials and improved silicone rubber compounds has resulted in the emergence of novel composite insulators.

New insulators often offer superior performance and durability. These technological advancements have increased the confidence in composite insulators, leading to their widespread adoption in various sectors.

Why Are Composite Insulators Adopted over Traditional Insulators Globally?

Replacement of traditional insulators with composite insulators is a growing trend in the market due to several advantages offered by the latter. These are significantly lighter than traditional porcelain or glass insulators.

It makes them easier to handle, transport, and install, reducing the associated labor and logistics costs. Lightweight nature also decreases the load on support structures, improving system efficiency.

They offer excellent electrical properties such as high insulation resistance, low current leakage, and reliable performance under various environmental conditions. These insulators are designed to withstand high electrical stresses and prevent flashovers or insulation failures. They are further capable of enhancing reliability and safety of power transmission & distribution systems.

They might have a higher initial cost compared to traditional insulators. Their long-term cost-effectiveness becomes apparent due to lower maintenance and replacement expenses.

Extended service life, reduced outage frequency, and improved reliability might result in cost savings over the lifespan of insulators. These advantages have led to growing preference for composite insulators, driving the trend of replacing traditional insulators in the market.

Nikhil Kaitwade
Nikhil Kaitwade

Principal Consultant

Talk to Analyst

Find your sweet spots for generating winning opportunities in this market.

Why is Rising Focus on Grid Modernization and Smart Grids Pushing Growth?

Grid modernization initiatives are set to be driven by renewable energy integration, electrification of transportation, and need for improved grid reliability & efficiency. Smart grids require advanced insulation solutions to ensure proper transmission and distribution of electricity.

Grid modernization aims to improve resilience of the power grid, ensuring its ability to withstand and quickly recover from disturbances or outages. Composite insulators play a vital role in maintaining grid resilience by providing reliable electrical insulation.

They can also help in reducing the risk of insulation failure or flashovers. Their durability and resistance to environmental challenges might contribute to resilience of the grid infrastructure.

Smart grids facilitate integration of distributed energy resources (DERs) such as solar panels, wind turbines, and energy storage systems, into the power grid. DERs require efficient and reliable connections to the grid, often through overhead lines. Composite insulators offer superior electrical insulation and mechanical strength, ensuring safe and efficient integration of DERs into the grid.

Smart grids also promote demand response programs and energy efficiency measures. These help in encouraging consumers to actively participate in managing their energy consumption.

Composite insulators might support these initiatives by providing efficient and reliable electrical insulation, minimizing power losses, and enabling effective energy distribution. Their ability to handle high voltages and challenging environmental conditions is set to push efficiency of smart grid systems.

What Factors are Pushing Increasing Investments in Power Transmission Infrastructure?

Rising population and increasing industrialization are set to give rise to a growing demand for electricity worldwide. To meet this demand, governments and utility companies are investing heavily in expansion and modernization of power transmission infrastructure.

It includes construction of new transmission lines and substations, as well as upgrading existing ones. It plays a crucial role in ensuring reliable and efficient transmission of electricity over long distances.

Composite insulators deliver multiple advantages compared to traditional porcelain or glass insulators. They are lightweight, which makes installation and maintenance easier and more cost-effective.

Composite insulators are also resistant to harsh weather conditions such as high temperatures, UV radiation, and pollution. They have excellent mechanical strength and can withstand heavy loads, reducing the risk of failure and downtime. These benefits would make them an attractive choice for power transmission infrastructure investments.

While initial investment in composite insulators might be higher compared to traditional insulators, they offer long-term cost savings. Their durability and resistance to environmental factors reduce the need for frequent maintenance and replacement.

It can further result in lower operational costs over the lifespan of the power transmission infrastructure. This cost-effectiveness makes an appealing option for utilities and investors when planning & implementing power transmission projects.

Governments and utility companies might hence continue to prioritize expansion and upgrade of power transmission networks. It is projected to bode well for the composite insulator market.

Get the data you need at a Fraction of the cost

Personalize your report by choosing insights you need
and save 40%!

How Maintenance and Repair Complexities Might Hinder Growth?

Maintenance and repair complexities are considerations that can impact the market. While composite insulators are known for their reduced maintenance requirements compared to traditional insulators, certain complexities can arise when maintenance or repairs are needed.

One complexity is related to the modular design of composite insulator units. These insulators are typically composed of multiple sections or components such as a core, housing, and end fittings.

If any part of the insulator becomes damaged or fails, it might require replacement of an entire section or even the entire insulator unit. This can result in more involved repair procedures and potentially higher costs compared to traditional insulators. It can further hamper their sales.

Composite insulators require specialized tools and techniques for maintenance and repair. Technicians need to have appropriate knowledge and skills to handle these insulators correctly. This includes ensuring proper cleaning, inspection, and reassembly of various components to maintain their structural integrity & electrical performance.

Accessing and working on composite insulators, especially in high-voltage applications or challenging installation environments, might require additional safety precautions and equipment. This can increase the complexity and time required for maintenance and repair tasks, further obstructing sales.

Country-wise Insights

Why is Composite Insulator Demand Rising in the United States?

Rising Demand for Renewable Energy in the United States to Push Sales of Composite Insulator Materials

The United States composite insulator market is expected to represent a total incremental $ opportunity of US$ 196.3 million between 2023 and 2033. The country has a significant amount of aging infrastructure, including power transmission and distribution systems. Several of the existing insulators made from traditional materials such as porcelain and glass might be reaching the end of their lifespan or becoming prone to failures.

Composite insulators offer a reliable and durable alternative that can withstand harsh environmental conditions and provide long-term performance. Hence, these properties would make them an attractive choice for infrastructure upgrades and replacements, further propelling sales.

The United States is experiencing a rapid growth in renewable energy generation such as wind and solar power. These renewable energy sources often require the installation of new transmission lines and substations in remote locations.

Composite insulators are well-suited for these applications as they provide excellent electrical insulation and can withstand high voltages associated with renewable energy transmission. Increasing integration of renewable energy sources might fuel demand for composite insulators in the country.

Why Are Composite Insulator Sales Expanding in China?

Need for Cost Optimization in China to Propel Demand for Silicone Composite Insulators

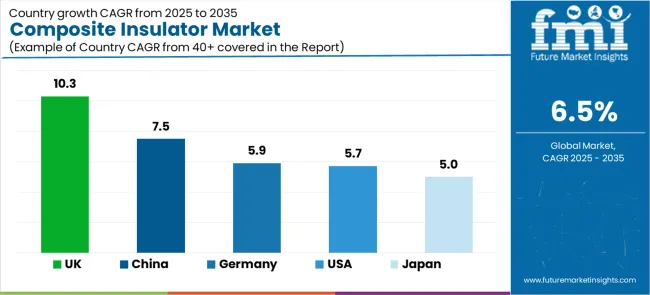
The composite insulator market in China is expected to expand at a CAGR of 6.5% during the forecast period. The country is one of the world's leaders in renewable energy capacity, particularly in wind and solar power.

Integration of renewable energy sources requires expansion of transmission networks and substations, driving demand for composite insulators. These insulators are well-suited for such applications due to their ability to handle high voltages.

They are also capable of withstanding environmental challenges associated with renewable energy generation. Growing renewable energy sector in China is a significant driver for expansion of composite insulator sales.

Composite insulators also offer cost advantages in terms of transportation, installation, and maintenance. Their lightweight nature reduces transportation costs, while easier handling and installation processes save time & labor expenses.

Composite insulators have a longer lifespan and require less maintenance & replacement compared to traditional insulators. These cost efficiencies can make composite insulators an attractive choice for China's infrastructure projects, where cost optimization is a significant consideration.

Category-wise Insights

Which Voltage Segment is Likely to Exhibit Lucrative Growth by 2033?

Demand for Low Voltage Composite Post Insulators to Expand through 2033

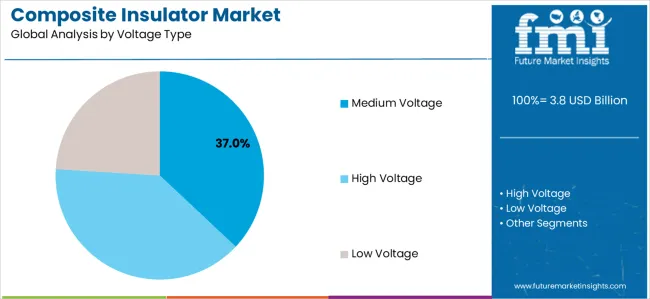
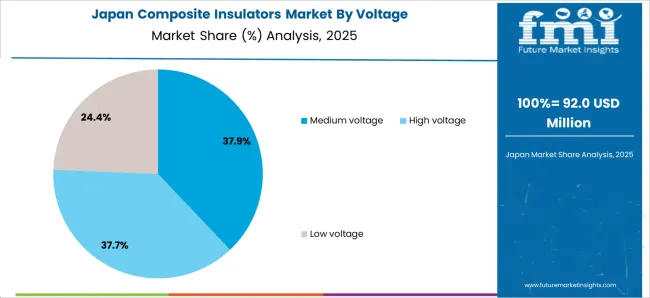
By voltage, the low voltage insulators segment is projected to witness significant growth in the next ten years. Demand for low voltage insulators is driven by growing electrical infrastructure, including residential, commercial, and industrial buildings.

With rising number of construction projects and urbanization, there is a need for reliable and efficient low voltage electrical systems. Low voltage insulators play a crucial role in ensuring safe and uninterrupted flow of electricity in these systems.

Trend toward electrification in various sectors is also contributing to high demand for low voltage insulators. As more devices and equipment become electric-powered, need for low voltage systems and corresponding insulators increases.

It includes applications in sectors such as transportation (electric vehicles), heating & cooling systems, telecommunications, and smart home technologies. Low voltage insulators would enable effective and safe distribution of electricity in these applications.

Which is the Highly Preferred Type of Composite Insulator Worldwide?

Sales of Suspension Composite Hollow Insulators to Rise in the Next Ten Years

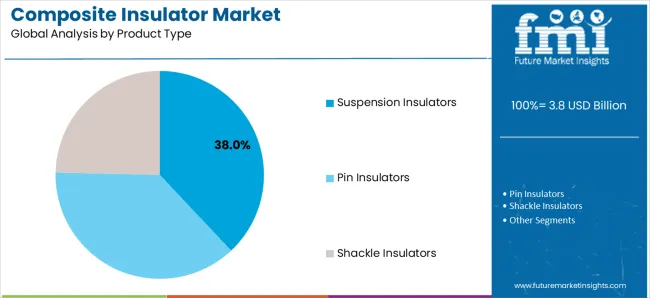
By type, the suspension insulator segment is anticipated to remain at the forefront in the global composite insulator market by 2033. These insulators are primarily used in high-voltage power transmission and distribution systems.

As demand for electricity continues to rise globally, there is a need to expand and upgrade power transmission infrastructure. Suspension insulators are crucial components in these networks.

They provide reliable electrical insulation and mechanical support for overhead power lines. Expanding power transmission and distribution networks are set to drive demand for suspension insulators.

Integration of renewable energy sources such as wind and solar power requires development of new transmission lines & grid connections. Suspension insulators are vital for these applications as they can withstand high electrical voltages and provide reliable insulation. Expansion of renewable energy generation, particularly in remote areas, might contribute to growing demand for suspension insulators.

Competitive Landscape

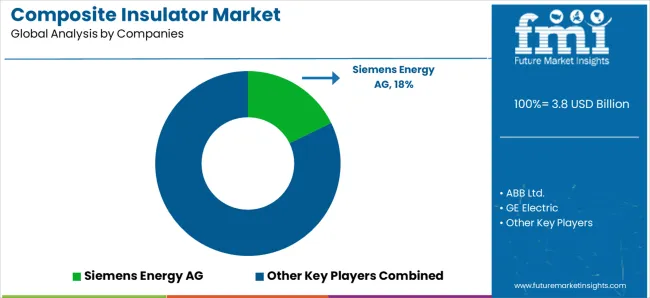
The global composite insulator market is dominated by key participants who held around 65 to 70% of the total share in 2022. These companies are investing in research & development to create innovative materials, manufacturing processes, and product designs.

They aim to improve performance, durability, and cost-effectiveness of composite insulators. By staying at the forefront of technological advancements, they can offer superior products that meet the evolving needs of the market.

Composite insulator manufacturers might also collaborate with research institutions, universities, and industry partners to leverage expertise & resources. These collaborations can involve joint research projects, knowledge sharing, and technology transfers. By working together, they can accelerate innovation, enhance product development, and access new markets or customer segments.

A few start-up companies operating in the composite insulator market are:

  • Dura-Line is a leading manufacturer of composite insulators and a provider of communication & energy infrastructure products. It specializes in high-quality composite insulators for power transmission and distribution applications.
  • Lapp Insulators is a global company that manufactures various types of insulators, including composite insulators. It offers a wide range of composite insulators designed for different voltage levels and environmental conditions.
  • INMAPA Aisladores is a Spanish start-up that focuses on the development and production of composite insulators. It provides a wide range of insulators for different applications, including power transmission, railways, and substations.
  • CTC Global is a company that specializes in the development and manufacturing of composite core conductors for overhead power lines. While its primary focus is conductors, it also delivers composite insulators as part of its product portfolio.

Scope of the Report

Attribute Details
Estimated Market Size (2023) US$ 3,433.3 million
Projected Market Valuation (2033) US$ 6,413.1 million
Value-based CAGR (2023 to 2033) 6.4%
Forecast Period 2023 to 2033
Historical Data Available for 2018 to 2022
Quantitative Analysis Value (US$ million)
Key Countries Covered
  • United States
  • Canada
  • Mexico
  • Brazil
  • Argentina
  • Germany
  • Italy
  • France
  • United Kingdom
  • Spain
  • BENELUX
  • Nordics
  • Poland
  • Hungary
  • Romania
  • Czech Republic
  • India
  • Association of Southeast Asian Nations
  • Australia and New Zealand
  • China
  • Japan
  • South Korea
  • Türkiye
  • Northern Africa
  • South Africa
Key Segments Covered Voltage, Type, Rating, Installation, Application, End Use, and Region
Key Companies Profiled
  • Siemens Energy AG
  • ABB Ltd.
  • GE Electric
  • Lapp Insulators Group
  • Seves Group (sediver)
  • BHEL
  • Maclean Power Systems
  • Olectra Greentech Limited
  • TE Connectivity
  • Hitachi Energy Ltd.
  • Hubbell Incorporated
  • NGK Insulators Ltd.
  • Saravana Global Energy Limited
  • CYG Insulator Co., Ltd.
Report Coverage Market Forecast, Company Share Analysis, Competition Intelligence, Drivers, Restraints, Opportunities, Trends Analysis, Market Dynamics and Challenges, and Strategic Growth Initiatives

Composite Insulator Market Outlook by Category

By Voltage:

  • High Voltage Insulators
  • Medium Voltage Insulators
  • Low Voltage Insulators

By Type:

  • Pin Insulator
  • Suspension Insulator
  • Shackle Insulator
  • Others

By Rating:

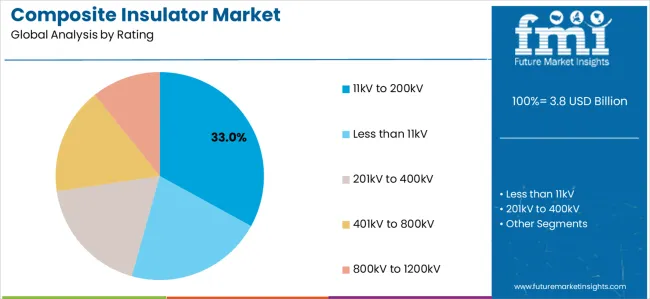
  • Less than 11Kv
  • 11Kv to 200Kv
  • 201Kv to 400Kv
  • 401Kv to 800Kv
  • 800Kv to 1200Kv

By Installation:

  • Distribution
  • Transmission
  • Substation
  • Railways
  • Others

By Application:

  • Cable and Transmission Lines
  • Switchgears
  • Transformers
  • Busbars
  • Others

By End Use:

  • Residential
  • Commercial and Industrial
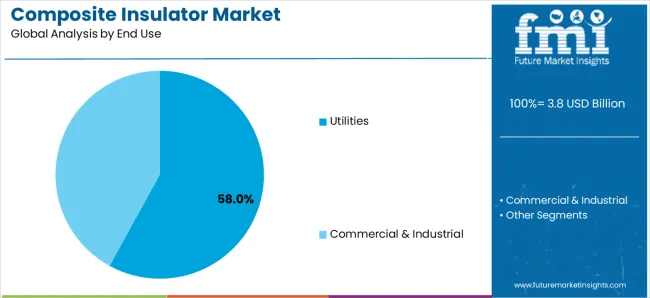
  • Utilities

By Region:

  • North America
  • Latin America
  • Western Global
  • Eastern Global
  • Central Asia
  • Russia and Belarus
  • Balkan and Baltic Countries
  • East Asia
  • South Asia and Pacific
  • Middle East and Africa

Frequently Asked Questions

What was the value of the composite insulator market in 2022?

The global market for composite insulators was valued at US$ 3,259.8 million in 2022.

What is the current size of the composite insulator industry?

The global composite insulator industry is estimated to reach a valuation of US$ 3,433.3 million in 2023.

At what rate is the global composite insulator industry projected to expand?

During 2023 to 2033, the composite insulator industry is anticipated to expand at a CAGR of 6.4%.

By 2033, what will the value of the composite insulator industry be?

The composite insulator industry is expected to reach US$ 6,413.1 million by the end of 2033.

Which voltage segment is expected to lead the composite insulator industry during the forecast period?

The low voltage segment is expected to account for a prominent share in the composite insulator industry by 2033.

Table of Content

1. Executive Summary

    1.1. Global Market Outlook

    1.2. Demand Side Trends

    1.3. Supply Side Trends

    1.4. Technology Roadmap

    1.5. Analysis and Recommendations

2. Market Overview

    2.1. Market Coverage / Taxonomy

    2.2. Market Definition / Scope / Limitations

3. Key Market Trends

    3.1. Key Trends Impacting the Market

    3.2. Product Innovation / Development Trends

4. Key Success Factors

    4.1. Product Adoption / Usage Analysis

    4.2. Product USPs / Features

    4.3. Strategic Promotional Strategies

5. Global Market Demand Analysis 2018 to 2022 and Forecast, 2023 to 2033

    5.1. Historical Market Volume (Units) Analysis, 2018 to 2022

    5.2. Current and Future Market Volume (Units) Projections, 2023 to 2033

    5.3. Y-o-Y Growth Trend Analysis

6. Global Market - Pricing Analysis

    6.1. Regional Pricing Analysis By Rating

    6.2. Global Average Pricing Analysis Benchmark

7. Global Market Demand (in Value or Size in US$ Million) Analysis 2018 to 2022 and Forecast, 2023 to 2033

    7.1. Historical Market Value (US$ Million) Analysis, 2018 to 2022

    7.2. Current and Future Market Value (US$ Million) Projections, 2023 to 2033

        7.2.1. Y-o-Y Growth Trend Analysis

        7.2.2. Absolute $ Opportunity Analysis

8. Market Background

    8.1. Macro-Economic Factors

        8.1.1. Global GDP Growth Outlook

        8.1.2. Urban Population (% of total population)

        8.1.3. Manufacturing, value added by Key Countries

        8.1.4. Primary Energy Consumption by world region

        8.1.5. Primary Energy Consumption by Fuel Type

        8.1.6. Electricity Consumption by Region

        8.1.7. Other Macro-Economic Factors

    8.2. Forecast Factors - Relevance & Impact

        8.2.1. Top Companies Historical Growth

        8.2.2. GDP Growth Forecast

        8.2.3. Economic Factors and infrastructure investments

        8.2.4. Government initiatives and regulations

        8.2.5. Other Forecast Factors

    8.3. Value Chain

        8.3.1. Product Manufacturers

        8.3.2. Distributors

        8.3.3. Avg. Profitability Margins

    8.4. COVID-19 Crisis – Impact Assessment

        8.4.1. Current Statistics

        8.4.2. Short-Mid-Long Term Outlook

        8.4.3. Likely Rebound

    8.5. Market Dynamics

        8.5.1. Drivers

        8.5.2. Restraints

        8.5.3. Opportunity Analysis

9. Global Market Analysis 2018 to 2022 and Forecast 2023 to 2033, By Rating

    9.1. Introduction / Key Findings

    9.2. Historical Market Size (US$ Million) and Volume Analysis By Rating, 2018 to 2022

    9.3. Current and Future Market Size (US$ Million) and Volume Analysis and Forecast By Rating, 2023 to 2033

        9.3.1. Less than 11kV

        9.3.2. 11kV to 200kV

        9.3.3. 201kV to 400kV

        9.3.4. 401kV to 800kV

        9.3.5. 800kV to 1200kV

10. Global Market Analysis 2018 to 2022 and Forecast 2023 to 2033, By Voltage

    10.1. Introduction / Key Findings

    10.2. Historical Market Size (US$ Million) and Volume Analysis By Voltage, 2018 to 2022

    10.3. Current and Future Market Size (US$ Million) and Volume Analysis and Forecast By Voltage, 2023 to 2033

        10.3.1. High Voltage

        10.3.2. Medium Voltage

        10.3.3. Low Voltage

    10.4. Market Attractiveness Analysis By Voltage

11. Global Market Analysis 2018 to 2022 and Forecast 2023 to 2033, By Type

    11.1. Introduction / Key Findings

    11.2. Historical Market Size (US$ Million) and Volume Analysis By Type, 2018 to 2022

    11.3. Current and Future Market Size (US$ Million) and Volume Analysis and Forecast By Type, 2023 to 2033

        11.3.1. Pin Insulators

        11.3.2. Suspension Insulators

        11.3.3. Shackle Insulators

        11.3.4. Others

    11.4. Market Attractiveness Analysis By Type

12. Global Market Analysis 2018 to 2022 and Forecast 2023 to 2033, By Installation

    12.1. Introduction / Key Findings

    12.2. Historical Market Size (US$ Million) and Volume Analysis By Installation,

    12.3. Current and Future Market Size (US$ Million) and Volume Analysis and Forecast By Installation, 2023 to 2033

        12.3.1. Distribution

        12.3.2. Transmission

        12.3.3. Substation

        12.3.4. Railways

        12.3.5. Others

    12.4. Market Attractiveness Analysis By Installation

13. Global Market Analysis 2018 to 2022 and Forecast 2023 to 2033, By Application

    13.1. Introduction / Key Findings

    13.2. Historical Market Size (US$ Million) and Volume Analysis By Application, 2018 to 2022

    13.3. Current and Future Market Size (US$ Million) and Volume Analysis and Forecast By Application, 2023 to 2033

        13.3.1. Cables & Transmission Lines

        13.3.2. Switchgears

        13.3.3. Transformers

        13.3.4. Busbars

        13.3.5. Others

    13.4. Market Attractiveness Analysis By Application

14. Global Market Analysis 2018 to 2022 and Forecast 2023 to 2033, End Use

    14.1. Introduction / Key Findings

    14.2. Historical Market Size (US$ Million) and Volume Analysis End Use, 2018 to 2022

    14.3. Current and Future Market Size (US$ Million) and Volume Analysis and Forecast End Use, 2023 to 2033

        14.3.1. Residential

        14.3.2. Commercial & Industrial

        14.3.3. Utilities

    14.4. Market Attractiveness Analysis End Use

15. Global Market Analysis 2018 to 2022 and Forecast 2023 to 2033, by Region

    15.1. Introduction

    15.2. Historical Market Size (US$ Million) and Volume Analysis By Region, 2018 to 2022

    15.3. Current Market Size (US$ Million) and Volume Analysis and Forecast By Region, 2023 to 2033

        15.3.1. North America

        15.3.2. Latin America

        15.3.3. Western Europe

        15.3.4. Eastern Europe

        15.3.5. Central Asia

        15.3.6. Russia & Belarus

        15.3.7. Balkan & Baltic Countries

        15.3.8. Middle East and Africa

        15.3.9. East Asia

        15.3.10. South Asia and Pacific

    15.4. Market Attractiveness Analysis By Region

16. North America Market Analysis 2018 to 2022 and Forecast 2023 to 2033

    16.1. Introduction

    16.2. Pricing Analysis

    16.3. Historical Market Size (US$ Million) and Volume Trend Analysis By Market Taxonomy, 2018 to 2022

    16.4. Market Size (US$ Million) and Volume Forecast By Market Taxonomy, 2023 to 2033

        16.4.1. By Country

            16.4.1.1. United States

            16.4.1.2. Canada

        16.4.2. By Rating

        16.4.3. By Voltage

        16.4.4. By Type

        16.4.5. By Installation

        16.4.6. By Application

        16.4.7. By End Use

    16.5. Market Attractiveness Analysis

        16.5.1. By Country

        16.5.2. By Rating

        16.5.3. By Voltage

        16.5.4. By Type

        16.5.5. By Installation

        16.5.6. By Application

        16.5.7. By End Use

    16.6. Market Trends

    16.7. Key Market Participants - Intensity Mapping

    16.8. Drivers and Restraints - Impact Analysis

17. Latin America Market Analysis 2018 to 2022 and Forecast 2023 to 2033

    17.1. Introduction

    17.2. Pricing Analysis

    17.3. Historical Market Size (US$ Million) and Volume Trend Analysis By Market Taxonomy, 2018 to 2022

    17.4. Market Size (US$ Million) and Volume Forecast By Market Taxonomy, 2023 to 2033

        17.4.1. By Country

            17.4.1.1. Brazil

            17.4.1.2. Mexico

            17.4.1.3. Argentina

            17.4.1.4. Rest of Latin America

        17.4.2. By Rating

        17.4.3. By Voltage

        17.4.4. By Type

        17.4.5. By Installation

        17.4.6. By Application

        17.4.7. By End Use

    17.5. Market Attractiveness Analysis

        17.5.1. By Country

        17.5.2. By Rating

        17.5.3. By Voltage

        17.5.4. By Type

        17.5.5. By Installation

        17.5.6. By Application

        17.5.7. By End Use

    17.6. Market Trends

    17.7. Key Market Participants - Intensity Mapping

    17.8. Drivers and Restraints - Impact Analysis

18. Western Europe Market Analysis 2018 to 2022 and Forecast 2023 to 2033

    18.1. Introduction

    18.2. Pricing Analysis

    18.3. Historical Market Size (US$ Million) and Volume Trend Analysis By Market Taxonomy, 2018 to 2022

    18.4. Market Size (US$ Million) and Volume Forecast By Market Taxonomy, 2023 to 2033

        18.4.1. By Country

            18.4.1.1. Germany

            18.4.1.2. Italy

            18.4.1.3. France

            18.4.1.4. United Kingdom

            18.4.1.5. Spain

            18.4.1.6. BENELUX

            18.4.1.7. NORDICS

            18.4.1.8. Rest of Western Europe

        18.4.2. By Rating

        18.4.3. By Voltage

        18.4.4. By Type

        18.4.5. By Installation

        18.4.6. By Application

        18.4.7. By End Use

    18.5. Market Attractiveness Analysis

        18.5.1. By Country

        18.5.2. By Rating

        18.5.3. By Voltage

        18.5.4. By Type

        18.5.5. By Installation

        18.5.6. By Application

        18.5.7. By End Use

    18.6. Market Trends

    18.7. Key Market Participants - Intensity Mapping

    18.8. Drivers and Restraints - Impact Analysis

19. Eastern Europe Market Analysis 2018 to 2022 and Forecast 2023 to 2033

    19.1. Introduction

    19.2. Pricing Analysis

    19.3. Historical Market Size (US$ Million) and Volume Trend Analysis By Market Taxonomy, 2018 to 2022

    19.4. Market Size (US$ Million) and Volume Forecast By Market Taxonomy, 2023 to 2033

        19.4.1. By Country

            19.4.1.1. Poland

            19.4.1.2. Hungary

            19.4.1.3. Romania

            19.4.1.4. Czech Republic

            19.4.1.5. Rest of Eastern Europe

        19.4.2. By Rating

        19.4.3. By Voltage

        19.4.4. By Type

        19.4.5. By Installation

        19.4.6. By Application

        19.4.7. By End Use

    19.5. Market Attractiveness Analysis

        19.5.1. By Country

        19.5.2. By Rating

        19.5.3. By Voltage

        19.5.4. By Type

        19.5.5. By Installation

        19.5.6. By Application

        19.5.7. By End Use

    19.6. Market Trends

    19.7. Key Market Participants - Intensity Mapping

    19.8. Drivers and Restraints - Impact Analysis

20. Central Asia Market Analysis 2018 to 2022 and Forecast 2023 to 2033

    20.1. Introduction

    20.2. Pricing Analysis

    20.3. Historical Market Size (US$ Million) and Volume Trend Analysis By Market Taxonomy, 2018 to 2022

    20.4. Market Size (US$ Million) and Volume Forecast By Market Taxonomy, 2023 to 2033

        20.4.1. By Rating

        20.4.2. By Voltage

        20.4.3. By Type

        20.4.4. By Installation

        20.4.5. By Application

        20.4.6. By End Use

    20.5. Market Attractiveness Analysis

        20.5.1. By Rating

        20.5.2. By Voltage

        20.5.3. By Type

        20.5.4. By Installation

        20.5.5. By Application

        20.5.6. By End Use

    20.6. Market Trends

    20.7. Key Market Participants - Intensity Mapping

    20.8. Drivers and Restraints - Impact Analysis

21. Russia & Belarus Market Analysis 2018 to 2022 and Forecast 2023 to 2033

    21.1. Introduction

    21.2. Pricing Analysis

    21.3. Historical Market Size (US$ Million) and Volume Trend Analysis By Market Taxonomy, 2018 to 2022

    21.4. Market Size (US$ Million) and Volume Forecast By Market Taxonomy, 2023 to 2033

        21.4.1. By Rating

        21.4.2. By Voltage

        21.4.3. By Type

        21.4.4. By Installation

        21.4.5. By Application

        21.4.6. By End Use

    21.5. Market Attractiveness Analysis

        21.5.1. By Rating

        21.5.2. By Voltage

        21.5.3. By Type

        21.5.4. By Installation

        21.5.5. By Application

        21.5.6. By End Use

    21.6. Market Trends

    21.7. Key Market Participants - Intensity Mapping

    21.8. Drivers and Restraints - Impact Analysis

22. Balkan & Baltic Countries Market Analysis 2018 to 2022 and Forecast 2023 to 2033

    22.1. Introduction

    22.2. Pricing Analysis

    22.3. Historical Market Size (US$ Million) and Volume Trend Analysis By Market Taxonomy, 2018 to 2022

    22.4. Market Size (US$ Million) and Volume Forecast By Market Taxonomy, 2023 to 2033

        22.4.1. By Rating

        22.4.2. By Voltage

        22.4.3. By Type

        22.4.4. By Installation

        22.4.5. By Application

        22.4.6. By End Use

        22.4.7. Market Attractiveness Analysis

        22.4.8. By Rating

        22.4.9. By Voltage

        22.4.10. By Type

        22.4.11. By Installation

        22.4.12. By Application

        22.4.13. By End Use

    22.5. Market Trends

    22.6. Key Market Participants - Intensity Mapping

    22.7. Drivers and Restraints - Impact Analysis

23. South Asia and Pacific Market Analysis 2018 to 2022 and Forecast 2023 to 2033

    23.1. Introduction

    23.2. Pricing Analysis

    23.3. Historical Market Size (US$ Million) and Volume Trend Analysis By Market Taxonomy, 2018 to 2022

    23.4. Market Size (US$ Million) and Volume Forecast By Market Taxonomy, 2023 to 2033

        23.4.1. By Country

            23.4.1.1. India

            23.4.1.2. Association of South East Asian Nations

            23.4.1.3. Australia & New Zealand

            23.4.1.4. Rest of South Asia & Pacific

        23.4.2. By Rating

        23.4.3. By Voltage

        23.4.4. By Type

        23.4.5. By Installation

        23.4.6. By Application

        23.4.7. By End Use

    23.5. Market Attractiveness Analysis

        23.5.1. By Country

        23.5.2. By Rating

        23.5.3. By Voltage

        23.5.4. By Type

        23.5.5. By Installation

        23.5.6. By Application

        23.5.7. By End Use

    23.6. Market Trends

    23.7. Key Market Participants - Intensity Mapping

    23.8. Drivers and Restraints - Impact Analysis

24. East Asia Market Analysis 2018 to 2022 and Forecast 2023 to 2033

    24.1. Introduction

    24.2. Pricing Analysis

    24.3. Historical Market Size (US$ Million) and Volume Trend Analysis By Market Taxonomy, 2018 to 2022

    24.4. Market Size (US$ Million) and Volume Forecast By Market Taxonomy, 2023 to 2033

        24.4.1. By Country

            24.4.1.1. China

            24.4.1.2. Japan

            24.4.1.3. South Korea

        24.4.2. By Rating

        24.4.3. By Voltage

        24.4.4. By Type

        24.4.5. By Installation

        24.4.6. By Application

        24.4.7. By End Use

    24.5. Market Attractiveness Analysis

        24.5.1. By Country

        24.5.2. By Rating

        24.5.3. By Voltage

        24.5.4. By Type

        24.5.5. By Installation

        24.5.6. By Application

        24.5.7. By End Use

    24.6. Market Trends

    24.7. Key Market Participants - Intensity Mapping

    24.8. Drivers and Restraints - Impact Analysis

25. Middle East and Africa Market Analysis 2018 to 2022 and Forecast 2023 to 2033

    25.1. Introduction

    25.2. Pricing Analysis

    25.3. Historical Market Size (US$ Million) and Volume Trend Analysis By Market Taxonomy, 2018 to 2022

    25.4. Market Size (US$ Million) and Volume Forecast By Market Taxonomy, 2023 to 2033

        25.4.1. By Country

            25.4.1.1. Kingdom of Saudi Arabia

            25.4.1.2. United Arab Emirates

            25.4.1.3. Türkiye

            25.4.1.4. Northern Africa

            25.4.1.5. South Africa

            25.4.1.6. Israel

            25.4.1.7. Rest of Middle East and Africa

        25.4.2. By Rating

        25.4.3. By Voltage

        25.4.4. By Type

        25.4.5. By Installation

        25.4.6. By Application

        25.4.7. By End Use

    25.5. Market Attractiveness Analysis

        25.5.1. By Country

        25.5.2. By Rating

        25.5.3. By Voltage

        25.5.4. By Type

        25.5.5. By Installation

        25.5.6. By Application

        25.5.7. By End Use

        25.5.8. By End User

    25.6. Market Trends

    25.7. Key Market Participants - Intensity Mapping

    25.8. Drivers and Restraints - Impact Analysis

26. Country wise Market Analysis

    26.1. Introduction

        26.1.1. Market Value Proportion Analysis, By Key Countries

        26.1.2. Global Vs. Country Growth Comparison

    26.2. United States Market Analysis

        26.2.1. By Rating

        26.2.2. By Voltage

        26.2.3. By Type

        26.2.4. By Installation

        26.2.5. By Application

        26.2.6. By End Use

    26.3. Canada Market Analysis

        26.3.1. By Rating

        26.3.2. By Voltage

        26.3.3. By Type

        26.3.4. By Installation

        26.3.5. By Application

        26.3.6. By End Use

    26.4. Mexico Market Analysis

        26.4.1. By Rating

        26.4.2. By Voltage

        26.4.3. By Type

        26.4.4. By Installation

        26.4.5. By Application

        26.4.6. By End Use

    26.5. Brazil Market Analysis

        26.5.1. Rating

        26.5.2. By Voltage

        26.5.3. By Type

        26.5.4. By Installation

        26.5.5. By Application

        26.5.6. By End Use

    26.6. Argentina Market Analysis

        26.6.1. By Rating

        26.6.2. By Voltage

        26.6.3. By Type

        26.6.4. By Installation

        26.6.5. By Application

        26.6.6. By End Use

    26.7. Germany Market Analysis

        26.7.1. By Rating

        26.7.2. By Voltage

        26.7.3. By Type

        26.7.4. By Installation

        26.7.5. By Application

        26.7.6. By End Use

    26.8. Italy Market Analysis

        26.8.1. By Rating

        26.8.2. By Voltage

        26.8.3. By Type

        26.8.4. By Installation

        26.8.5. By Application

        26.8.6. By End Use

    26.9. France Market Analysis

        26.9.1. By Rating

        26.9.2. By Voltage

        26.9.3. By Type

        26.9.4. By Installation

        26.9.5. By Application

        26.9.6. By End Use

    26.10. United Kingdom Market Analysis

        26.10.1. By Rating

        26.10.2. By Voltage

        26.10.3. By Type

        26.10.4. By Installation

        26.10.5. By Application

        26.10.6. By End Use

    26.11. Spain Market Analysis

        26.11.1. By Rating

        26.11.2. By Voltage

        26.11.3. By Type

        26.11.4. By Installation

        26.11.5. By Application

        26.11.6. By End Use

    26.12. NORDICS Market Analysis

        26.12.1. By Rating

        26.12.2. By Voltage

        26.12.3. By Type

        26.12.4. By Installation

        26.12.5. By Application

        26.12.6. By End Use

    26.13. Poland Market Analysis

        26.13.1. By Rating

        26.13.2. By Voltage

        26.13.3. By Type

        26.13.4. By Installation

        26.13.5. By Application

        26.13.6. By End Use

    26.14. Hungary Market Analysis

        26.14.1. By Rating

        26.14.2. By Voltage

        26.14.3. By Type

        26.14.4. By Installation

        26.14.5. By Application

        26.14.6. By End Use

    26.15. Romania Market Analysis

        26.15.1. By Rating

        26.15.2. By Voltage

        26.15.3. By Type

        26.15.4. By Installation

        26.15.5. By Application

        26.15.6. By End Use

    26.16. Czech Republic Market Analysis

        26.16.1. By Rating

        26.16.2. By Voltage

        26.16.3. By Type

        26.16.4. By Installation

        26.16.5. By Application

        26.16.6. By End Use

    26.17. China Market Analysis

        26.17.1. By Rating

        26.17.2. By Voltage

        26.17.3. By Type

        26.17.4. By Installation

        26.17.5. By Application

        26.17.6. By End Use

    26.18. Japan Market Analysis

        26.18.1. Rating

        26.18.2. By Voltage

        26.18.3. By Type

        26.18.4. By Installation

        26.18.5. By Application

        26.18.6. By End Use

    26.19. South Korea Market Analysis

        26.19.1. By Rating

        26.19.2. By Voltage

        26.19.3. By Type

        26.19.4. By Installation

        26.19.5. By Application

        26.19.6. By End Use

    26.20. India Market Analysis

        26.20.1. By Rating

        26.20.2. By Voltage

        26.20.3. By Type

        26.20.4. By Installation

        26.20.5. By Application

        26.20.6. By End Use

    26.21. Association of South East Asian Nations Market Analysis

        26.21.1. By Rating

        26.21.2. By Voltage

        26.21.3. By Type

        26.21.4. By Installation

        26.21.5. By Application

        26.21.6. By End Use

    26.22. Australia and New Zealand Market Analysis

        26.22.1. By Rating

        26.22.2. By Voltage

        26.22.3. By Type

        26.22.4. By Installation

        26.22.5. By Application

        26.22.6. By End Use

    26.23. Kingdom of Saudi Arabia Market Analysis

        26.23.1. By Rating

        26.23.2. By Voltage

        26.23.3. By Type

        26.23.4. By Installation

        26.23.5. By Application

        26.23.6. By End Use

    26.24. United Arab Emirates Market Analysis

        26.24.1. By Rating

        26.24.2. By Voltage

        26.24.3. By Type

        26.24.4. By Installation

        26.24.5. By Application

        26.24.6. By End Use

    26.25. Türkiye Market Analysis

        26.25.1. By Rating

        26.25.2. By Voltage

        26.25.3. By Type

        26.25.4. By Installation

        26.25.5. By Application

        26.25.6. By End Use

    26.26. South Africa Market Analysis

        26.26.1. By Rating

        26.26.2. By Voltage

        26.26.3. By Type

        26.26.4. By Installation

        26.26.5. By Application

        26.26.6. By End Use

    26.27. Israel Market Analysis

        26.27.1. By Rating

        26.27.2. By Voltage

        26.27.3. By Type

        26.27.4. By Installation

        26.27.5. By Application

        26.27.6. By End Use

27. Market Structure Analysis

    27.1. Market Analysis by Tier of Companies (Composite Insulators)

    27.2. Market Positioning Analysis

    27.3. Market Share Analysis of Top Players

    27.4. Market Presence Analysis

        27.4.1. By Regional Footprint of Players

        27.4.2. Key Players Product portfolio

28. Competition Analysis

    28.1. Competition Dashboard

    28.2. Competition Benchmarking

    28.3. Competition Deep Dive

        28.3.1. Siemens Energy AG

            28.3.1.1. Overview

            28.3.1.2. Product Portfolio

            28.3.1.3. Profitability by Market Segments (Product/Channel/Region)

            28.3.1.4. Sales Footprint

            28.3.1.5. Strategy Overview

        28.3.2. ABB Ltd.

            28.3.2.1. Overview

            28.3.2.2. Product Portfolio

            28.3.2.3. Profitability by Market Segments (Product/Channel/Region)

            28.3.2.4. Sales Footprint

            28.3.2.5. Strategy Overview

        28.3.3. GE Electric

            28.3.3.1. Overview

            28.3.3.2. Product Portfolio

            28.3.3.3. Profitability by Market Segments (Product/Channel/Region)

            28.3.3.4. Sales Footprint

        28.3.4. Strategy Overview

        28.3.5. Lapp Insulators Group

            28.3.5.1. Overview

            28.3.5.2. Product Portfolio

            28.3.5.3. Profitability by Market Segments (Product/Channel/Region)

            28.3.5.4. Sales Footprint

            28.3.5.5. Strategy Overview

        28.3.6. Seves Group (sediver)

            28.3.6.1. Overview

            28.3.6.2. Product Portfolio

            28.3.6.3. Profitability by Market Segments (Product/Channel/Region)

            28.3.6.4. Sales Footprint

            28.3.6.5. Strategy Overview

        28.3.7. BHEL

            28.3.7.1. Overview

            28.3.7.2. Product Portfolio

            28.3.7.3. Profitability by Market Segments (Product/Channel/Region)

            28.3.7.4. Sales Footprint

            28.3.7.5. Strategy Overview

        28.3.8. Maclean Power Systems

            28.3.8.1. Overview

            28.3.8.2. Product Portfolio

            28.3.8.3. Profitability by Market Segments (Product/Channel/Region)

            28.3.8.4. Sales Footprint

            28.3.8.5. Strategy Overview

        28.3.9. Olectra Greentech Limited

            28.3.9.1. Overview

            28.3.9.2. Product Portfolio

            28.3.9.3. Profitability by Market Segments (Product/Channel/Region)

            28.3.9.4. Sales Footprint

            28.3.9.5. Strategy Overview

        28.3.10. TE Connectivity

            28.3.10.1. Overview

            28.3.10.2. Product Portfolio

            28.3.10.3. Profitability by Market Segments (Product/Channel/Region)

            28.3.10.4. Sales Footprint

            28.3.10.5. Strategy Overview

        28.3.11. Hitachi Energy Ltd

            28.3.11.1. Overview

            28.3.11.2. Product Portfolio

            28.3.11.3. Profitability by Market Segments (Product/Channel/Region)

            28.3.11.4. Sales Footprint

            28.3.11.5. Strategy Overview

        28.3.12. Hubbell Incorporated

            28.3.12.1. Overview

            28.3.12.2. Product Portfolio

            28.3.12.3. Profitability by Market Segments (Product/Channel/Region)

            28.3.12.4. Sales Footprint

            28.3.12.5. Strategy Overview

        28.3.13. NGK Insulators Ltd.

            28.3.13.1. Overview

            28.3.13.2. Product Portfolio

            28.3.13.3. Profitability by Market Segments (Product/Channel/Region)

            28.3.13.4. Sales Footprint

            28.3.13.5. Strategy Overview

        28.3.14. Saravana Global Energy Limited

            28.3.14.1. Overview

            28.3.14.2. Product Portfolio

            28.3.14.3. Profitability by Market Segments (Product/Channel/Region)

            28.3.14.4. Sales Footprint

            28.3.14.5. Strategy Overview

        28.3.15. CYG Insulator Co., Ltd.

            28.3.15.1. Overview

            28.3.15.2. Product Portfolio

            28.3.15.3. Profitability by Market Segments (Product/Channel/Region)

            28.3.15.4. Sales Footprint

            28.3.15.5. Strategy Overview

29. Primary Insights

30. Assumptions and Acronyms Used

31. Research Methodology

Don't pay for what you don't need

Customize your report by selecting specific countries or regions and save 30%!

List of Tables

Table 01: Global Market Size (US$ Million) and Volume (Units) Analysis and Forecast By Voltage, 2018 to 2022

Table 02: Global Market Size (US$ Million) and Volume (Units) Analysis and Forecast By Voltage, 2023 to 2033

Table 03: Global Market Size (US$ Million) and Volume (Units) Analysis and Forecast By Type, 2018 to 2022

Table 04: Global Market Size (US$ Million) and Volume (Units) Analysis and Forecast By Type, 2023 to 2033

Table 05: Global Market Size (US$ Million) and Volume (Units) Analysis and Forecast By Rating, 2018 to 2022

Table 06: Global Market Size (US$ Million) and Volume (Units) Analysis and Forecast By Rating, 2023 to 2033

Table 07: Global Market Size (US$ Million) and Volume (Units) Analysis and Forecast By Installation, 2018 to 2022

Table 08: Global Market Size (US$ Million) and Volume (Units) Analysis and Forecast By Installation, 2023 to 2033

Table 09: Global Market Size (US$ Million) and Volume (Units) Analysis and Forecast By Application, 2018 to 2022

Table 10: North America Market Size (US$ Million) and Volume (Units) Analysis and Forecast By Application, 2023 to 2033

Table 11: Global Market Size (US$ Million) and Volume (Units) Analysis and Forecast By End Use, 2018 to 2033

Table 12: Global Market Size (US$ Million) and Volume (Units) Analysis and Forecast By End Use, 2018 to 2033

Table 13: Global Market Size Volume (Units) Analysis and Forecast By Region, 2018 to 2022

Table 14: Global Market Size(US$ Million) Analysis and Forecast By Region, 2023 to 2033

Table 15: North America Market Size (US$ Million) and Volume (Units) Analysis and Forecast By Country, 2018 to 2033

Table 16: North America Market Size (US$ Million) and Volume (Units) Analysis and Forecast By Voltage, 2018 to 2022

Table 17: North America Market Size (US$ Million) and Volume (Units) Analysis and Forecast By Voltage, 2023 to 2033

Table 18: North America Market Size (US$ Million) and Volume (Units) Analysis and Forecast By Type, 2018 to 2022

Table 19: North America Market Size (US$ Million) and Volume (Units) Analysis and Forecast By Type, 2023 to 2033

Table 20: North America Market Size (US$ Million) and Volume (Units) Analysis and Forecast By Rating, 2018 to 2022

Table 21: North America Market Size (US$ Million) and Volume (Units) Analysis and Forecast By Rating, 2023 to 2033

Table 22: North America Market Size (US$ Million) and Volume (Units) Analysis and Forecast By Installation, 2018 to 2022

Table 23: North America Market Size (US$ Million) and Volume (Units) Analysis and Forecast By Installation, 2023 to 2033

Table 24: North America Market Size (US$ Million) and Volume (Units) Analysis and Forecast By Application, 2018 to 2022

Table 25: North America Market Size (US$ Million) and Volume (Units) Analysis and Forecast By Application, 2023 to 2033

Table 26: North America Market Size (US$ Million) and Volume (Units) Analysis and Forecast By End Use, 2018 to 2033

Table 27: North America Market Size (US$ Million) and Volume (Units) Analysis and Forecast By End Use, 2018 to 2033

Table 28: Latin America Market Value (US$ Million) and Volume (Units) Historical Data By Country 2018 to 2022

Table 29: Latin America Market Value (US$ Million) and Volume (Units) Forecast By Country 2023 to 2033

Table 30: Latin America Market Size (US$ Million) and Volume (Units) Analysis and Forecast By Voltage, 2018 to 2022

Table 31: Latin America Market Size (US$ Million) and Volume (Units) Analysis and Forecast By Voltage, 2023 to 2033

Table 32: Latin America Market Size (US$ Million) and Volume (Units) Analysis and Forecast By Type, 2018 to 2022

Table 33: Latin America Market Size (US$ Million) and Volume (Units) Analysis and Forecast By Type, 2023 to 2033

Table 34: Latin America Market Size (US$ Million) and Volume (Units) Analysis and Forecast By Rating, 2018 to 2022

Table 35: Latin America Market Size (US$ Million) and Volume (Units) Analysis and Forecast By Rating, 2023 to 2033

Table 36: Latin America Market Size (US$ Million) and Volume (Units) Analysis and Forecast By Installation, 2018 to 2022

Table 37: Latin America Market Size (US$ Million) and Volume (Units) Analysis and Forecast By Installation, 2023 to 2033

Table 38: Latin America Market Size (US$ Million) and Volume (Units) Analysis and Forecast By Application, 2018 to 2022

Table 39: Latin America Market Size (US$ Million) and Volume (Units) Analysis and Forecast By Application, 2023 to 2033

Table 40: Latin America Market Size (US$ Million) and Volume (Units) Analysis and Forecast By End Use, 2018 to 2033

Table 41: Latin America Market Size (US$ Million) and Volume (Units) Analysis and Forecast By End Use, 2018 to 2033

Table 42: Western Europe Market Value (US$ Million) and Volume (Units) Historical Data By Country,2018 to 2022

Table 43: Western Europe Market Value (US$ Million) and Volume (Units) Forecast By Country, 2023 to 2033

Table 44: Western Europe Market Size (US$ Million) and Volume (Units) Analysis and Forecast By Voltage, 2018 to 2022

Table 45: Western Europe Market Size (US$ Million) and Volume (Units) Analysis and Forecast By Voltage, 2023 to 2033

Table 46: Western Europe Market Size (US$ Million) and Volume (Units) Analysis and Forecast By Type, 2018 to 2022

Table 47: Western Europe Market Size (US$ Million) and Volume (Units) Analysis and Forecast By Type, 2023 to 203347

Table 48: Western Europe Market Size (US$ Million) and Volume (Units) Analysis and Forecast By Rating, 2018 to 2022

Table 49: Western Europe Market Size (US$ Million) and Volume (Units) Analysis and Forecast By Rating, 2023 to 2033

Table 50: Western Europe Market Size (US$ Million) and Volume (Units) Analysis and Forecast By Installation, 2018 to 2022

Table 51: Western Europe Market Size (US$ Million) and Volume (Units) Analysis and Forecast By Installation, 2023 to 2033

Table 52: Western Europe Market Size (US$ Million) and Volume (Units) Analysis and Forecast By Application, 2018 to 2022

Table 53: Western Europe Market Size (US$ Million) and Volume (Units) Analysis and Forecast By Application, 2023 to 2033

Table 54: Western Europe Market Size (US$ Million) and Volume (Units) Analysis and Forecast By End Use, 2018 to 2033

Table 55: Western Europe Market Size (US$ Million) and Volume (Units) Analysis and Forecast By End Use, 2018 to 2033

Table 56: Eastern Europe Market Value (US$ Million) and Volume (Units) Historical Data By Country, 2018 to 2022

Table 57: Eastern Europe Market Value (US$ Million) and Volume (Units) Forecast By Country, 2023 to 2033

Table 58: Eastern Europe Market Size (US$ Million) and Volume (Units) Analysis and Forecast By Voltage, 2018 to 2022

Table 59: Eastern Europe Market Size (US$ Million) and Volume (Units) Analysis and Forecast By Voltage, 2023 to 2033

Table 60: Eastern Europe Market Size (US$ Million) and Volume (Units) Analysis and Forecast By Type, 2018 to 2022

Table 61: Eastern Europe Market Size (US$ Million) and Volume (Units) Analysis and Forecast By Type, 2023 to 2033

Table 62: Eastern Europe Market Size (US$ Million) and Volume (Units) Analysis and Forecast By Rating, 2018 to 2022

Table 63: Eastern Europe Market Size (US$ Million) and Volume (Units) Analysis and Forecast By Rating, 2023 to 2033

Table 64: Eastern Europe Market Size (US$ Million) and Volume (Units) Analysis and Forecast By Installation, 2018 to 2022

Table 65: Eastern Europe Market Size (US$ Million) and Volume (Units) Analysis and Forecast By Installation, 2023 to 2033

Table 66: Eastern Europe Market Size (US$ Million) and Volume (Units) Analysis and Forecast By Application, 2018 to 2022

Table 67: Eastern Europe Market Size (US$ Million) and Volume (Units) Analysis and Forecast By Application, 2023 to 2033

Table 68: Eastern Europe Market Size (US$ Million) and Volume (Units) Analysis and Forecast By End Use, 2018 to 2033

Table 69: Eastern Europe Market Size (US$ Million) and Volume (Units) Analysis and Forecast By End Use, 2018 to 2033

Table 70: Central Asia Market Size (US$ Million) and Volume (Units) Analysis and Forecast By Voltage, 2018 to 2022

Table 71: Central Asia Market Size (US$ Million) and Volume (Units) Analysis and Forecast By Voltage, 2023 to 2033

Table 72: Central Asia Market Size (US$ Million) and Volume (Units) Analysis and Forecast By Type, 2018 to 2022

Table 73: Central Asia Market Size (US$ Million) and Volume (Units) Analysis and Forecast By Type, 2023 to 2033

Table 74: Central Asia Market Size (US$ Million) and Volume (Units) Analysis and Forecast By Rating, 2018 to 2022

Table 75: Central Asia Market Size (US$ Million) and Volume (Units) Analysis and Forecast By Rating, 2023 to 2033

Table 76: Central Asia Market Size (US$ Million) and Volume (Units) Analysis and Forecast By Installation, 2018 to 2022

Table 77: Central Asia Market Size (US$ Million) and Volume (Units) Analysis and Forecast By Installation, 2023 to 2033

Table 78: Central Asia Market Size (US$ Million) and Volume (Units) Analysis and Forecast By Application, 2018 to 2022

Table 79: Central Asia Market Size (US$ Million) and Volume (Units) Analysis and Forecast By Application, 2023 to 2033

Table 80: Central Asia Market Size (US$ Million) and Volume (Units) Analysis and Forecast By End Use, 2018 to 2033

Table 81: Central Asia Market Size (US$ Million) and Volume (Units) Analysis and Forecast By End Use, 2018 to 2033

Table 82: Russia & Belarus Market Size (US$ Million) and Volume (Units) Analysis and Forecast By Voltage, 2018 to 2022

Table 83: Russia & Belarus Market Size (US$ Million) and Volume (Units) Analysis and Forecast By Voltage, 2023 to 2033

Table 84: Russia & Belarus Market Size (US$ Million) and Volume (Units) Analysis and Forecast By Type, 2018 to 2022

Table 85: Russia & Belarus Market Size (US$ Million) and Volume (Units) Analysis and Forecast By Type, 2023 to 2033

Table 86: Russia & Belarus Market Size (US$ Million) and Volume (Units) Analysis and Forecast By Rating, 2018 to 2022

Table 87: Russia & Belarus Market Size (US$ Million) and Volume (Units) Analysis and Forecast By Rating, 2023 to 2033

Table 88: Russia & Belarus Market Size (US$ Million) and Volume (Units) Analysis and Forecast By Installation, 2018 to 2022

Table 89: Russia & Belarus Market Size (US$ Million) and Volume (Units) Analysis and Forecast By Installation, 2023 to 2033

Table 90: Russia & Belarus Market Size (US$ Million) and Volume (Units) Analysis and Forecast By Application, 2018 to 2022

Table 91: Russia & Belarus Market Size (US$ Million) and Volume (Units) Analysis and Forecast By Application, 2023 to 2033

Table 92: Russia & Belarus Market Size (US$ Million) and Volume (Units) Analysis and Forecast By End Use, 2018 to 2033

Table 93: Russia & Belarus Market Size (US$ Million) and Volume (Units) Analysis and Forecast By End Use, 2018 to 2033

Table 94: Balkan & Baltics Market Size (US$ Million) and Volume (Units) Analysis and Forecast By Voltage, 2018 to 2022

Table 95: Balkan & Baltics Market Size (US$ Million) and Volume (Units) Analysis and Forecast By Voltage, 2023 to 2033

Table 96: Balkan & Baltics Market Size (US$ Million) and Volume (Units) Analysis and Forecast By Type, 2018 to 2022

Table 97: Balkan & Baltics Market Size (US$ Million) and Volume (Units) Analysis and Forecast By Type, 2023 to 2033

Table 98: Balkan & Baltics Market Size (US$ Million) and Volume (Units) Analysis and Forecast By Rating, 2018 to 2022

Table 99: Balkan & Baltics Market Size (US$ Million) and Volume (Units) Analysis and Forecast By Rating, 2023 to 2033

Table 100: Balkan & Baltics Market Size (US$ Million) and Volume (Units) Analysis and Forecast By Installation, 2018 to 2022

Table 101: Balkan & Baltics Market Size (US$ Million) and Volume (Units) Analysis and Forecast By Installation, 2023 to 2033

Table 102: Balkan & Baltics Market Size (US$ Million) and Volume (Units) Analysis and Forecast By Application, 2018 to 2022

Table 103: Balkan & Baltics Market Size (US$ Million) and Volume (Units) Analysis and Forecast By Application, 2023 to 2033

Table 104: Balkan & Baltics Market Size (US$ Million) and Volume (Units) Analysis and Forecast By End Use, 2018 to 2033

Table 105: Balkan & Baltics Market Size (US$ Million) and Volume (Units) Analysis and Forecast By End Use, 2018 to 2033

Table 106: East Asia Market Value (US$ Million) and Volume (Units) Historical Data 2018 to 2022 By Country

Table 107: East Asia Market Value (US$ Million) and Volume (Units) Forecast By Country 2023 to 2033

Table 108: East Asia Market Size (US$ Million) and Volume (Units) Analysis and Forecast By Voltage, 2018 to 2022

Table 109: East Asia Market Size (US$ Million) and Volume (Units) Analysis and Forecast By Voltage, 2023 to 2033

Table 110: East Asia Market Size (US$ Million) and Volume (Units) Analysis and Forecast By Type, 2018 to 2022

Table 111: East Asia Market Size (US$ Million) and Volume (Units) Analysis and Forecast By Type, 2023 to 2033

Table 112: East Asia Market Size (US$ Million) and Volume (Units) Analysis and Forecast By Rating, 2018 to 2022

Table 113: East Asia Market Size (US$ Million) and Volume (Units) Analysis and Forecast By Rating, 2023 to 2033

Table 114: East Asia Market Size (US$ Million) and Volume (Units) Analysis and Forecast By Installation, 2018 to 2022

Table 115: East Asia Market Size (US$ Million) and Volume (Units) Analysis and Forecast By Installation, 2023 to 2033

Table 116: East Asia Market Size (US$ Million) and Volume (Units) Analysis and Forecast By Application, 2018 to 2022

Table 117: East Asia Market Size (US$ Million) and Volume (Units) Analysis and Forecast By Application, 2023 to 2033

Table 118: East Asia Market Size (US$ Million) and Volume (Units) Analysis and Forecast By End Use, 2018 to 2033

Table 119: East Asia Market Size (US$ Million) and Volume (Units) Analysis and Forecast By End Use, 2018 to 2033

Table 120: South Asia & Pacific Market Value (US$ Million) and Volume (Units) Historical Data By Country 2018 to 2022

Table 121: South Asia & Pacific Market Value (US$ Million) and Volume (Units) Forecast 2023 to 2033 By Country

Table 122: South Asia Pacific Market Size (US$ Million) and Volume (Units) Analysis and Forecast By Voltage, 2018 to 2022

Table 123: South Asia Pacific Market Size (US$ Million) and Volume (Units) Analysis and Forecast By Voltage, 2023 to 2033

Table 124: South Asia Pacific Market Size (US$ Million) and Volume (Units) Analysis and Forecast By Type, 2018 to 2022

Table 125: South Asia Pacific Market Size (US$ Million) and Volume (Units) Analysis and Forecast By Type, 2023 to 2033

Table 126: South Asia Pacific Market Size (US$ Million) and Volume (Units) Analysis and Forecast By Rating, 2018 to 2022

Table 127: South Asia Pacific Market Size (US$ Million) and Volume (Units) Analysis and Forecast By Rating, 2023 to 2033

Table 128: South Asia Pacific Market Size (US$ Million) and Volume (Units) Analysis and Forecast By Installation, 2018 to 2022

Table 129: South Asia Pacific Market Size (US$ Million) and Volume (Units) Analysis and Forecast By Installation, 2023 to 2033

Table 130: South Asia Pacific Market Size (US$ Million) and Volume (Units) Analysis and Forecast By Application, 2018 to 2022

Table 131: South Asia Pacific Market Size (US$ Million) and Volume (Units) Analysis and Forecast By Application, 2023 to 2033

Table 132: South Asia Pacific Market Size (US$ Million) and Volume (Units) Analysis and Forecast By End Use, 2018 to 2033

Table 133: South Asia Pacific Market Size (US$ Million) and Volume (Units) Analysis and Forecast By End Use, 2018 to 2033

Table 134: Middle East Africa Market Value (US$ Million) and Volume (Units) Historical Data 2018 to 2022 By Country

Table 135: Middle East Africa Market Value (US$ Million) and Volume (Units) Forecast 2023 to 2033 By Country

Table 136: Middle East Africa Market Size (US$ Million) and Volume (Units) Analysis and Forecast By Voltage, 2018 to 2022

Table 137: Middle East Africa Market Size (US$ Million) and Volume (Units) Analysis and Forecast By Voltage, 2023 to 2033

Table 138: Middle East Africa Market Size (US$ Million) and Volume (Units) Analysis and Forecast By Type, 2018 to 2022

Table 139: Middle East Africa Market Size (US$ Million) and Volume (Units) Analysis and Forecast By Type, 2023 to 2033

Table 140: Middle East Africa Market Size (US$ Million) and Volume (Units) Analysis and Forecast By Rating, 2018 to 2022

Table 141: Middle East Africa Market Size (US$ Million) and Volume (Units) Analysis and Forecast By Rating, 2023 to 2033

Table 142: Middle East Africa Market Size (US$ Million) and Volume (Units) Analysis and Forecast By Installation, 2018 to 2022

Table 143: Middle East Africa Market Size (US$ Million) and Volume (Units) Analysis and Forecast By Installation, 2023 to 2033

Table 144: Middle East Africa Market Size (US$ Million) and Volume (Units) Analysis and Forecast By Application, 2018 to 2022

Table 145: Middle East Africa Market Size (US$ Million) and Volume (Units) Analysis and Forecast By Application, 2023 to 2033

Table 146: Middle East Africa Market Size (US$ Million) and Volume (Units) Analysis and Forecast By End Use, 2018 to 2033

Table 147: Middle East Africa Market Size (US$ Million) and Volume (Units) Analysis and Forecast By End Use, 2018 to 2033
Nikhil Kaitwade
Nikhil Kaitwade

Principal Consultant

Talk to Analyst

Find your sweet spots for generating winning opportunities in this market.

List of Charts

Figure 01: Global Market Historical Volume (Units), 2018 to 2022

Figure 02: Global Market Current and Forecast Volume (Units), 2023 to 2033

Figure 03: Global Market Historical Value (US$ Million), 2018 to 2022

Figure 04: Global Market Current and Forecast Value (US$ Million), 2023 to 2033

Figure 05: Global Market Incremental $ Opportunity (US$ Million), 2023 to 2033

Figure 06: Global Market Share and BPS Analysis By Voltage, 2023 & 2033

Figure 07: Global Market Y-o-Y Growth Projections By Voltage, 2023 to 2033

Figure 08: Global Market Attractiveness Analysis By Voltage, 2023 to 2033

Figure 09: Global Market Absolute $ Opportunity by High Voltage Segment, 2018 to 2033

Figure 10: Global Market Absolute $ Opportunity by Medium Voltage Segment, 2018 to 2033

Figure 11: Global Market Absolute $ Opportunity by Low Voltage Segment, 2018 to 2033

Figure 12: Global Market Share and BPS Analysis By Type, 2023 & 2033

Figure 13: Global Market Y-o-Y Growth Projections By Type, 2023 to 2033

Figure 14: Global Market Attractiveness Analysis By Type, 2023 to 2033

Figure 15: Global Market Absolute $ Opportunity by Pin Insulators Segment, 2018 to 2033

Figure 16: Global Market Absolute $ Opportunity by Suspension Insulators Segment, 2018 to 2033

Figure 17: Global Market Absolute $ Opportunity by Shackle Insulators Segment, 2018 to 2033

Figure 18: Global Market Absolute $ Opportunity by Others Segment, 2018 to 2033

Figure 19: Global Market Share and BPS Analysis By Rating, 2023 & 2033

Figure 20: Global Market Y-o-Y Growth Projections By Rating, 2023 to 2033

Figure 21: Global Market Attractiveness Analysis By Rating, 2023 to 2033

Figure 22: Global Market Absolute $ Opportunity by Less than 11kV Segment, 2018 to 2033

Figure 23: Global Market Absolute $ Opportunity by 11kV to 200 kV Segment, 2018 to 2033

Figure 24: Global Market Absolute $ Opportunity by 201kV to 400kV Segment, 2018 to 2033

Figure 25: Global Market Absolute $ Opportunity by 401kV to 800kV Segment, 2018 to 2033

Figure 26: Global Market Absolute $ Opportunity by 800kV to 1200kV Segment, 2018 to 2033

Figure 27: Global Market Share and BPS Analysis By Installation, 2023 & 2033

Figure 28: Global Market Y-o-Y Growth Projections By Installation, 2023 to 2033

Figure 29: Global Market Attractiveness Analysis By Installation, 2023 to 2033

Figure 30: Global Market Absolute $ Opportunity by Distribution Segment, 2018 to 2033

Figure 31: Global Market Absolute $ Opportunity by Transmission Segment, 2018 to 2033

Figure 32: Global Market Absolute $ Opportunity by Substation Segment, 2018 to 2033

Figure 33: Global Market Absolute $ Opportunity by Railways Segment, 2018 to 2033

Figure 34: Global Market Absolute $ Opportunity by Others Segment, 2018 to 2033

Figure 35: Global Market Share and BPS Analysis By Application, 2023 & 2033

Figure 36: Global Market Y-o-Y Growth Projections By Application, 2023 to 2033

Figure 37: Global Market Attractiveness Analysis By Application, 2023 to 2033

Figure 38: Global Market Absolute $ Opportunity by Cables & Transmission Lines Segment, 2018 to 2033

Figure 39: Global Market Absolute $ Opportunity by Switchgears Segment, 2018 to 2033

Figure 40: Global Market Absolute $ Opportunity by Transformers Segment, 2018 to 2033

Figure 41: Global Market Absolute $ Opportunity by Busbars Segment, 2018 to 2033

Figure 42: Global Market Absolute $ Opportunity by Others Segment, 2018 to 2033

Figure 43: Global Market Share and BPS Analysis By End Use, 2023 & 2033

Figure 44: Global Market Y-o-Y Growth Projections By End Use, 2023 to 2033

Figure 45: Global Market Attractiveness Analysis By End Use, 2023 to 2033

Figure 46: Global Market Absolute $ Opportunity by Residential Segment, 2018 to 2033

Figure 47: Global Market Absolute $ Opportunity by Commercial & Industrial Segment, 2018 to 2033

Figure 48: Global Market Absolute $ Opportunity by Utilities Segment, 2018 to 2033

Figure 49: Global Market Share and BPS Analysis By Region, 2023 & 2033

Figure 50: Global Market Y-o-Y Growth Projections By Region, 2023 to 2033

Figure 51: Global Market Attractiveness Analysis By Region, 2023 to 2033

Figure 52: Global Market Absolute $ Opportunity by North America Segment, 2018 to 2033

Figure 53: Global Market Absolute $ Opportunity by Latin America Segment, 2018 to 2033

Figure 54: Global Market Absolute $ Opportunity by Western Europe Segment, 2018 to 2033

Figure 55: Global Market Absolute $ Opportunity by Eastern Europe Segment, 2018 to 2033

Figure 56: Global Market Absolute $ Opportunity by Central Asia Segment, 2018 to 2033

Figure 57: Global Market Absolute $ Opportunity by Russia & Belarus Segment, 2018 to 2033

Figure 58: Global Market Absolute $ Opportunity by Balkan & Baltics Segment, 2018 to 2033

Figure 59: Global Market Absolute $ Opportunity by East Asia Segment, 2018 to 2033

Figure 60: Global Market Absolute $ Opportunity South Asia Pacific Segment, 2018 to 2033

Figure 61: Global Market Absolute $ Opportunity by Middle East & Africa Segment, 2018 to 2033

Figure 62: North America Market Share and BPS Analysis By Country, 2023 & 2033

Figure 63: North America Market Y-o-Y Growth Projections By Country, 2023 to 2033

Figure 64: North America Market Attractiveness Analysis By Country, 2023 to 2033

Figure 65: North America Market Share and BPS Analysis By Voltage, 2023 & 2033

Figure 66: North America Market Y-o-Y Growth Projections By Voltage, 2023 to 2033

Figure 67: North America Market Attractiveness Analysis By Voltage, 2023 to 2033

Figure 68: North America Market Share and BPS Analysis By Type, 2023 & 2033

Figure 69: North America Market Y-o-Y Growth Projections By Type, 2023 to 2033

Figure 70: North America Market Attractiveness Analysis By Type, 2023 to 2033

Figure 71: North America Market Share and BPS Analysis By Rating, 2023 & 2033

Figure 72: North America Market Y-o-Y Growth Projections By Rating, 2023 to 2033

Figure 73: North America Market Attractiveness Analysis By Rating, 2023 to 2033

Figure 74: North America Market Share and BPS Analysis By Installation, 2023 & 2033

Figure 75: North America Market Y-o-Y Growth Projections By Installation, 2023 to 2033

Figure 76: North America Market Attractiveness Analysis By Installation, 2023 to 2033

Figure 77: North America Market Share and BPS Analysis By Application, 2023 & 2033

Figure 78: North America Market Y-o-Y Growth Projections By Application, 2023 to 2033

Figure 79: North America Market Attractiveness Analysis By Application, 2023 to 2033

Figure 80: North America Market Share and BPS Analysis By End Use, 2023 & 2033

Figure 81: North America Market Y-o-Y Growth Projections By End Use, 2023 to 2033

Figure 82: North America Market Attractiveness Analysis By End Use, 2023 to 2033

Figure 83: Latin America Market Share and BPS Analysis By Country– 2023 & 2023

Figure 84: Latin America Market Y-o-Y Growth Projection By Country, 2023 to 2033

Figure 85: Latin America Market Attractiveness Index By Country, 2023 to 2033

Figure 86: Latin America Market Share and BPS Analysis By Voltage, 2023 & 2033

Figure 87: Latin America Market Y-o-Y Growth Projections By Voltage, 2023 to 2033

Figure 88: Latin America Market Attractiveness Analysis By Voltage, 2023 to 2033

Figure 89: Latin America Market Share and BPS Analysis By Type, 2023 & 2033

Figure 90: Latin America Market Y-o-Y Growth Projections By Type, 2023 to 2033

Figure 91: Latin America Market Attractiveness Analysis By Type, 2023 to 2033

Figure 92: Latin America Market Share and BPS Analysis By Rating, 2023 & 2033

Figure 93: Latin America Market Y-o-Y Growth Projections By Rating, 2023 to 2033

Figure 94: Latin America Market Attractiveness Analysis By Rating, 2023 to 2033

Figure 95: Latin America Market Share and BPS Analysis By Installation, 2023 & 2033

Figure 96: Latin America Market Y-o-Y Growth Projections By Installation, 2023 to 2033

Figure 97: Latin America Market Attractiveness Analysis By Installation, 2023 to 2033

Figure 98: Latin America Market Share and BPS Analysis By Application, 2023 & 2033

Figure 99: Latin America Market Y-o-Y Growth Projections By Application, 2023 to 2033

Figure 100: Latin America Market Attractiveness Analysis By Application, 2023 to 2033

Figure 101: Latin America Market Share and BPS Analysis By End Use, 2023 & 2033

Figure 102: Latin America Market Y-o-Y Growth Projections By End Use, 2023 to 2033

Figure 103: Latin America Market Attractiveness Analysis By End Use, 2023 to 2033

Figure 104: Western Europe Market Share and BPS Analysis By Country– 2023 & 2023

Figure 105: Western Europe Market Y-o-Y Growth Projection By Country, 2023 to 2033

Figure 106: Western Europe Market Attractiveness Index By Country, 2023 to 2033

Figure 107: Western Europe Market Share and BPS Analysis By Voltage, 2023 & 2033

Figure 108: Western Europe Market Y-o-Y Growth Projections By Voltage, 2023 to 2033

Figure 109: Western Europe Market Attractiveness Analysis By Voltage, 2023 to 2033

Figure 110: Western Europe Market Share and BPS Analysis By Type, 2023 & 2033

Figure 111: Western Europe Market Y-o-Y Growth Projections By Type, 2023 to 2033

Figure 112: Western Europe Market Attractiveness Analysis By Type, 2023 to 2033

Figure 113: Western Europe Market Share and BPS Analysis By Rating, 2023 & 2033

Figure 114: Western Europe Market Y-o-Y Growth Projections By Rating, 2023 to 2033

Figure 115: Western Europe Market Attractiveness Analysis By Rating, 2023 to 2033

Figure 116: Western Europe Market Share and BPS Analysis By Installation, 2023 & 2033

Figure 117: Western Europe Market Y-o-Y Growth Projections By Installation, 2023 to 2033

Figure 118: Western Europe Market Attractiveness Analysis By Installation, 2023 to 2033

Figure 119: Western Europe Market Share and BPS Analysis By Application, 2023 & 2033

Figure 120: Western Europe Market Y-o-Y Growth Projections By Application, 2023 to 2033

Figure 121: Western Europe Market Attractiveness Analysis By Application, 2023 to 2033

Figure 122: Western Europe Market Share and BPS Analysis By End Use, 2023 & 2033

Figure 123: Western Europe Market Y-o-Y Growth Projections By End Use, 2023 to 2033

Figure 124: Western Europe Market Attractiveness Analysis By End Use, 2023 to 2033

Figure 125: Eastern Europe Market Share and BPS Analysis By Country– 2023 & 2023

Figure 126: Eastern Europe Market Y-o-Y Growth Projection By Country, 2023 to 2033

Figure 127: Eastern Europe Market Attractiveness Index By Country, 2023 to 2033

Figure 128: Eastern Europe Market Share and BPS Analysis By Voltage, 2023 & 2033

Figure 129: Eastern Europe Market Y-o-Y Growth Projections By Voltage, 2023 to 2033

Figure 130: Eastern Europe Market Attractiveness Analysis By Voltage, 2023 to 2033

Figure 131: Eastern Europe Market Share and BPS Analysis By Type, 2023 & 2033

Figure 132: Eastern Europe Market Y-o-Y Growth Projections By Type, 2023 to 2033

Figure 133: Eastern Europe Market Attractiveness Analysis By Type, 2023 to 2033

Figure 134: Eastern Europe Market Share and BPS Analysis By Rating, 2023 & 2033

Figure 135: Eastern Europe Market Y-o-Y Growth Projections By Rating, 2023 to 2033

Figure 136: Eastern Europe Market Attractiveness Analysis By Rating, 2023 to 2033

Figure 137: Eastern Europe Market Share and BPS Analysis By Installation, 2023 & 2033

Figure 138: Eastern Europe Market Y-o-Y Growth Projections By Installation, 2023 to 2033

Figure 139: Eastern Europe Market Attractiveness Analysis By Installation, 2023 to 2033

Figure 140: Eastern Europe Market Share and BPS Analysis By Application, 2023 & 2033

Figure 141: Eastern Europe Market Y-o-Y Growth Projections By Application, 2023 to 2033

Figure 142: Eastern Europe Market Attractiveness Analysis By Application, 2023 to 2033

Figure 143: Eastern Europe Market Share and BPS Analysis By End Use, 2023 & 2033

Figure 144: Eastern Europe Market Y-o-Y Growth Projections By End Use, 2023 to 2033

Figure 145: Eastern Europe Market Attractiveness Analysis By End Use, 2023 to 2033

Figure 146: Central Asia Market Share and BPS Analysis By Voltage, 2023 & 2033

Figure 147: Central Asia Market Y-o-Y Growth Projections By Voltage, 2023 to 2033

Figure 148: Central Asia Market Attractiveness Analysis By Voltage, 2023 to 2033

Figure 149: Central Asia Market Share and BPS Analysis By Type, 2023 & 2033

Figure 150: Central Asia Market Y-o-Y Growth Projections By Type, 2023 to 2033

Figure 151: Central Asia Market Attractiveness Analysis By Type, 2023 to 2033

Figure 152: Central Asia Market Share and BPS Analysis By Rating, 2023 & 2033

Figure 153: Central Asia Market Y-o-Y Growth Projections By Rating, 2023 to 2033

Figure 154: Central Asia Market Attractiveness Analysis By Rating, 2023 to 2033

Figure 155: Central Asia Market Share and BPS Analysis By Installation, 2023 & 2033

Figure 156: Central Asia Market Y-o-Y Growth Projections By Installation, 2023 to 2033

Figure 157: Central Asia Market Attractiveness Analysis By Installation, 2023 to 2033

Figure 158: Central Asia Market Share and BPS Analysis By Application, 2023 & 2033

Figure 159: Central Asia Market Y-o-Y Growth Projections By Application, 2023 to 2033

Figure 160: Central Asia Market Attractiveness Analysis By Application, 2023 to 2033

Figure 161: Central Asia Market Share and BPS Analysis By End Use, 2023 & 2033

Figure 162: Central Asia Market Y-o-Y Growth Projections By End Use, 2023 to 2033

Figure 163: Central Asia Market Attractiveness Analysis By End Use, 2023 to 2033

Figure 164: Russia & Belarus Market Share and BPS Analysis By Voltage, 2023 & 2033

Figure 165: Russia & Belarus Market Y-o-Y Growth Projections By Voltage, 2023 to 2033

Figure 166: Russia & Belarus Market Attractiveness Analysis By Voltage, 2023 to 2033

Figure 167: Russia & Belarus Market Share and BPS Analysis By Type, 2023 & 2033

Figure 168: Russia & Belarus Market Y-o-Y Growth Projections By Type, 2023 to 2033

Figure 169: Russia & Belarus Market Attractiveness Analysis By Type, 2023 to 2033

Figure 170: Russia & Belarus Market Share and BPS Analysis By Rating, 2023 & 2033

Figure 171: Russia & Belarus Market Y-o-Y Growth Projections By Rating, 2023 to 2033

Figure 172: Russia & Belarus Market Attractiveness Analysis By Rating, 2023 to 2033

Figure 173: Russia & Belarus Market Share and BPS Analysis By Installation, 2023 & 2033

Figure 174: Russia & Belarus Market Y-o-Y Growth Projections By Installation, 2023 to 2033

Figure 175: Russia & Belarus Market Attractiveness Analysis By Installation, 2023 to 2033

Figure 176: Russia & Belarus Market Share and BPS Analysis By Application, 2023 & 2033

Figure 177: Russia & Belarus Market Y-o-Y Growth Projections By Application, 2023 to 2033

Figure 178: Russia & Belarus Market Attractiveness Analysis By Application, 2023 to 2033

Figure 179: Russia & Belarus Market Share and BPS Analysis By End Use, 2023 & 2033

Figure 180: Russia & Belarus Market Y-o-Y Growth Projections By End Use, 2023 to 2033

Figure 181: Russia & Belarus Market Attractiveness Analysis By End Use, 2023 to 2033

Figure 182: Balkan & Baltics Market Share and BPS Analysis By Voltage, 2023 & 2033

Figure 183: Balkan & Baltics Market Y-o-Y Growth Projections By Voltage, 2023 to 2033

Figure 184: Balkan & Baltics Market Attractiveness Analysis By Voltage, 2023 to 2033

Figure 185: Balkan & Baltics Market Share and BPS Analysis By Type, 2023 & 2033

Figure 186: Balkan & Baltics Market Y-o-Y Growth Projections By Type, 2023 to 2033

Figure 187: Balkan & Baltics Market Attractiveness Analysis By Type, 2023 to 2033

Figure 188: Balkan & Baltics Market Share and BPS Analysis By Rating, 2023 & 2033

Figure 189: Balkan & Baltics Market Y-o-Y Growth Projections By Rating, 2023 to 2033

Figure 190: Balkan & Baltics Market Attractiveness Analysis By Rating, 2023 to 2033

Figure 191: Balkan & Baltics Market Share and BPS Analysis By Installation, 2023 & 2033

Figure 192: Balkan & Baltics Market Y-o-Y Growth Projections By Installation, 2023 to 2033

Figure 193: Balkan & Baltics Market Attractiveness Analysis By Installation, 2023 to 2033

Figure 194: Balkan & Baltics Market Share and BPS Analysis By Application, 2023 & 2033

Figure 195: Balkan & Baltics Market Y-o-Y Growth Projections By Application, 2023 to 2033

Figure 196: Balkan & Baltics Market Attractiveness Analysis By Application, 2023 to 2033

Figure 197: Balkan & Baltics Market Share and BPS Analysis By End Use, 2023 & 2033

Figure 198: Balkan & Baltics Market Y-o-Y Growth Projections By End Use, 2023 to 2033

Figure 199: Balkan & Baltics Market Attractiveness Analysis By End Use, 2023 to 2033

Figure 200: East Asia Market Share and BPS Analysis By Country– 2023 & 2023

Figure 201: East Asia Market Y-o-Y Growth Projection By Country, 2023 to 2033

Figure 202: East Asia Market Attractiveness Index By Country, 2023 to 2033

Figure 203: East Asia Market Share and BPS Analysis By Voltage, 2023 & 2033

Figure 204: East Asia Market Y-o-Y Growth Projections By Voltage, 2023 to 2033

Figure 205: East Asia Market Attractiveness Analysis By Voltage, 2023 to 2033

Figure 206: East Asia Market Share and BPS Analysis By Type, 2023 & 2033

Figure 207: East Asia Market Y-o-Y Growth Projections By Type, 2023 to 2033

Figure 208: East Asia Market Attractiveness Analysis By Type, 2023 to 2033

Figure 209: East Asia Market Share and BPS Analysis By Rating, 2023 & 2033

Figure 210: East Asia Market Y-o-Y Growth Projections By Rating, 2023 to 2033

Figure 211: East Asia Market Attractiveness Analysis By Rating, 2023 to 2033

Figure 212: East Asia Market Share and BPS Analysis By Installation, 2023 & 2033

Figure 213: East Asia Market Y-o-Y Growth Projections By Installation, 2023 to 2033

Figure 214: East Asia Market Attractiveness Analysis By Installation, 2023 to 2033

Figure 215: East Asia Market Share and BPS Analysis By Application, 2023 & 2033

Figure 216: East Asia Market Y-o-Y Growth Projections By Application, 2023 to 2033

Figure 217: East Asia Market Attractiveness Analysis By Application, 2023 to 2033

Figure 218: East Asia Market Share and BPS Analysis By End Use, 2023 & 2033

Figure 219: East Asia Market Y-o-Y Growth Projections By End Use, 2023 to 2033

Figure 220: East Asia Market Attractiveness Analysis By End Use, 2023 to 2033

Figure 221: South Asia & Pacific Market Share and BPS Analysis By Country– 2023 & 2023

Figure 222: South Asia & Pacific Market Y-o-Y Growth Projection By Country, 2023 to 2033

Figure 223: South Asia & Pacific Market Attractiveness Index By Country, 2023 to 2033

Figure 224: South Asia Pacific Market Share and BPS Analysis By Voltage, 2023 & 2033

Figure 225: South Asia Pacific Market Y-o-Y Growth Projections By Voltage, 2023 to 2033

Figure 226: South Asia Pacific Market Attractiveness Analysis By Voltage, 2023 to 2033

Figure 227: South Asia Pacific Market Share and BPS Analysis By Type, 2023 & 2033

Figure 228: South Asia Pacific Market Y-o-Y Growth Projections By Type, 2023 to 2033

Figure 229: South Asia Pacific Market Attractiveness Analysis By Type, 2023 to 2033

Figure 230: South Asia Pacific Market Share and BPS Analysis By Rating, 2023 & 2033

Figure 231: South Asia Pacific Market Y-o-Y Growth Projections By Rating, 2023 to 2033

Figure 232: South Asia Pacific Market Attractiveness Analysis By Rating, 2023 to 2033

Figure 233: South Asia Pacific Market Share and BPS Analysis By Installation, 2023 & 2033

Figure 234: South Asia Pacific Market Y-o-Y Growth Projections By Installation, 2023 to 2033

Figure 235: South Asia Pacific Market Attractiveness Analysis By Installation, 2023 to 2033

Figure 236: South Asia Pacific Market Share and BPS Analysis By Application, 2023 & 2033

Figure 237: South Asia Pacific Market Y-o-Y Growth Projections By Application, 2023 to 2033

Figure 238: South Asia Pacific Market Attractiveness Analysis By Application, 2023 to 2033

Figure 239: South Asia Pacific Market Share and BPS Analysis By End Use, 2023 & 2033

Figure 240: South Asia Pacific Market Y-o-Y Growth Projections By End Use, 2023 to 2033

Figure 241: South Asia Pacific Market Attractiveness Analysis By End Use, 2023 to 2033

Figure 242: Middle East Africa Market Share and BPS Analysis By Country, 2023 & 2033

Figure 243: Middle East Africa Market Y-o-Y Growth Projections By Country, 2023 to 2033

Figure 244: Middle East Africa Market Attractiveness Analysis By Country, 2023 to 2033

Figure 245: Middle East Africa Market Share and BPS Analysis By Voltage, 2023 & 2033

Figure 246: Middle East Africa Market Y-o-Y Growth Projections By Voltage, 2023 to 2033

Figure 247: Middle East Africa Market Attractiveness Analysis By Voltage, 2023 to 2033

Figure 248: Middle East Africa Market Share and BPS Analysis By Type, 2023 & 2033

Figure 249: Middle East Africa Market Y-o-Y Growth Projections By Type, 2023 to 2033

Figure 250: Middle East Africa Market Attractiveness Analysis By Type, 2023 to 2033

Figure 251: Middle East Africa Market Share and BPS Analysis By Rating, 2023 & 2033

Figure 252: Middle East Africa Market Y-o-Y Growth Projections By Rating, 2023 to 2033

Figure 253: Middle East Africa Market Attractiveness Analysis By Rating, 2023 to 2033

Figure 254: Middle East Africa Market Share and BPS Analysis By Installation, 2023 & 2033

Figure 255: Middle East Africa Market Y-o-Y Growth Projections By Installation, 2023 to 2033

Figure 256: Middle East Africa Market Attractiveness Analysis By Installation, 2023 to 2033

Figure 257: Middle East Africa Market Share and BPS Analysis By Application, 2023 & 2033

Figure 258: Middle East Africa Market Y-o-Y Growth Projections By Application, 2023 to 2033

Figure 259: Middle East Africa Market Attractiveness Analysis By Application, 2023 to 2033

Figure 260: Middle East Africa Market Share and BPS Analysis By End Use, 2023 & 2033

Figure 261: Middle East Africa Market Y-o-Y Growth Projections By End Use, 2023 to 2033

Figure 262: Middle East Africa Market Attractiveness Analysis By End Use, 2023 to 2033

Recommendations

Industrial Automation

Thermal Interface Pads and Materials Market

Published : June 2023

Industrial Automation

Steel Pipe Market

Published : June 2023

Industrial Automation

Multifuel Gas Turbine Market

Published : June 2023

Industrial Automation

Thickness Planers Market

Published : June 2023

Explore Industrial Automation Insights

View Reports

Composite Insulator Market