The composite paper cans market stands at the forefront of a transformative decade that promises to redefine packaging infrastructure and advanced containment technology. The market's journey from USD 3,624 million in 2025 to USD 5,903.1 million by 2035 represents substantial growth, demonstrating the accelerating adoption of advanced cylindrical packaging systems and reliable containment solutions across food, personal care, and industrial sectors.
The first half of the decade (2025-2030) will witness the market climbing from USD 3,624 million to approximately USD 4,612 million, adding USD 988 million in value, which constitutes 44% of the total forecast growth period. This phase will be characterized by the rapid adoption of fiber-based packaging systems, driven by increasing demand for recyclable packaging materials and advanced barrier protection practices worldwide. Enhanced structural integrity and efficient production features will become standard expectations rather than premium options.
The latter half (2030-2035) will witness constant growth from USD 4,612 million to USD 5,903.1 million, representing an addition of USD 1,285 million or 56% of the decade's expansion. This period will be defined by mass market penetration of multi-layer composite systems, integration with comprehensive packaging platforms, and seamless compatibility with existing filling infrastructure. The market trajectory signals fundamental shifts in how consumer goods manufacturers and packaging professionals approach cylindrical containment solutions, with participants positioned to benefit from steady demand across multiple application segments.
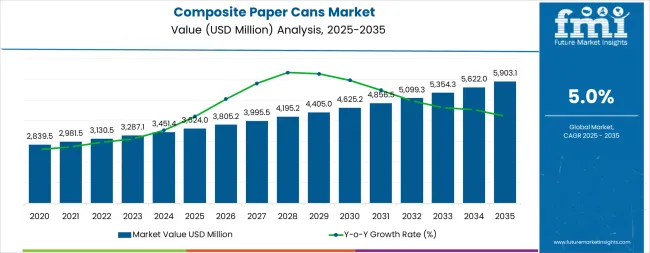
The composite paper cans market demonstrates distinct growth phases with varying market characteristics and competitive dynamics. Between 2025 and 2030, the market progresses through its technology adoption phase, expanding from USD 3,624 million to USD 4,612 million with steady annual increments averaging 5.0% growth. This period showcases the transition from basic cylindrical containers to advanced systems with enhanced barrier capabilities and integrated moisture protection becoming mainstream features.
The 2025-2030 phase adds USD 988 million to market value, representing 44% of total decade expansion. Market maturation factors include standardization of production protocols, declining component costs for raw materials, and increasing manufacturer awareness of composite can benefits reaching 75-80% effectiveness in product protection applications. Competitive landscape evolution during this period features established packaging manufacturers like Sonoco Products Company and Greif Inc. expanding their composite can portfolios while new entrants focus on specialized formulations and enhanced barrier efficiency.
From 2030 to 2035, market dynamics shift toward advanced integration and multi-product deployment, with growth accelerating from USD 4,612 million to USD 5,903.1 million, adding USD 1,285 million or 56% of total expansion. This phase transition logic centers on universal packaging systems, integration with automated filling networks, and deployment across diverse consumer scenarios, becoming standard rather than specialized applications.
| Metric | Value |
|---|---|
| Market Value (2025) | USD 3,624 million |
| Market Forecast (2035) | USD 5,903.1 million |
| Growth Rate | 5.0% CAGR |
| Leading Technology | Spiral Wound |
| Primary Application | Food & Beverages Segment |
The market demonstrates strong fundamentals with spiral wound systems capturing a dominant share through advanced structural integrity and reliable deployment capabilities. Food and beverages applications drive primary demand, supported by increasing consumer preference for fiber-based packaging systems and performance management solutions. Geographic expansion remains concentrated in developed markets with established consumer goods infrastructure, while emerging economies show accelerating adoption rates driven by retail modernization and rising packaging requirements.
Market expansion rests on three fundamental shifts driving adoption across consumer goods and packaging sectors. 1. Environmental packaging demand creates compelling operational advantages through composite paper can systems that provide recyclable materials with reliable performance, enabling brands to enhance environmental credentials while maintaining product protection and reducing packaging waste. 2. Retail modernization programs accelerate as consumer goods companies worldwide seek fiber-based packaging systems that complement traditional plastic containers, enabling premium presentation solutions that align with brand values and consumer preference requirements. 3. Regulatory enhancement drives adoption from food and beverage manufacturers requiring effective packaging solutions that minimize environmental impact while maintaining product integrity during distribution and storage applications.
The growth faces headwinds from production complexity challenges that vary across product types regarding filling equipment integration and structural requirements, potentially limiting deployment flexibility in certain manufacturing environments. Technical limitations also persist regarding moisture sensitivity and barrier properties that may increase operational costs in high-humidity applications with demanding preservation standards.
The composite paper cans market represents a compelling intersection of packaging innovation, consumer goods evolution, and quality management. With robust growth projected from USD 3,624 million in 2025 to USD 5,903.1 million by 2035 at a 5.0% CAGR, this market is driven by increasing environmental consciousness, commercial packaging upgrades, and regulatory pressures for recyclable packaging practices.
The market's expansion reflects a fundamental shift in how consumer brands and packaging professionals approach containment infrastructure. Strong growth opportunities exist across diverse applications, from food operations requiring reliable barrier quality to personal care facilities demanding advanced packaging standards. Geographic expansion is particularly pronounced in Asia-Pacific markets, LED by India (6.2% CAGR) and China (5.8% CAGR), while established markets in North America and Europe drive premium positioning and technology innovation.
The dominance of spiral wound systems and food applications underscores the importance of proven manufacturing technology and operational reliability in driving adoption. Production complexity and infrastructure compatibility remain key challenges, creating opportunities for companies that can simplify deployment while maintaining performance standards.
Primary Classification: The market segments by product type into spiral wound, convolute wound, and telescopic categories, representing the evolution from basic cylindrical containers to advanced multi-layer structures for comprehensive packaging operations.
Secondary Breakdown: Application segmentation divides the market into food & beverages, personal care & cosmetics, pharmaceuticals, chemicals, and others sectors, reflecting distinct requirements for barrier standards, brand aesthetics, and regulatory compliance.
Regional Classification: Geographic distribution covers North America, Europe, Asia Pacific, Latin America, and the Middle East & Africa, with developed markets leading adoption while emerging economies show accelerating growth patterns driven by retail modernization programs.
The segmentation structure reveals technology progression from spiral wound packaging systems toward integrated multi-layer platforms with enhanced barrier and printing capabilities, while application diversity spans from food operations to premium cosmetics requiring precise brand presentation solutions.
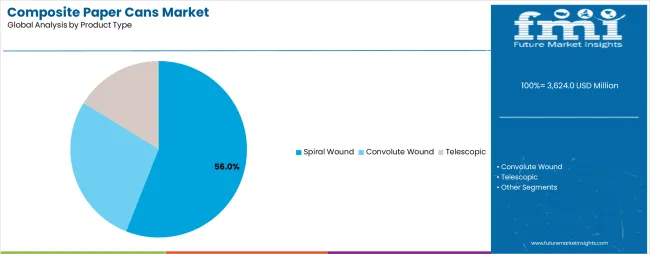
Spiral wound segment is estimated to account for 56% of the composite paper cans market share in 2025. The segment's leading position stems from its fundamental role as a critical component in cylindrical packaging applications and its extensive use across multiple consumer goods sectors. Spiral wound construction's dominance is attributed to its superior structural properties, including compression resistance, stacking strength, and production efficiency capabilities that make it indispensable for food and beverage packaging operations.
Market Position: Spiral wound systems command the leading position in the composite paper cans market through advanced manufacturing features, including comprehensive layer bonding, extended shelf life protection, and reliable performance that enable brands to deploy fiber-based packaging solutions across diverse consumer environments.
Value Drivers: The segment benefits from manufacturer preference for proven production technology that provides consistent quality without requiring complex equipment modifications. Reliable design features enable deployment in food packaging environments, beverage applications, and consumer goods facilities where structural integrity and cost-effectiveness represent critical operational requirements.
Competitive Advantages: Spiral wound systems differentiate through high-speed production capability, proven structural performance, and compatibility with standard filling systems that enhance manufacturing efficiency while maintaining cost-effective operational profiles suitable for diverse packaging applications.
Key market characteristics:
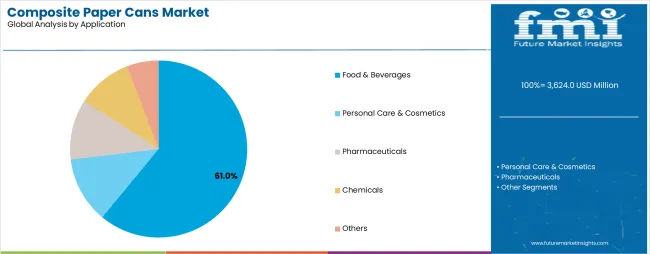
Food & beverages segment is projected to hold 61% of the composite paper cans market share in 2025. The segment's market leadership is driven by the extensive use of composite cans in snack foods, powdered beverages, nuts, dried fruits, confectionery, and infant nutrition, where cans serve as both a protective barrier and brand presentation platform. The food industry's consistent demand for high-quality, cost-effective packaging materials supports the segment's dominant position.
Market Context: Food applications dominate the market due to widespread adoption of fiber-based packaging materials and increasing focus on product freshness management, consumer convenience, and brand differentiation applications that enhance shelf appeal while maintaining product integrity.
Appeal Factors: Food customers prioritize packaging reliability, barrier consistency, and integration with existing filling infrastructure that enables coordinated deployment across multiple production systems. The segment benefits from substantial brand marketing budgets and product innovation programs that emphasize premium packaging for competitive differentiation.
Growth Drivers: Retail modernization programs incorporate composite cans as standard packaging for premium food products and specialty applications. At the same time, e-commerce growth is increasing demand for durable packaging that complies with shipping standards and enhances unboxing experience.
Market Challenges: Filling equipment requirements and moisture sensitivity issues may limit deployment flexibility in certain product categories or high-speed production scenarios.
Application dynamics include:
Growth Accelerators: Packaging modernization drives primary adoption as composite paper can systems provide recyclable containment capabilities that enable brand differentiation without plastic materials, supporting regulatory compliance and consumer preferences that require fiber-based packaging management. Environmental demand accelerates market expansion as companies seek effective packaging solutions that minimize environmental footprint while maintaining product protection during distribution and storage operations. Retail spending increases worldwide, creating continued demand for premium packaging systems that complement traditional containers and provide brand visibility in competitive retail environments.
Growth Inhibitors: Production complexity challenges vary across product types regarding filling equipment integration and structural requirements, which may limit deployment flexibility and market penetration in facilities with restrictive infrastructure modifications. Technical performance limitations persist regarding high-moisture applications and extreme temperature exposure that may increase operational costs in demanding environments with extended storage patterns. Market fragmentation across multiple food safety standards and packaging regulations creates compatibility concerns between different can specifications and existing production infrastructure.
Market Evolution Patterns: Adoption accelerates in food and beverage sectors where premium packaging justifies material costs, with geographic concentration in developed markets transitioning toward mainstream adoption in emerging economies driven by retail modernization and infrastructure development. Technology development focuses on enhanced barrier capabilities, improved printing quality, and integration with automated filling systems that optimize production scheduling and quality monitoring. The market could face disruption if alternative fiber packaging technologies or regulatory restrictions significantly limit composite can deployment in food or consumer goods applications.
The composite paper cans market demonstrates varied regional dynamics with Growth Leaders including India (6.2% CAGR) and China (5.8% CAGR) driving expansion through retail modernization and consumer goods development. Steady Performers encompass the USA (5.6% CAGR), Germany (5.1% CAGR), and Japan (4.8% CAGR), benefiting from established consumer brands and advanced packaging adoption.
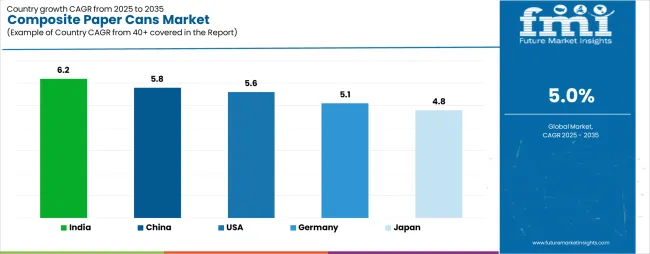
| Country | CAGR (2025-2035) |
|---|---|
| India | 6.2% |
| China | 5.8% |
| USA | 5.6% |
| Germany | 5.1% |
| Japan | 4.8% |
Regional synthesis reveals Asia-Pacific markets leading growth through retail modernization and consumer goods development, while European countries maintain steady expansion supported by technology advancement and brand innovation requirements. North American markets show strong growth driven by food applications and premium packaging integration trends.
India establishes regional leadership through aggressive retail modernization programs and comprehensive consumer goods development, integrating composite paper cans as standard packaging in food and personal care applications. The country's 6.2% CAGR through 2035 reflects government initiatives promoting domestic manufacturing and packaging industry capabilities that encourage the use of fiber-based packaging systems in consumer goods operations. Growth concentrates in major consumer centers, including Mumbai, Delhi, and Bangalore, where brand modernization showcases innovative packaging systems that appeal to middle-class consumers seeking premium product experiences and environmental responsibility.
Indian manufacturers are developing cost-effective composite can solutions that combine domestic production advantages with advanced features, including multi-color printing systems and enhanced barrier capacity.
Strategic Market Indicators:
The Chinese market emphasizes large-scale production deployment, including rapid retail expansion and comprehensive brand development that increasingly incorporates composite paper cans for food packaging and personal care applications. The country is projected to show a 5.8% CAGR through 2035, driven by massive consumer spending under urbanization programs and commercial demand for distinctive, cost-effective packaging systems. Chinese consumer brands prioritize packaging aesthetics with composite cans delivering premium presentation through advanced printing properties and structural versatility capabilities.
Technology deployment channels include major packaging converters, specialized design agencies, and brand procurement programs that support professional graphics development for competitive retail applications.
Performance Metrics:
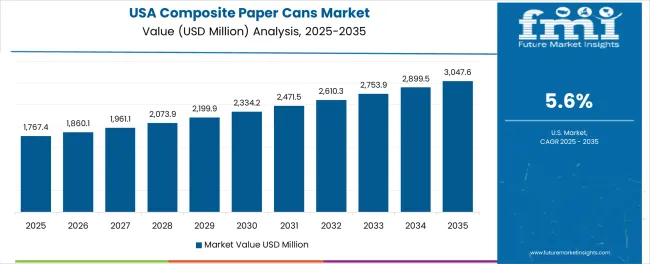
The USA market emphasizes advanced composite can features, including precision graphics systems and integration with comprehensive brand platforms that manage packaging design, inventory optimization, and consumer engagement applications through unified marketing systems. The country is projected to show a 5.6% CAGR through 2035, driven by brand differentiation under consumer goods innovation and commercial demand for distinctive, premium packaging systems. American consumer brands prioritize packaging effectiveness with composite cans delivering consistent performance through advanced barrier formulations and printing quality capabilities.
Technology deployment channels include major packaging distributors, specialized converters, and brand procurement programs that support professional design services for complex marketing operations.
Performance Metrics:
In Munich, Hamburg, and Stuttgart, German consumer brands and packaging companies are implementing advanced composite paper can systems to enhance product presentation capabilities and support regulatory compliance that aligns with packaging requirements and environmental protocols. The German market demonstrates continued growth with a 5.1% CAGR through 2035, driven by brand modernization programs and packaging innovation that emphasizes fiber-based systems for food and personal care applications. German consumer brands are prioritizing composite can systems that provide reliable barrier capabilities while maintaining compliance with packaging standards and minimizing environmental impact, particularly important in organic foods and natural cosmetics operations.
Market expansion benefits from quality assurance programs that mandate recyclable packaging in consumer goods specifications, creating steady demand across Germany's food and personal care sectors, where brand differentiation and environmental responsibility represent critical requirements.
Strategic Market Indicators:
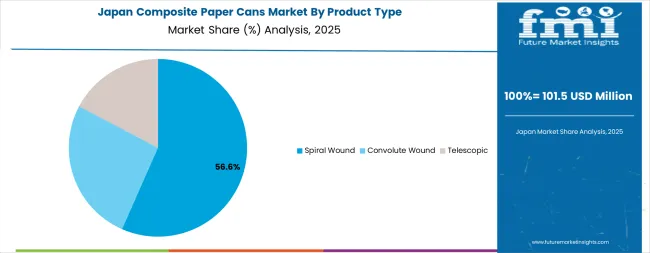
The advanced consumer market in Japan demonstrates sophisticated composite can deployment, growing at 4.8% CAGR, with documented brand effectiveness in confectionery and premium beverage applications through integration with existing production systems and quality control infrastructure. The country leverages packaging expertise in printing technology and structural engineering to maintain market leadership. Consumer centers, including Tokyo, Osaka, and Nagoya, showcase premium installations where composite can systems integrate with comprehensive brand platforms and quality management systems to optimize product presentation and consumer experience.
Japanese consumer brands prioritize packaging innovation and aesthetic standards in container development, creating demand for premium can systems with advanced features, including metallic finishes and integration with limited edition marketing systems. The market benefits from established retail infrastructure and willingness to invest in distinctive packaging technologies that provide brand differentiation and consumer engagement.
Market Intelligence Brief:
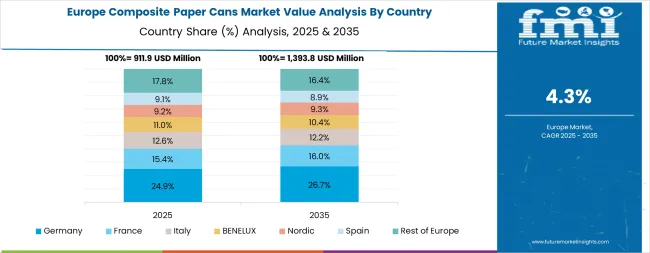
The composite paper cans market in Europe is projected to grow from USD 1,077 million in 2025 to USD 1,753 million by 2035, registering a CAGR of 5.0% over the forecast period. Germany is expected to maintain its leadership position with a 31.8% market share in 2025, declining slightly to 31.4% by 2035, supported by its advanced consumer goods infrastructure and major retail centers, including Bavaria and North Rhine-Westphalia.
The United Kingdom follows with a 24.3% share in 2025, projected to reach 24.6% by 2035, driven by comprehensive brand innovation and premium packaging development initiatives. France holds a 19.7% share in 2025, expected to maintain 19.9% by 2035 through established food sectors and packaging technology adoption. Italy commands a 14.2% share, while Spain accounts for 7.4% in 2025. The Rest of Europe region is anticipated to gain momentum, expanding its collective share from 2.6% to 2.9% by 2035, attributed to increasing consumer adoption in Nordic countries and emerging Eastern European retail facilities implementing advanced packaging programs.
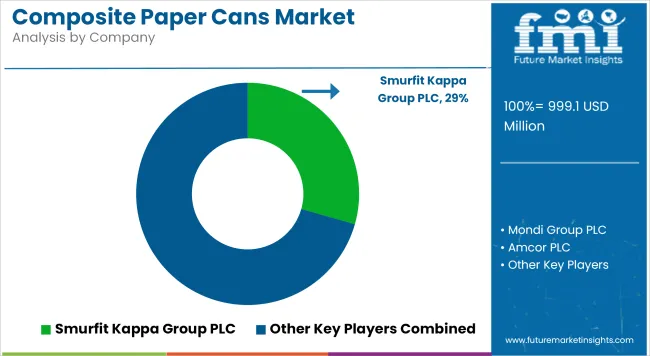
The composite paper cans market operates with moderate concentration, featuring approximately 15-22 participants, where leading companies control roughly 45-50% of the global market share through established brand relationships and comprehensive product portfolios. Competition emphasizes advanced printing capabilities, structural reliability, and production versatility rather than price-based rivalry.
Market Leaders encompass Sonoco Products Company, Greif Inc., and Amcor plc, which maintain competitive advantages through extensive packaging expertise, global manufacturing networks, and comprehensive design engineering capabilities that create customer loyalty and support premium pricing. These companies leverage decades of consumer goods experience and ongoing technology investments to develop advanced composite can systems with enhanced barrier and aesthetic features.
Technology Challengers include Smurfit Kappa Group, CCL Industries Inc., and Ace Paper Tube, which compete through specialized manufacturing technology focus and innovative printing interfaces that appeal to consumer brands seeking distinctive packaging capabilities and operational flexibility. These companies differentiate through rapid customization cycles and specialized premium application focus.
Market dynamics favor participants that combine reliable structural materials with advanced printing support, including graphic design services and brand development capabilities. Competitive pressure intensifies as traditional rigid packaging manufacturers expand into composite can systems. At the same time, specialized converter companies challenge established players through innovative packaging solutions and cost-effective products targeting specialized consumer segments.
| Item | Value |
|---|---|
| Quantitative Units | USD 3,624 million |
| Product Type | Spiral Wound, Convolute Wound, Telescopic |
| Application | Food & Beverages, Personal Care & Cosmetics, Pharmaceuticals, Chemicals, Others |
| Regions Covered | North America, Europe, Asia Pacific, Latin America, Middle East & Africa |
| Countries Covered | USA, Germany, Japan, India, China, and 25+ additional countries |
| Key Companies Profiled | Sonoco Products Company, Greif Inc., Amcor plc, Smurfit Kappa Group, CCL Industries Inc., Ace Paper Tube |
| Additional Attributes | Dollar sales by product type and application categories, regional adoption trends across North America, Europe, and Asia-Pacific, competitive landscape with packaging manufacturers and brand converters, consumer preferences for recyclability and aesthetic quality, integration with filling automation platforms and design systems, innovations in barrier technology and printing efficiency, and development of premium solutions with enhanced brand presentation and protection capabilities |
The global composite paper cans market is estimated to be valued at USD 3,624.0 million in 2025.
The market size for the composite paper cans market is projected to reach USD 5,903.1 million by 2035.
The composite paper cans market is expected to grow at a 5.0% CAGR between 2025 and 2035.
The key product types in composite paper cans market are spiral wound, convolute wound and telescopic.
In terms of application, food & beverages segment to command 61.0% share in the composite paper cans market in 2025.


Our Research Products

The "Full Research Suite" delivers actionable market intel, deep dives on markets or technologies, so clients act faster, cut risk, and unlock growth.

The Leaderboard benchmarks and ranks top vendors, classifying them as Established Leaders, Leading Challengers, or Disruptors & Challengers.

Locates where complements amplify value and substitutes erode it, forecasting net impact by horizon

We deliver granular, decision-grade intel: market sizing, 5-year forecasts, pricing, adoption, usage, revenue, and operational KPIs—plus competitor tracking, regulation, and value chains—across 60 countries broadly.

Spot the shifts before they hit your P&L. We track inflection points, adoption curves, pricing moves, and ecosystem plays to show where demand is heading, why it is changing, and what to do next across high-growth markets and disruptive tech

Real-time reads of user behavior. We track shifting priorities, perceptions of today’s and next-gen services, and provider experience, then pace how fast tech moves from trial to adoption, blending buyer, consumer, and channel inputs with social signals (#WhySwitch, #UX).

Partner with our analyst team to build a custom report designed around your business priorities. From analysing market trends to assessing competitors or crafting bespoke datasets, we tailor insights to your needs.
Supplier Intelligence
Discovery & Profiling
Capacity & Footprint
Performance & Risk
Compliance & Governance
Commercial Readiness
Who Supplies Whom
Scorecards & Shortlists
Playbooks & Docs
Category Intelligence
Definition & Scope
Demand & Use Cases
Cost Drivers
Market Structure
Supply Chain Map
Trade & Policy
Operating Norms
Deliverables
Buyer Intelligence
Account Basics
Spend & Scope
Procurement Model
Vendor Requirements
Terms & Policies
Entry Strategy
Pain Points & Triggers
Outputs
Pricing Analysis
Benchmarks
Trends
Should-Cost
Indexation
Landed Cost
Commercial Terms
Deliverables
Brand Analysis
Positioning & Value Prop
Share & Presence
Customer Evidence
Go-to-Market
Digital & Reputation
Compliance & Trust
KPIs & Gaps
Outputs
Full Research Suite comprises of:
Market outlook & trends analysis
Interviews & case studies
Strategic recommendations
Vendor profiles & capabilities analysis
5-year forecasts
8 regions and 60+ country-level data splits
Market segment data splits
12 months of continuous data updates
DELIVERED AS:
PDF EXCEL ONLINE
Market Share Breakdown of Composite Paper Cans Manufacturers
Composite Cans Market Size and Share Forecast Outlook 2025 to 2035
Paperboard Partition Market Size and Share Forecast Outlook 2025 to 2035
Paper Box Market Size and Share Forecast Outlook 2025 to 2035
Paper Edge Protector Market Size and Share Forecast Outlook 2025 to 2035
Paper Cup Lids Market Size and Share Forecast Outlook 2025 to 2035
Paper Pallet Market Size and Share Forecast Outlook 2025 to 2035
Paper and Paperboard Packaging Market Forecast and Outlook 2025 to 2035
Composite Resin Market Size and Share Forecast Outlook 2025 to 2035
Composite Pin Insulator Market Size and Share Forecast Outlook 2025 to 2035
Composite Roller Market Size and Share Forecast Outlook 2025 to 2035
Paper Wrap Market Size and Share Forecast Outlook 2025 to 2035
Paper Cups Market Size and Share Forecast Outlook 2025 to 2035
Paper Core Market Size and Share Forecast Outlook 2025 to 2035
Paper Bags Market Size and Share Forecast Outlook 2025 to 2035
Paper Processing Resins Market Size and Share Forecast Outlook 2025 to 2035
Paper Tester Market Size and Share Forecast Outlook 2025 to 2035
Paper Napkin Converting Lines Market Size and Share Forecast Outlook 2025 to 2035
Composite Insulator Market Size and Share Forecast Outlook 2025 to 2035
Paper Packaging Tapes Market Size and Share Forecast Outlook 2025 to 2035

Thank you!
You will receive an email from our Business Development Manager. Please be sure to check your SPAM/JUNK folder too.
Chat With
MaRIA