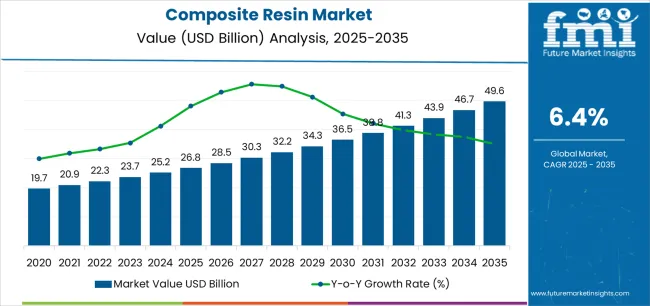
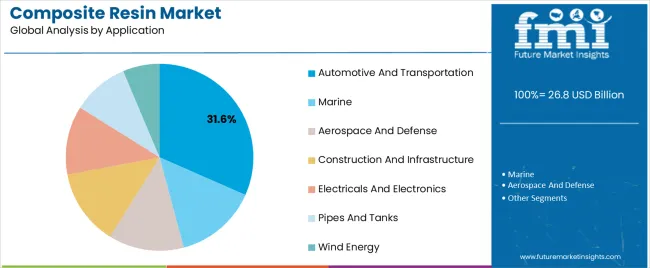
The Composite Resin Market is predicted to be valued at USD 25.1 billion in 2024. This valuation is expected to rise to USD 48 billion by 2034, advancing at a CAGR of 6.7%. The market is witnessing substantial growth driven by its widespread application in the dental, automotive, and construction industries.
These versatile materials, composed of a mixture of polymer and filler particles, offer durability, aesthetic appeal, and resistance to various environmental factors. In dentistry, composite resins are preferred for tooth-colored fillings due to their natural appearance and adhesive properties. In the automotive sector, they enhance lightweight and fuel efficiency. Composite resins contribute to structural integrity and design flexibility in construction.
The market expansion is further fueled by ongoing research and development efforts to improve material properties and explore new applications. As industries prioritize sustainability, composite resins are increasingly adopted for their eco-friendly characteristics, paving the way for continued market growth.
Attributes | Key Insights |
---|---|
Market Estimated Size in 2024 | USD 25.1 billion |
Projected Market Size in 2034 | USD 48 billion |
Value-based CAGR from 2024 to 2034 | 6.7% |
The scope for global composite resin market insights expanded at an 8.4% CAGR between 2019 and 2023. The market is anticipated to develop at a CAGR of 6.7% over the forecast period from 2024 to 2034.
Historical CAGR from 2019 to 2023 | 8.4% |
---|---|
Forecast CAGR from 2024 to 2034 | 6.7% |
Between 2019 and 2023, the global market exhibited robust growth, with an impressive 8.4% CAGR. During this period, the market witnessed significant expansion, reflecting increased adoption across various dental, automotive, and construction industries.
This growth was propelled by composite resins' versatility, durability, aesthetic appeal, and ongoing research and development initiatives enhancing their properties.
From 2024 to 2034, market forecast projections indicate a slightly moderated but still substantial growth trajectory, with a projected CAGR of 6.7%. Despite a marginally slower pace than the previous period, the market is expected to continue evolving, driven by sustained demand in key sectors and advancements in composite resin applications.
Factors such as increased emphasis on sustainability and material eco-friendly characteristics are likely to contribute to the positive outlook of the market during the forecast period.
Attributes | Details |
---|---|
Opportunities |
|
The table emphasizes the CAGRs in five pivotal countries, namely the United States, Japan, China, the United Kingdom, and South Korea.
South Korea emerges as a dynamic and rapidly progressing market, projecting significant growth with a 9% CAGR anticipated by 2034. Renowned for its commitment to innovation, the country plays a crucial role across diverse industries, depicting a flourishing economic landscape marked by continuous development.
The substantial CAGR underscores the proactive stance of the United Kingdom in embracing and steering advancements in the market, solidifying its standing as a key contributor to the global sustainable materials industry. This reflects the dedication to sustainable practices and positions it as a noteworthy player in driving positive global developments within the industry.
Countries | CAGR from 2024 to 2034 |
---|---|
The United States | 7% |
Japan | 8.3% |
China | 7.7% |
The United Kingdom | 8% |
South Korea | 9% |
The automotive and aerospace industries primarily drive the utilization of composite resins in the United States. These sectors leverage composite resins for their lightweight properties, contributing to fuel efficiency and overall performance.
The demand for aesthetically pleasing and durable materials in dental applications further fuels the use of composite resins in the United States.
The market is notably influenced by its thriving electronics and automotive industries. The demand for high-performance materials in electronic components and the emphasis on light weighting in the automotive sector contribute to the widespread use of composite resins. The versatility of the material aligns with the commitment to technological innovation and product development.
The rapid growth of the construction and infrastructure sectors drives the market in China. Composite resins offer structural integrity and design flexibility, making them suitable for various construction applications.
The expansion of the automotive industry and increasing focus on renewable energy contribute to rising demand for composite resins of China.
The United Kingdom stands out for its proactive approach to embracing sustainable materials. Composite resins find extensive use in the United Kingdom due to their eco-friendly characteristics, supporting the commitment to the environmental responsibility of the country.
The construction sector, in particular, adopts composite resins for their durability and versatility in various building applications.
The dedication to innovation across industries fuels the vibrant market for composite resins. The rapid growth is particularly evident in the electronics and automotive sectors, where composite resins are valued for their advanced properties.
The commitment to staying at the forefront of technological advancements contributes to the significant adoption of composite resins in various applications.
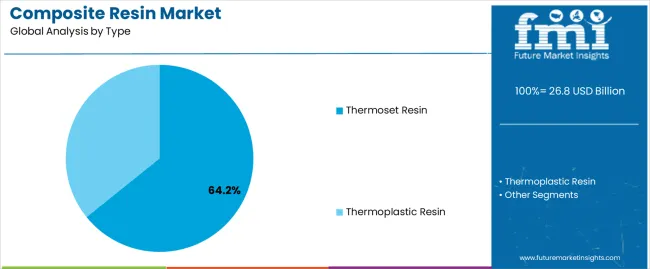
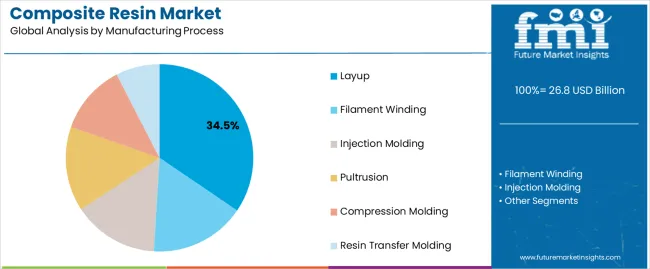
The table below provides an overview of the composite resin landscape on the basis of resin type and manufacturing process. Thermoset resin is projected to lead the resin type of market at a 6.5% CAGR by 2034, while layup in the manufacturing process category is likely to expand at a CAGR of 6.3% by 2034.
The widespread adoption of thermoset resin in the market is propelled by its inherent characteristics, such as high strength, durability, and resistance to heat. The growing preference for the layup manufacturing process is driven by its versatility and cost-effectiveness.
Category | CAGR from 2024 to 2034 |
---|---|
Thermoset Resin | 6.5% |
Layup | 6.3% |
Thermoset resin is anticipated to take the forefront in the resin type category, exhibiting a projected CAGR of 6.5% by 2034. This suggests a sustained and robust demand for thermoset resin-based composite materials, driven by their durability, heat resistance, and versatility across industries.
Layup is expected to showcase noteworthy expansion in the manufacturing process category, with a projected CAGR of 6.3% by 2034. This indicates a growing preference for the layup process in composite resin production, reflecting its efficiency and applicability in creating complex structures.
The data underscores the enduring significance of thermoset resins and the increasing prominence of the layup manufacturing process in shaping the evolving landscape of the market.
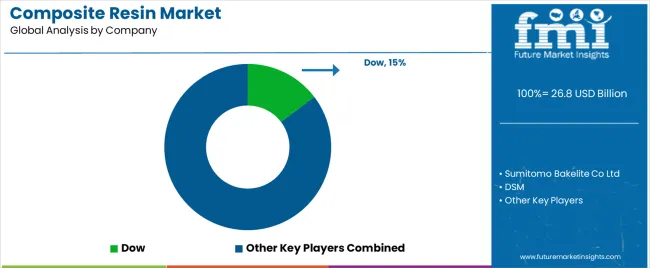
The competitive landscape of the composite resin market is marked by key players vying for market share and influence. Major companies in the industry engage in strategies such as mergers, acquisitions, and partnerships to strengthen their market position.
Innovation in product development, particularly in formulating composite resin solutions for diverse applications, is a focal point for market leaders. These companies emphasize geographic expansion to tap into emerging markets.
The market dynamics also include a mix of established industry giants and emerging players, creating a competitive environment that encourages continuous advancements in technology and materials.
Factors such as research and development initiatives, regulatory compliance, and sustainable practices contribute to the differentiation strategies companies adopt within the market.
Overall, the landscape is dynamic, characterized by a balance of market leaders stability and the agility of emerging players, fostering a competitive atmosphere that drives innovation and market growth.
Some key market developments are as follows
Attributes | Details |
---|---|
Estimated Market Size in 2024 | USD 25.1 billion |
Projected Market Valuation in 2034 | USD 48 billion |
CAGR Share from 2024 to 2034 | 6.7% |
Forecast Period | 2024 to 2034 |
Historical Data Available for | 2019 to 2023 |
Market Analysis | Value in USD billion |
Key Regions Covered | North America; Latin America; Europe; East Asia; South Asia; Oceania; Middle East and Africa |
Key Market Segments Covered | By Resin Type, By Manufacturing, By Application, By Region |
Key Countries Profiled | The United States, Canada, Brazil, Mexico, Argentina, Germany, Italy, France, United Kingdom, Spain, Russia, BENELUX, China, Japan, South Korea, India, Thailand, Malaysia, Indonesia, Australia, New Zealand, GCC |
Key Companies Profiled | Sumitomo Bakelite Co Ltd; Dow; DSM; Hexion Inc; Scott Bader Company Ltd; Huntsman International LLC; Celanese Corporation; Evonik Industries AG; Allnex GmbH; SABIC |
Table 1: Global Market Value (US$ Million) Forecast by Region, 2019 to 2034
Table 2: Global Market Volume (Tons) Forecast by Region, 2019 to 2034
Table 3: Global Market Value (US$ Million) Forecast by Resin Type, 2019 to 2034
Table 4: Global Market Volume (Tons) Forecast by Resin Type, 2019 to 2034
Table 5: Global Market Value (US$ Million) Forecast by Manufacturing Process, 2019 to 2034
Table 6: Global Market Volume (Tons) Forecast by Manufacturing Process, 2019 to 2034
Table 7: Global Market Value (US$ Million) Forecast by Application, 2019 to 2034
Table 8: Global Market Volume (Tons) Forecast by Application, 2019 to 2034
Table 9: North America Market Value (US$ Million) Forecast by Country, 2019 to 2034
Table 10: North America Market Volume (Tons) Forecast by Country, 2019 to 2034
Table 11: North America Market Value (US$ Million) Forecast by Resin Type, 2019 to 2034
Table 12: North America Market Volume (Tons) Forecast by Resin Type, 2019 to 2034
Table 13: North America Market Value (US$ Million) Forecast by Manufacturing Process, 2019 to 2034
Table 14: North America Market Volume (Tons) Forecast by Manufacturing Process, 2019 to 2034
Table 15: North America Market Value (US$ Million) Forecast by Application, 2019 to 2034
Table 16: North America Market Volume (Tons) Forecast by Application, 2019 to 2034
Table 17: Latin America Market Value (US$ Million) Forecast by Country, 2019 to 2034
Table 18: Latin America Market Volume (Tons) Forecast by Country, 2019 to 2034
Table 19: Latin America Market Value (US$ Million) Forecast by Resin Type, 2019 to 2034
Table 20: Latin America Market Volume (Tons) Forecast by Resin Type, 2019 to 2034
Table 21: Latin America Market Value (US$ Million) Forecast by Manufacturing Process, 2019 to 2034
Table 22: Latin America Market Volume (Tons) Forecast by Manufacturing Process, 2019 to 2034
Table 23: Latin America Market Value (US$ Million) Forecast by Application, 2019 to 2034
Table 24: Latin America Market Volume (Tons) Forecast by Application, 2019 to 2034
Table 25: Europe Market Value (US$ Million) Forecast by Country, 2019 to 2034
Table 26: Europe Market Volume (Tons) Forecast by Country, 2019 to 2034
Table 27: Europe Market Value (US$ Million) Forecast by Resin Type, 2019 to 2034
Table 28: Europe Market Volume (Tons) Forecast by Resin Type, 2019 to 2034
Table 29: Europe Market Value (US$ Million) Forecast by Manufacturing Process, 2019 to 2034
Table 30: Europe Market Volume (Tons) Forecast by Manufacturing Process, 2019 to 2034
Table 31: Europe Market Value (US$ Million) Forecast by Application, 2019 to 2034
Table 32: Europe Market Volume (Tons) Forecast by Application, 2019 to 2034
Table 33: East Asia Market Value (US$ Million) Forecast by Country, 2019 to 2034
Table 34: East Asia Market Volume (Tons) Forecast by Country, 2019 to 2034
Table 35: East Asia Market Value (US$ Million) Forecast by Resin Type, 2019 to 2034
Table 36: East Asia Market Volume (Tons) Forecast by Resin Type, 2019 to 2034
Table 37: East Asia Market Value (US$ Million) Forecast by Manufacturing Process, 2019 to 2034
Table 38: East Asia Market Volume (Tons) Forecast by Manufacturing Process, 2019 to 2034
Table 39: East Asia Market Value (US$ Million) Forecast by Application, 2019 to 2034
Table 40: East Asia Market Volume (Tons) Forecast by Application, 2019 to 2034
Table 41: South Asia Market Value (US$ Million) Forecast by Country, 2019 to 2034
Table 42: South Asia Market Volume (Tons) Forecast by Country, 2019 to 2034
Table 43: South Asia Market Value (US$ Million) Forecast by Resin Type, 2019 to 2034
Table 44: South Asia Market Volume (Tons) Forecast by Resin Type, 2019 to 2034
Table 45: South Asia Market Value (US$ Million) Forecast by Manufacturing Process, 2019 to 2034
Table 46: South Asia Market Volume (Tons) Forecast by Manufacturing Process, 2019 to 2034
Table 47: South Asia Market Value (US$ Million) Forecast by Application, 2019 to 2034
Table 48: South Asia Market Volume (Tons) Forecast by Application, 2019 to 2034
Table 49: Oceania Market Value (US$ Million) Forecast by Country, 2019 to 2034
Table 50: Oceania Market Volume (Tons) Forecast by Country, 2019 to 2034
Table 51: Oceania Market Value (US$ Million) Forecast by Resin Type, 2019 to 2034
Table 52: Oceania Market Volume (Tons) Forecast by Resin Type, 2019 to 2034
Table 53: Oceania Market Value (US$ Million) Forecast by Manufacturing Process, 2019 to 2034
Table 54: Oceania Market Volume (Tons) Forecast by Manufacturing Process, 2019 to 2034
Table 55: Oceania Market Value (US$ Million) Forecast by Application, 2019 to 2034
Table 56: Oceania Market Volume (Tons) Forecast by Application, 2019 to 2034
Table 57: MEA Market Value (US$ Million) Forecast by Country, 2019 to 2034
Table 58: MEA Market Volume (Tons) Forecast by Country, 2019 to 2034
Table 59: MEA Market Value (US$ Million) Forecast by Resin Type, 2019 to 2034
Table 60: MEA Market Volume (Tons) Forecast by Resin Type, 2019 to 2034
Table 61: MEA Market Value (US$ Million) Forecast by Manufacturing Process, 2019 to 2034
Table 62: MEA Market Volume (Tons) Forecast by Manufacturing Process, 2019 to 2034
Table 63: MEA Market Value (US$ Million) Forecast by Application, 2019 to 2034
Table 64: MEA Market Volume (Tons) Forecast by Application, 2019 to 2034
Figure 1: Global Market Value (US$ Million) by Resin Type, 2024 to 2034
Figure 2: Global Market Value (US$ Million) by Manufacturing Process, 2024 to 2034
Figure 3: Global Market Value (US$ Million) by Application, 2024 to 2034
Figure 4: Global Market Value (US$ Million) by Region, 2024 to 2034
Figure 5: Global Market Value (US$ Million) Analysis by Region, 2019 to 2034
Figure 6: Global Market Volume (Tons) Analysis by Region, 2019 to 2034
Figure 7: Global Market Value Share (%) and BPS Analysis by Region, 2024 to 2034
Figure 8: Global Market Y-o-Y Growth (%) Projections by Region, 2024 to 2034
Figure 9: Global Market Value (US$ Million) Analysis by Resin Type, 2019 to 2034
Figure 10: Global Market Volume (Tons) Analysis by Resin Type, 2019 to 2034
Figure 11: Global Market Value Share (%) and BPS Analysis by Resin Type, 2024 to 2034
Figure 12: Global Market Y-o-Y Growth (%) Projections by Resin Type, 2024 to 2034
Figure 13: Global Market Value (US$ Million) Analysis by Manufacturing Process, 2019 to 2034
Figure 14: Global Market Volume (Tons) Analysis by Manufacturing Process, 2019 to 2034
Figure 15: Global Market Value Share (%) and BPS Analysis by Manufacturing Process, 2024 to 2034
Figure 16: Global Market Y-o-Y Growth (%) Projections by Manufacturing Process, 2024 to 2034
Figure 17: Global Market Value (US$ Million) Analysis by Application, 2019 to 2034
Figure 18: Global Market Volume (Tons) Analysis by Application, 2019 to 2034
Figure 19: Global Market Value Share (%) and BPS Analysis by Application, 2024 to 2034
Figure 20: Global Market Y-o-Y Growth (%) Projections by Application, 2024 to 2034
Figure 21: Global Market Attractiveness by Resin Type, 2024 to 2034
Figure 22: Global Market Attractiveness by Manufacturing Process, 2024 to 2034
Figure 23: Global Market Attractiveness by Application, 2024 to 2034
Figure 24: Global Market Attractiveness by Region, 2024 to 2034
Figure 25: North America Market Value (US$ Million) by Resin Type, 2024 to 2034
Figure 26: North America Market Value (US$ Million) by Manufacturing Process, 2024 to 2034
Figure 27: North America Market Value (US$ Million) by Application, 2024 to 2034
Figure 28: North America Market Value (US$ Million) by Country, 2024 to 2034
Figure 29: North America Market Value (US$ Million) Analysis by Country, 2019 to 2034
Figure 30: North America Market Volume (Tons) Analysis by Country, 2019 to 2034
Figure 31: North America Market Value Share (%) and BPS Analysis by Country, 2024 to 2034
Figure 32: North America Market Y-o-Y Growth (%) Projections by Country, 2024 to 2034
Figure 33: North America Market Value (US$ Million) Analysis by Resin Type, 2019 to 2034
Figure 34: North America Market Volume (Tons) Analysis by Resin Type, 2019 to 2034
Figure 35: North America Market Value Share (%) and BPS Analysis by Resin Type, 2024 to 2034
Figure 36: North America Market Y-o-Y Growth (%) Projections by Resin Type, 2024 to 2034
Figure 37: North America Market Value (US$ Million) Analysis by Manufacturing Process, 2019 to 2034
Figure 38: North America Market Volume (Tons) Analysis by Manufacturing Process, 2019 to 2034
Figure 39: North America Market Value Share (%) and BPS Analysis by Manufacturing Process, 2024 to 2034
Figure 40: North America Market Y-o-Y Growth (%) Projections by Manufacturing Process, 2024 to 2034
Figure 41: North America Market Value (US$ Million) Analysis by Application, 2019 to 2034
Figure 42: North America Market Volume (Tons) Analysis by Application, 2019 to 2034
Figure 43: North America Market Value Share (%) and BPS Analysis by Application, 2024 to 2034
Figure 44: North America Market Y-o-Y Growth (%) Projections by Application, 2024 to 2034
Figure 45: North America Market Attractiveness by Resin Type, 2024 to 2034
Figure 46: North America Market Attractiveness by Manufacturing Process, 2024 to 2034
Figure 47: North America Market Attractiveness by Application, 2024 to 2034
Figure 48: North America Market Attractiveness by Country, 2024 to 2034
Figure 49: Latin America Market Value (US$ Million) by Resin Type, 2024 to 2034
Figure 50: Latin America Market Value (US$ Million) by Manufacturing Process, 2024 to 2034
Figure 51: Latin America Market Value (US$ Million) by Application, 2024 to 2034
Figure 52: Latin America Market Value (US$ Million) by Country, 2024 to 2034
Figure 53: Latin America Market Value (US$ Million) Analysis by Country, 2019 to 2034
Figure 54: Latin America Market Volume (Tons) Analysis by Country, 2019 to 2034
Figure 55: Latin America Market Value Share (%) and BPS Analysis by Country, 2024 to 2034
Figure 56: Latin America Market Y-o-Y Growth (%) Projections by Country, 2024 to 2034
Figure 57: Latin America Market Value (US$ Million) Analysis by Resin Type, 2019 to 2034
Figure 58: Latin America Market Volume (Tons) Analysis by Resin Type, 2019 to 2034
Figure 59: Latin America Market Value Share (%) and BPS Analysis by Resin Type, 2024 to 2034
Figure 60: Latin America Market Y-o-Y Growth (%) Projections by Resin Type, 2024 to 2034
Figure 61: Latin America Market Value (US$ Million) Analysis by Manufacturing Process, 2019 to 2034
Figure 62: Latin America Market Volume (Tons) Analysis by Manufacturing Process, 2019 to 2034
Figure 63: Latin America Market Value Share (%) and BPS Analysis by Manufacturing Process, 2024 to 2034
Figure 64: Latin America Market Y-o-Y Growth (%) Projections by Manufacturing Process, 2024 to 2034
Figure 65: Latin America Market Value (US$ Million) Analysis by Application, 2019 to 2034
Figure 66: Latin America Market Volume (Tons) Analysis by Application, 2019 to 2034
Figure 67: Latin America Market Value Share (%) and BPS Analysis by Application, 2024 to 2034
Figure 68: Latin America Market Y-o-Y Growth (%) Projections by Application, 2024 to 2034
Figure 69: Latin America Market Attractiveness by Resin Type, 2024 to 2034
Figure 70: Latin America Market Attractiveness by Manufacturing Process, 2024 to 2034
Figure 71: Latin America Market Attractiveness by Application, 2024 to 2034
Figure 72: Latin America Market Attractiveness by Country, 2024 to 2034
Figure 73: Europe Market Value (US$ Million) by Resin Type, 2024 to 2034
Figure 74: Europe Market Value (US$ Million) by Manufacturing Process, 2024 to 2034
Figure 75: Europe Market Value (US$ Million) by Application, 2024 to 2034
Figure 76: Europe Market Value (US$ Million) by Country, 2024 to 2034
Figure 77: Europe Market Value (US$ Million) Analysis by Country, 2019 to 2034
Figure 78: Europe Market Volume (Tons) Analysis by Country, 2019 to 2034
Figure 79: Europe Market Value Share (%) and BPS Analysis by Country, 2024 to 2034
Figure 80: Europe Market Y-o-Y Growth (%) Projections by Country, 2024 to 2034
Figure 81: Europe Market Value (US$ Million) Analysis by Resin Type, 2019 to 2034
Figure 82: Europe Market Volume (Tons) Analysis by Resin Type, 2019 to 2034
Figure 83: Europe Market Value Share (%) and BPS Analysis by Resin Type, 2024 to 2034
Figure 84: Europe Market Y-o-Y Growth (%) Projections by Resin Type, 2024 to 2034
Figure 85: Europe Market Value (US$ Million) Analysis by Manufacturing Process, 2019 to 2034
Figure 86: Europe Market Volume (Tons) Analysis by Manufacturing Process, 2019 to 2034
Figure 87: Europe Market Value Share (%) and BPS Analysis by Manufacturing Process, 2024 to 2034
Figure 88: Europe Market Y-o-Y Growth (%) Projections by Manufacturing Process, 2024 to 2034
Figure 89: Europe Market Value (US$ Million) Analysis by Application, 2019 to 2034
Figure 90: Europe Market Volume (Tons) Analysis by Application, 2019 to 2034
Figure 91: Europe Market Value Share (%) and BPS Analysis by Application, 2024 to 2034
Figure 92: Europe Market Y-o-Y Growth (%) Projections by Application, 2024 to 2034
Figure 93: Europe Market Attractiveness by Resin Type, 2024 to 2034
Figure 94: Europe Market Attractiveness by Manufacturing Process, 2024 to 2034
Figure 95: Europe Market Attractiveness by Application, 2024 to 2034
Figure 96: Europe Market Attractiveness by Country, 2024 to 2034
Figure 97: East Asia Market Value (US$ Million) by Resin Type, 2024 to 2034
Figure 98: East Asia Market Value (US$ Million) by Manufacturing Process, 2024 to 2034
Figure 99: East Asia Market Value (US$ Million) by Application, 2024 to 2034
Figure 100: East Asia Market Value (US$ Million) by Country, 2024 to 2034
Figure 101: East Asia Market Value (US$ Million) Analysis by Country, 2019 to 2034
Figure 102: East Asia Market Volume (Tons) Analysis by Country, 2019 to 2034
Figure 103: East Asia Market Value Share (%) and BPS Analysis by Country, 2024 to 2034
Figure 104: East Asia Market Y-o-Y Growth (%) Projections by Country, 2024 to 2034
Figure 105: East Asia Market Value (US$ Million) Analysis by Resin Type, 2019 to 2034
Figure 106: East Asia Market Volume (Tons) Analysis by Resin Type, 2019 to 2034
Figure 107: East Asia Market Value Share (%) and BPS Analysis by Resin Type, 2024 to 2034
Figure 108: East Asia Market Y-o-Y Growth (%) Projections by Resin Type, 2024 to 2034
Figure 109: East Asia Market Value (US$ Million) Analysis by Manufacturing Process, 2019 to 2034
Figure 110: East Asia Market Volume (Tons) Analysis by Manufacturing Process, 2019 to 2034
Figure 111: East Asia Market Value Share (%) and BPS Analysis by Manufacturing Process, 2024 to 2034
Figure 112: East Asia Market Y-o-Y Growth (%) Projections by Manufacturing Process, 2024 to 2034
Figure 113: East Asia Market Value (US$ Million) Analysis by Application, 2019 to 2034
Figure 114: East Asia Market Volume (Tons) Analysis by Application, 2019 to 2034
Figure 115: East Asia Market Value Share (%) and BPS Analysis by Application, 2024 to 2034
Figure 116: East Asia Market Y-o-Y Growth (%) Projections by Application, 2024 to 2034
Figure 117: East Asia Market Attractiveness by Resin Type, 2024 to 2034
Figure 118: East Asia Market Attractiveness by Manufacturing Process, 2024 to 2034
Figure 119: East Asia Market Attractiveness by Application, 2024 to 2034
Figure 120: East Asia Market Attractiveness by Country, 2024 to 2034
Figure 121: South Asia Market Value (US$ Million) by Resin Type, 2024 to 2034
Figure 122: South Asia Market Value (US$ Million) by Manufacturing Process, 2024 to 2034
Figure 123: South Asia Market Value (US$ Million) by Application, 2024 to 2034
Figure 124: South Asia Market Value (US$ Million) by Country, 2024 to 2034
Figure 125: South Asia Market Value (US$ Million) Analysis by Country, 2019 to 2034
Figure 126: South Asia Market Volume (Tons) Analysis by Country, 2019 to 2034
Figure 127: South Asia Market Value Share (%) and BPS Analysis by Country, 2024 to 2034
Figure 128: South Asia Market Y-o-Y Growth (%) Projections by Country, 2024 to 2034
Figure 129: South Asia Market Value (US$ Million) Analysis by Resin Type, 2019 to 2034
Figure 130: South Asia Market Volume (Tons) Analysis by Resin Type, 2019 to 2034
Figure 131: South Asia Market Value Share (%) and BPS Analysis by Resin Type, 2024 to 2034
Figure 132: South Asia Market Y-o-Y Growth (%) Projections by Resin Type, 2024 to 2034
Figure 133: South Asia Market Value (US$ Million) Analysis by Manufacturing Process, 2019 to 2034
Figure 134: South Asia Market Volume (Tons) Analysis by Manufacturing Process, 2019 to 2034
Figure 135: South Asia Market Value Share (%) and BPS Analysis by Manufacturing Process, 2024 to 2034
Figure 136: South Asia Market Y-o-Y Growth (%) Projections by Manufacturing Process, 2024 to 2034
Figure 137: South Asia Market Value (US$ Million) Analysis by Application, 2019 to 2034
Figure 138: South Asia Market Volume (Tons) Analysis by Application, 2019 to 2034
Figure 139: South Asia Market Value Share (%) and BPS Analysis by Application, 2024 to 2034
Figure 140: South Asia Market Y-o-Y Growth (%) Projections by Application, 2024 to 2034
Figure 141: South Asia Market Attractiveness by Resin Type, 2024 to 2034
Figure 142: South Asia Market Attractiveness by Manufacturing Process, 2024 to 2034
Figure 143: South Asia Market Attractiveness by Application, 2024 to 2034
Figure 144: South Asia Market Attractiveness by Country, 2024 to 2034
Figure 145: Oceania Market Value (US$ Million) by Resin Type, 2024 to 2034
Figure 146: Oceania Market Value (US$ Million) by Manufacturing Process, 2024 to 2034
Figure 147: Oceania Market Value (US$ Million) by Application, 2024 to 2034
Figure 148: Oceania Market Value (US$ Million) by Country, 2024 to 2034
Figure 149: Oceania Market Value (US$ Million) Analysis by Country, 2019 to 2034
Figure 150: Oceania Market Volume (Tons) Analysis by Country, 2019 to 2034
Figure 151: Oceania Market Value Share (%) and BPS Analysis by Country, 2024 to 2034
Figure 152: Oceania Market Y-o-Y Growth (%) Projections by Country, 2024 to 2034
Figure 153: Oceania Market Value (US$ Million) Analysis by Resin Type, 2019 to 2034
Figure 154: Oceania Market Volume (Tons) Analysis by Resin Type, 2019 to 2034
Figure 155: Oceania Market Value Share (%) and BPS Analysis by Resin Type, 2024 to 2034
Figure 156: Oceania Market Y-o-Y Growth (%) Projections by Resin Type, 2024 to 2034
Figure 157: Oceania Market Value (US$ Million) Analysis by Manufacturing Process, 2019 to 2034
Figure 158: Oceania Market Volume (Tons) Analysis by Manufacturing Process, 2019 to 2034
Figure 159: Oceania Market Value Share (%) and BPS Analysis by Manufacturing Process, 2024 to 2034
Figure 160: Oceania Market Y-o-Y Growth (%) Projections by Manufacturing Process, 2024 to 2034
Figure 161: Oceania Market Value (US$ Million) Analysis by Application, 2019 to 2034
Figure 162: Oceania Market Volume (Tons) Analysis by Application, 2019 to 2034
Figure 163: Oceania Market Value Share (%) and BPS Analysis by Application, 2024 to 2034
Figure 164: Oceania Market Y-o-Y Growth (%) Projections by Application, 2024 to 2034
Figure 165: Oceania Market Attractiveness by Resin Type, 2024 to 2034
Figure 166: Oceania Market Attractiveness by Manufacturing Process, 2024 to 2034
Figure 167: Oceania Market Attractiveness by Application, 2024 to 2034
Figure 168: Oceania Market Attractiveness by Country, 2024 to 2034
Figure 169: MEA Market Value (US$ Million) by Resin Type, 2024 to 2034
Figure 170: MEA Market Value (US$ Million) by Manufacturing Process, 2024 to 2034
Figure 171: MEA Market Value (US$ Million) by Application, 2024 to 2034
Figure 172: MEA Market Value (US$ Million) by Country, 2024 to 2034
Figure 173: MEA Market Value (US$ Million) Analysis by Country, 2019 to 2034
Figure 174: MEA Market Volume (Tons) Analysis by Country, 2019 to 2034
Figure 175: MEA Market Value Share (%) and BPS Analysis by Country, 2024 to 2034
Figure 176: MEA Market Y-o-Y Growth (%) Projections by Country, 2024 to 2034
Figure 177: MEA Market Value (US$ Million) Analysis by Resin Type, 2019 to 2034
Figure 178: MEA Market Volume (Tons) Analysis by Resin Type, 2019 to 2034
Figure 179: MEA Market Value Share (%) and BPS Analysis by Resin Type, 2024 to 2034
Figure 180: MEA Market Y-o-Y Growth (%) Projections by Resin Type, 2024 to 2034
Figure 181: MEA Market Value (US$ Million) Analysis by Manufacturing Process, 2019 to 2034
Figure 182: MEA Market Volume (Tons) Analysis by Manufacturing Process, 2019 to 2034
Figure 183: MEA Market Value Share (%) and BPS Analysis by Manufacturing Process, 2024 to 2034
Figure 184: MEA Market Y-o-Y Growth (%) Projections by Manufacturing Process, 2024 to 2034
Figure 185: MEA Market Value (US$ Million) Analysis by Application, 2019 to 2034
Figure 186: MEA Market Volume (Tons) Analysis by Application, 2019 to 2034
Figure 187: MEA Market Value Share (%) and BPS Analysis by Application, 2024 to 2034
Figure 188: MEA Market Y-o-Y Growth (%) Projections by Application, 2024 to 2034
Figure 189: MEA Market Attractiveness by Resin Type, 2024 to 2034
Figure 190: MEA Market Attractiveness by Manufacturing Process, 2024 to 2034
Figure 191: MEA Market Attractiveness by Application, 2024 to 2034
Figure 192: MEA Market Attractiveness by Country, 2024 to 2034
By 2024, the composite resin landscape is estimated to be valued at USD 25.1 billion.
The composite resin market is projected to flourish at a CAGR of 6.7% from 2024 to 2034.
By 2034, the composite resin market will generate USD 48 billion in value terms.
The thermoset resin type is anticipated to expand at 6.5% CAGR by 2034.
With a CAGR of 9%, South Korea is expected to dominate the market for composite resins.
Explore Polymers & Plastics Insights
Thank you!
You will receive an email from our Business Development Manager. Please be sure to check your SPAM/JUNK folder too.