Contact Center Analytics Market Size and Share Forecast Outlook (2022 to 2032)

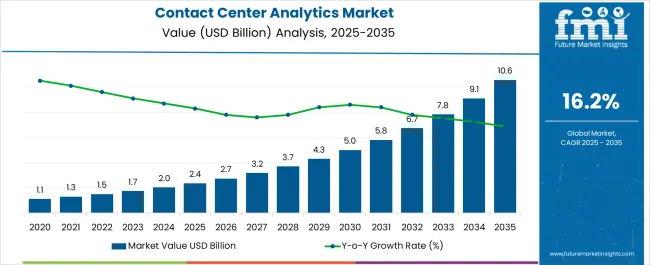
Newly-released Contact Center Analytics Market analysis report by Future Market Insights shows that global sales of the Contact Center Analytics Market in 2021 were held at USD 1.2 Billion.

With 16.2%, the projected market growth from 2022 to 2032 is expected to be slightly higher than the historical growth. BFSI is expected to be the highest revenue-generating segment, projected to grow at a CAGR of over 16% from 2022 to 2032.

Attributes Details
Contact Center Analytics Market Size (2022) USD 1.5 Billion
Contact Center Analytics Market Size (2032) USD 6.5 Billion
Contact Center Analytics Market CAGR (2022 to 2032) 16.2%
USA Market CAGR (2022 to 2032) 14.9%
Key Companies Covered Oracle Corp; SAP SE; Verint Systems Inc; Mitel Networks Corp; Nice Ltd.; Genesys Telecommunications Laboratories, Inc.; Five9, Inc.; 8x8, Inc.; CallMiner; Servion Global Solutions; EdgeVerve Limited

Comparison of Revenue (2017 to 2021) vs Demand Outlook for 2022 to 2032

As per the Global Contact Center Analytics Market research by Future Market Insights - a market research and competitive intelligence provider, historically, from 2017 to 2021, the market value of the Contact Center Analytics Market increased at around 19.1% CAGR. With an absolute dollar opportunity of USD 5 Billion, the market is projected to reach a valuation of USD 6.5 Billion by 2032.

The benefits it offers, including improved service quality and the ability to measure service indicators from worker performance, call wait times, customer satisfaction, and efficiency, can be ascribed to the contact centers' growing need for analytics.

The increasing use of social media platforms is one of the key factors fuelling the demand for contact center analytics. Customer feedback given on social media platforms such as articles, blogs, and forums is analyzed using contact center analytics tools. Owing to this, businesses may review social media data in real time.

This creates a competitive advantage and enhances business operations. Additionally, it helps businesses understand user comments, particularly those made on social media in slang, jargon, and acronyms. It is projected that these factors will boost business demand for contact center analytics.

It is projected that the growing demand for artificial intelligence-powered contact center solutions would create new opportunities for market growth. The ability of these solutions to provide actionable data cut operating costs, customize the customer experience, and increase customer agent efficiency, is projected to be the driving force for contact center analytics demand.

Key Drivers Supporting Contact Center Analytics Market Growth

To manage outgoing, inbound, and blended calls, web inquiries, chats, emails, and web inquiries, businesses equip their contact centers with strong analytics and software-based telephony technologies, such as APIs, ACDs, dialers, CTI, and Voice over Internet Protocol.

Advanced analytics tools are also used, including VoIP, ACDs, APIs, dialers and VoIP, CTI, real-time monitoring and analytics, social media analytics, and data and speech analytics.

Through instantaneous client preference adaptation, these technologies enable organizations to provide a better, more consistent experience. By enabling contact centers to communicate with their clients over computers, software-based telephony solutions do away with the need for a conventional phone infrastructure.

These tools provide features such as analysis of the interaction between customers and agents, real-time monitoring for the purpose of providing tailored responses, as well as video enablement for face-to-face video calls, advanced analytics technologies benefit modern contact centers.

These tools include customer analytics, text analytics, predictive analytics, and performance analytics. In the Cisco Contact Center Global Survey 2020, more than 80% of participants indicated that they preferred the incorporation of bots, data analytics, and AI robotic automation in contact center systems.

Contact center analytics solutions are widely employed in the IT and telecom sectors due to their strong business process automation capabilities. These systems also give IT and telecom personnel the ability to manage all phases of a service request and deal with all incoming client communications.

These solutions also offer a number of benefits, including improved client happiness, decreased operating expenses, and corporate intelligence. These technologies are also used by IT and telecom companies to identify the factors influencing the experiences of their clients.

Challenges Limiting Growth in the Contact Center Analytics Industry

Contact centers always encounter substantial issues with regard to data privacy and security due to the massive volume of sensitive customer data they store. Businesses were forced to respond with technologies created to identify suspicious calls in 2020 as a result of an alarming increase in call center fraud efforts.

According to the 2021 State of Call Center Authentication survey, 57% of respondents preferred a thorough identification process before accepting calls.

Call validation becomes essential in light of security concerns. Customers may become irritated as a result, which could harm their overall satisfaction. IVAs, also known as intelligent IVRs, are being created to address this issue and provide several levels of security for user authentication.

Future privacy and security concerns can be reduced by offering options for choosing trustworthy and privacy-compliant contact center solution providers.

The majority of firms, especially small and medium-sized businesses, with limited resources, find it difficult to install analytics solutions and provide financing for a specialized analytics workforce as the initial setup cost for analytics solutions can be significant.

Smaller businesses are also constrained in their adoption of reliable PRI phone systems as they cannot afford the high implementation and upgrade expenses, pricey monthly phone services, and participation of long-term contracts with traditional telecom carriers for local and long-distance calling.

The viability of cloud-based analytics solutions for organizations with constrained resources will rely on the organization's business model and level of cloud readiness.

Regional Insights in the Analytics-Driven Customer Support Market

Which Region is projected to Offer the Largest Contact Center Analytics Market Opportunity?

During the projection period, the Contact Center Analytics Market in North America is projected to lead throughout the analysis period. A large number of existing and upcoming contact centers in the region are the primary factors driving the regional contact center analytics market.
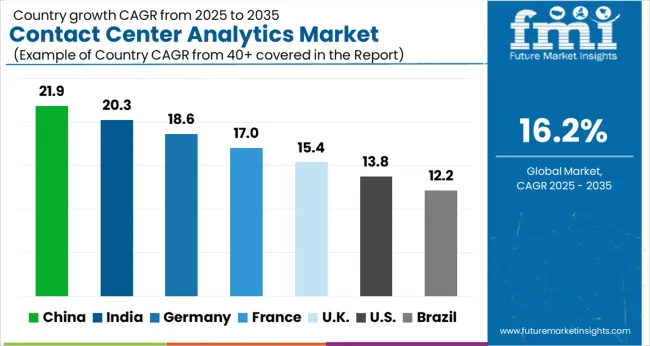
Country-wise Analysis in the Contact Center Analytics Sector

Which Country Lies at the Centerstage for Contact Center Analytics Market Revenue?

The USA is expected to account for the highest market of USD 2 Billion by the end of 2032. Also, the market in the country is projected to account for an absolute dollar growth of USD 1.5 Billion. According to a government assessment, the federal government's budget for civilian IT in 2019 was USD 45 Billion.

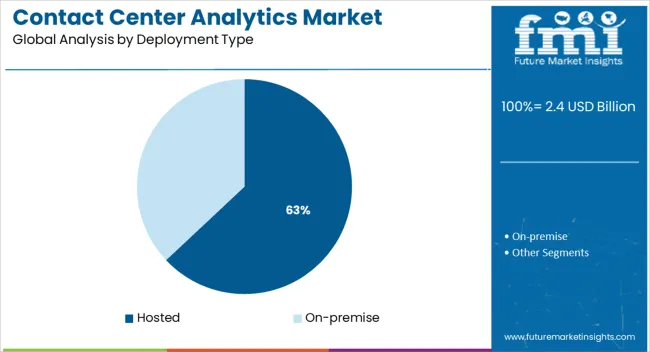
The USA businesses are embracing hosted unified communication-as-a-service, which are managed by independent contractors using subscription-based packages that enable customers to purchase U.C. licenses and activate them as required.

Additionally, the cost-effective services and quicker product development cycles offered by smaller providers may be advantageous to SMEs. Due to this, there is an increase in demand for cloud-based services which is also influencing the demand for Contact Center Analytics Market.

Category-wise Insights in the Contact Center Analytics Market

Why BFSI is projected to Witness the Fastest Growth among Contact Center Analytics End Use?

Market revenue through BFSI is forecasted to grow at a CAGR of over 16.0% from 2022 to 2032. The market expansion may be connected to the increasing need for contact centers among banks, financial institutions, credit unions, and other organizations to improve their customer experience.

According to Deloitte, a significant portion nearly 26% of all contact centers used globally in 2019 were used for financial services. The two benefits that contact center analytics offers to BFSI businesses are reduced operational costs and greater call center volumes are the key growth drivers.

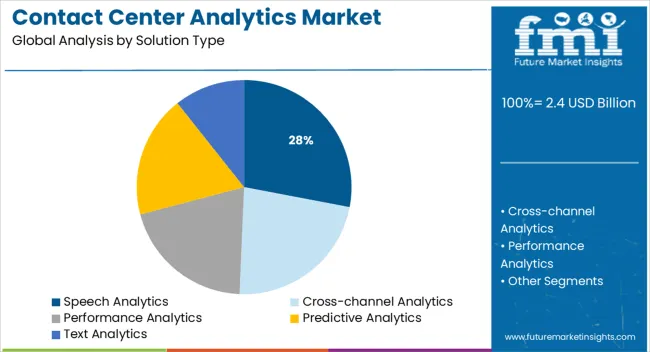
The market is estimated to expand over the course of the projected period as a result of the BFSI organizations' rising demand for speech analytics. Speech analytics helps banks prevent customer churn by analyzing and monitoring client interactions.

Owing to their advantages, speech analytics is being used by several banks to enhance the client experience. For instance, in November 2020, the provider of speech analytics solutions CallMiner stated that African Bank had selected the CallMiner Eureka platform to collect data from voice-based client engagements. This project has helped the bank to boost its digital transformation activities.
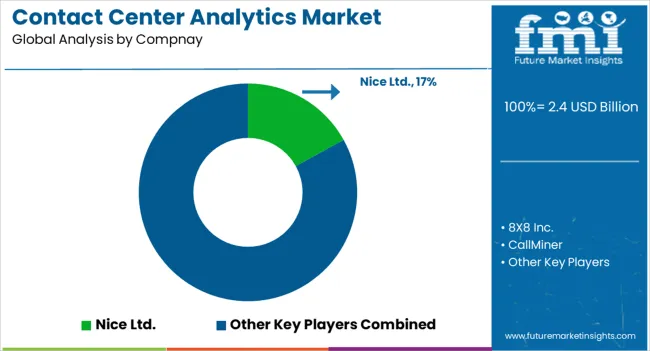
Competitive Landscape of the Contact Center Analytics Market

Players in the market are constantly developing improved analytical solutions as well as extending their product offerings. The companies in Contact Center Analytics market are focused on alliances, technology collaborations, and product launch strategies.

Some of the recent developments of key Contact Center Analytics providers are as follows:

  • In January 2020, Microsoft announced its partnership with Genesys. After working together, the companies intended to launch Genesys Engage for Azure, a cloud service that would give contact centers a unified customer experience solution. Businesses will benefit from the new omnichannel customer experience solution by having a smoother shopping experience.
  • In October 2019, Cisco bought Cloud Cherry with success by utilizing the potential of cloud data analytics to enhance real-time client interaction.

Similarly, recent developments related to companies in Contact Center Analytics Market have been tracked by the team at Future Market Insights, which are available in the full report.

Top Segments Studied in the Contact Center Analytics Market

By Solution:

  • Cross-channel Analytics
  • Performance Analytics
  • Predictive Analytics
  • Speech Analytics
  • Text Analytics

By Service:

  • Integration & Deployment
  • Support & Maintenance
  • Training & Consulting
  • Managed Services

By Deployment:

  • Hosted
  • On-premise

By Enterprise Size:

  • Large Enterprises
  • Small & Medium Enterprises

By Application:

  • Automatic Call Distributor
  • Customer Experience Management
  • Log Management
  • Real-time Monitoring & Reporting
  • Risk & Compliance Management
  • Workforce Optimization
  • Others

By End Use:

  • BFSI
  • Consumer Goods & Retail
  • Healthcare
  • IT & Telecom
  • Travel & Hospitality
  • Others

By Region:

  • North America
  • Latin America
  • Europe
  • Asia-Pacific (APAC)
  • Middle East and Africa (MEA)

Table of Content

  • 1. Executive Summary 
  • 2. Market Overview
  • 3. Market Background
  • 4. Global Market Analysis 2017 to 2021 and Forecast, 2022 to 2032
  • 5. Global Market Analysis 2017 to 2021 and Forecast 2022 to 2032, By Solution
    • 5.1. Cross-channel Analytics
    • 5.2. Performance Analytics
    • 5.3. Predictive Analytics
    • 5.4. Speech Analytics
    • 5.5. Text Analytics
  • 6. Global Market Analysis 2017 to 2021 and Forecast 2022 to 2032, By Service
    • 6.1. Integration & Deployment
    • 6.2. Support & Maintenance
    • 6.3. Training & Consulting
    • 6.4. Managed Services
  • 7. Global Market Analysis 2017 to 2021 and Forecast 2022 to 2032, By Deployment
    • 7.1. Hosted
    • 7.2. On-premise
  • 8. Global Market Analysis 2017 to 2021 and Forecast 2022 to 2032, By Enterprise Size
    • 8.1. Large Enterprises
    • 8.2. Small & Medium Enterprises
  • 9. Global Market Analysis 2017 to 2021 and Forecast 2022 to 2032, By Application
    • 9.1. Automatic Call Distributor
    • 9.2. Customer Experience Management
    • 9.3. Log Management
    • 9.4. Real-time Monitoring & Reporting
    • 9.5. Risk & Compliance Management
    • 9.6. Workforce Optimization
    • 9.7. Others
  • 10. Global Market Analysis 2017 to 2021 and Forecast 2022 to 2032, By End Use
    • 10.1. BFSI
    • 10.2. Consumer Goods & Retail
    • 10.3. Government
    • 10.4. Healthcare
    • 10.5. IT & Telecom
    • 10.6. Travel & Hospitality
    • 10.7. Others
  • 11. Global Market Analysis 2017 to 2021 and Forecast 2022 to 2032, By Region
    • 11.1. North America
    • 11.2. Latin America
    • 11.3. Europe
    • 11.4. Asia Pacific
    • 11.5. Middle East and Africa (MEA)
  • 12. North America Market Analysis 2017 to 2021 and Forecast 2022 to 2032, By Country
  • 13. Latin America Market Analysis 2017 to 2021 and Forecast 2022 to 2032, By Country
  • 14. Europe Market Analysis 2017 to 2021 and Forecast 2022 to 2032, By Country
  • 15. Asia Pacific Market Analysis 2017 to 2021 and Forecast 2022 to 2032, By Country
  • 16. MEA Market Analysis 2017 to 2021 and Forecast 2022 to 2032, By Country
  • 17. Key Countries Market Analysis
  • 18. Market Structure Analysis
  • 19. Competition Analysis
    • 19.1. 8X8 Inc.
    • 19.2. CallMiner
    • 19.3. Cisco Systems, Inc.
    • 19.4. Enghouse Interactive
    • 19.5. Five9, Inc.
    • 19.6. Genesys
    • 19.7. Genpact Ltd.
    • 19.8. Mitel Networks Corp.
    • 19.9. Nice Ltd.
    • 19.10. Oracle Corp.
    • 19.11. SAP SE
    • 19.12. Verint Systems Inc.
  • 20. Assumptions & Acronyms Used
  • 21. Research Methodology

List of Tables

Table 1: Global Market Value (US$ Million) Forecast by Region, 2017 to 2032

Table 2: Global Market Value (US$ Million) Forecast by Solution, 2017 to 2032

Table 3: Global Market Value (US$ Million) Forecast by Service, 2017 to 2032

Table 4: Global Market Value (US$ Million) Forecast by Deployment, 2017 to 2032

Table 5: Global Market Value (US$ Million) Forecast by Enterprise Size, 2017 to 2032

Table 6: Global Market Value (US$ Million) Forecast by Application, 2017 to 2032

Table 7: Global Market Value (US$ Million) Forecast by End Use, 2017 to 2032

Table 8: North America Market Value (US$ Million) Forecast by Country, 2017 to 2032

Table 9: North America Market Value (US$ Million) Forecast by Solution, 2017 to 2032

Table 10: North America Market Value (US$ Million) Forecast by Service, 2017 to 2032

Table 11: North America Market Value (US$ Million) Forecast by Deployment, 2017 to 2032

Table 12: North America Market Value (US$ Million) Forecast by Enterprise Size, 2017 to 2032

Table 13: North America Market Value (US$ Million) Forecast by Application, 2017 to 2032

Table 14: North America Market Value (US$ Million) Forecast by End Use, 2017 to 2032

Table 15: Latin America Market Value (US$ Million) Forecast by Country, 2017 to 2032

Table 16: Latin America Market Value (US$ Million) Forecast by Solution, 2017 to 2032

Table 17: Latin America Market Value (US$ Million) Forecast by Service, 2017 to 2032

Table 18: Latin America Market Value (US$ Million) Forecast by Deployment, 2017 to 2032

Table 19: Latin America Market Value (US$ Million) Forecast by Enterprise Size, 2017 to 2032

Table 20: Latin America Market Value (US$ Million) Forecast by Application, 2017 to 2032

Table 21: Latin America Market Value (US$ Million) Forecast by End Use, 2017 to 2032

Table 22: Europe Market Value (US$ Million) Forecast by Country, 2017 to 2032

Table 23: Europe Market Value (US$ Million) Forecast by Solution, 2017 to 2032

Table 24: Europe Market Value (US$ Million) Forecast by Service, 2017 to 2032

Table 25: Europe Market Value (US$ Million) Forecast by Deployment, 2017 to 2032

Table 26: Europe Market Value (US$ Million) Forecast by Enterprise Size, 2017 to 2032

Table 27: Europe Market Value (US$ Million) Forecast by Application, 2017 to 2032

Table 28: Europe Market Value (US$ Million) Forecast by End Use, 2017 to 2032

Table 29: Asia Pacific Market Value (US$ Million) Forecast by Country, 2017 to 2032

Table 30: Asia Pacific Market Value (US$ Million) Forecast by Solution, 2017 to 2032

Table 31: Asia Pacific Market Value (US$ Million) Forecast by Service, 2017 to 2032

Table 32: Asia Pacific Market Value (US$ Million) Forecast by Deployment, 2017 to 2032

Table 33: Asia Pacific Market Value (US$ Million) Forecast by Enterprise Size, 2017 to 2032

Table 34: Asia Pacific Market Value (US$ Million) Forecast by Application, 2017 to 2032

Table 35: Asia Pacific Market Value (US$ Million) Forecast by End Use, 2017 to 2032

Table 36: MEA Market Value (US$ Million) Forecast by Country, 2017 to 2032

Table 37: MEA Market Value (US$ Million) Forecast by Solution, 2017 to 2032

Table 38: MEA Market Value (US$ Million) Forecast by Service, 2017 to 2032

Table 39: MEA Market Value (US$ Million) Forecast by Deployment, 2017 to 2032

Table 40: MEA Market Value (US$ Million) Forecast by Enterprise Size, 2017 to 2032

Table 41: MEA Market Value (US$ Million) Forecast by Application, 2017 to 2032

Table 42: MEA Market Value (US$ Million) Forecast by End Use, 2017 to 2032

List of Figures

Figure 1: Global Market Value (US$ Million) by Solution, 2022 to 2032

Figure 2: Global Market Value (US$ Million) by Service, 2022 to 2032

Figure 3: Global Market Value (US$ Million) by Deployment, 2022 to 2032

Figure 4: Global Market Value (US$ Million) by Enterprise Size, 2022 to 2032

Figure 5: Global Market Value (US$ Million) by Application, 2022 to 2032

Figure 6: Global Market Value (US$ Million) by End Use, 2022 to 2032

Figure 7: Global Market Value (US$ Million) by Region, 2022 to 2032

Figure 8: Global Market Value (US$ Million) Analysis by Region, 2017 to 2032

Figure 9: Global Market Value Share (%) and BPS Analysis by Region, 2022 to 2032

Figure 10: Global Market Y-o-Y Growth (%) Projections by Region, 2022 to 2032

Figure 11: Global Market Value (US$ Million) Analysis by Solution, 2017 to 2032

Figure 12: Global Market Value Share (%) and BPS Analysis by Solution, 2022 to 2032

Figure 13: Global Market Y-o-Y Growth (%) Projections by Solution, 2022 to 2032

Figure 14: Global Market Value (US$ Million) Analysis by Service, 2017 to 2032

Figure 15: Global Market Value Share (%) and BPS Analysis by Service, 2022 to 2032

Figure 16: Global Market Y-o-Y Growth (%) Projections by Service, 2022 to 2032

Figure 17: Global Market Value (US$ Million) Analysis by Deployment, 2017 to 2032

Figure 18: Global Market Value Share (%) and BPS Analysis by Deployment, 2022 to 2032

Figure 19: Global Market Y-o-Y Growth (%) Projections by Deployment, 2022 to 2032

Figure 20: Global Market Value (US$ Million) Analysis by Enterprise Size, 2017 to 2032

Figure 21: Global Market Value Share (%) and BPS Analysis by Enterprise Size, 2022 to 2032

Figure 22: Global Market Y-o-Y Growth (%) Projections by Enterprise Size, 2022 to 2032

Figure 23: Global Market Value (US$ Million) Analysis by Application, 2017 to 2032

Figure 24: Global Market Value Share (%) and BPS Analysis by Application, 2022 to 2032

Figure 25: Global Market Y-o-Y Growth (%) Projections by Application, 2022 to 2032

Figure 26: Global Market Value (US$ Million) Analysis by End Use, 2017 to 2032

Figure 27: Global Market Value Share (%) and BPS Analysis by End Use, 2022 to 2032

Figure 28: Global Market Y-o-Y Growth (%) Projections by End Use, 2022 to 2032

Figure 29: Global Market Attractiveness by Solution, 2022 to 2032

Figure 30: Global Market Attractiveness by Service, 2022 to 2032

Figure 31: Global Market Attractiveness by Deployment, 2022 to 2032

Figure 32: Global Market Attractiveness by Enterprise Size, 2022 to 2032

Figure 33: Global Market Attractiveness by Application, 2022 to 2032

Figure 34: Global Market Attractiveness by End Use, 2022 to 2032

Figure 35: Global Market Attractiveness by Region, 2022 to 2032

Figure 36: North America Market Value (US$ Million) by Solution, 2022 to 2032

Figure 37: North America Market Value (US$ Million) by Service, 2022 to 2032

Figure 38: North America Market Value (US$ Million) by Deployment, 2022 to 2032

Figure 39: North America Market Value (US$ Million) by Enterprise Size, 2022 to 2032

Figure 40: North America Market Value (US$ Million) by Application, 2022 to 2032

Figure 41: North America Market Value (US$ Million) by End Use, 2022 to 2032

Figure 42: North America Market Value (US$ Million) by Country, 2022 to 2032

Figure 43: North America Market Value (US$ Million) Analysis by Country, 2017 to 2032

Figure 44: North America Market Value Share (%) and BPS Analysis by Country, 2022 to 2032

Figure 45: North America Market Y-o-Y Growth (%) Projections by Country, 2022 to 2032

Figure 46: North America Market Value (US$ Million) Analysis by Solution, 2017 to 2032

Figure 47: North America Market Value Share (%) and BPS Analysis by Solution, 2022 to 2032

Figure 48: North America Market Y-o-Y Growth (%) Projections by Solution, 2022 to 2032

Figure 49: North America Market Value (US$ Million) Analysis by Service, 2017 to 2032

Figure 50: North America Market Value Share (%) and BPS Analysis by Service, 2022 to 2032

Figure 51: North America Market Y-o-Y Growth (%) Projections by Service, 2022 to 2032

Figure 52: North America Market Value (US$ Million) Analysis by Deployment, 2017 to 2032

Figure 53: North America Market Value Share (%) and BPS Analysis by Deployment, 2022 to 2032

Figure 54: North America Market Y-o-Y Growth (%) Projections by Deployment, 2022 to 2032

Figure 55: North America Market Value (US$ Million) Analysis by Enterprise Size, 2017 to 2032

Figure 56: North America Market Value Share (%) and BPS Analysis by Enterprise Size, 2022 to 2032

Figure 57: North America Market Y-o-Y Growth (%) Projections by Enterprise Size, 2022 to 2032

Figure 58: North America Market Value (US$ Million) Analysis by Application, 2017 to 2032

Figure 59: North America Market Value Share (%) and BPS Analysis by Application, 2022 to 2032

Figure 60: North America Market Y-o-Y Growth (%) Projections by Application, 2022 to 2032

Figure 61: North America Market Value (US$ Million) Analysis by End Use, 2017 to 2032

Figure 62: North America Market Value Share (%) and BPS Analysis by End Use, 2022 to 2032

Figure 63: North America Market Y-o-Y Growth (%) Projections by End Use, 2022 to 2032

Figure 64: North America Market Attractiveness by Solution, 2022 to 2032

Figure 65: North America Market Attractiveness by Service, 2022 to 2032

Figure 66: North America Market Attractiveness by Deployment, 2022 to 2032

Figure 67: North America Market Attractiveness by Enterprise Size, 2022 to 2032

Figure 68: North America Market Attractiveness by Application, 2022 to 2032

Figure 69: North America Market Attractiveness by End Use, 2022 to 2032

Figure 70: North America Market Attractiveness by Country, 2022 to 2032

Figure 71: Latin America Market Value (US$ Million) by Solution, 2022 to 2032

Figure 72: Latin America Market Value (US$ Million) by Service, 2022 to 2032

Figure 73: Latin America Market Value (US$ Million) by Deployment, 2022 to 2032

Figure 74: Latin America Market Value (US$ Million) by Enterprise Size, 2022 to 2032

Figure 75: Latin America Market Value (US$ Million) by Application, 2022 to 2032

Figure 76: Latin America Market Value (US$ Million) by End Use, 2022 to 2032

Figure 77: Latin America Market Value (US$ Million) by Country, 2022 to 2032

Figure 78: Latin America Market Value (US$ Million) Analysis by Country, 2017 to 2032

Figure 79: Latin America Market Value Share (%) and BPS Analysis by Country, 2022 to 2032

Figure 80: Latin America Market Y-o-Y Growth (%) Projections by Country, 2022 to 2032

Figure 81: Latin America Market Value (US$ Million) Analysis by Solution, 2017 to 2032

Figure 82: Latin America Market Value Share (%) and BPS Analysis by Solution, 2022 to 2032

Figure 83: Latin America Market Y-o-Y Growth (%) Projections by Solution, 2022 to 2032

Figure 84: Latin America Market Value (US$ Million) Analysis by Service, 2017 to 2032

Figure 85: Latin America Market Value Share (%) and BPS Analysis by Service, 2022 to 2032

Figure 86: Latin America Market Y-o-Y Growth (%) Projections by Service, 2022 to 2032

Figure 87: Latin America Market Value (US$ Million) Analysis by Deployment, 2017 to 2032

Figure 88: Latin America Market Value Share (%) and BPS Analysis by Deployment, 2022 to 2032

Figure 89: Latin America Market Y-o-Y Growth (%) Projections by Deployment, 2022 to 2032

Figure 90: Latin America Market Value (US$ Million) Analysis by Enterprise Size, 2017 to 2032

Figure 91: Latin America Market Value Share (%) and BPS Analysis by Enterprise Size, 2022 to 2032

Figure 92: Latin America Market Y-o-Y Growth (%) Projections by Enterprise Size, 2022 to 2032

Figure 93: Latin America Market Value (US$ Million) Analysis by Application, 2017 to 2032

Figure 94: Latin America Market Value Share (%) and BPS Analysis by Application, 2022 to 2032

Figure 95: Latin America Market Y-o-Y Growth (%) Projections by Application, 2022 to 2032

Figure 96: Latin America Market Value (US$ Million) Analysis by End Use, 2017 to 2032

Figure 97: Latin America Market Value Share (%) and BPS Analysis by End Use, 2022 to 2032

Figure 98: Latin America Market Y-o-Y Growth (%) Projections by End Use, 2022 to 2032

Figure 99: Latin America Market Attractiveness by Solution, 2022 to 2032

Figure 100: Latin America Market Attractiveness by Service, 2022 to 2032

Figure 101: Latin America Market Attractiveness by Deployment, 2022 to 2032

Figure 102: Latin America Market Attractiveness by Enterprise Size, 2022 to 2032

Figure 103: Latin America Market Attractiveness by Application, 2022 to 2032

Figure 104: Latin America Market Attractiveness by End Use, 2022 to 2032

Figure 105: Latin America Market Attractiveness by Country, 2022 to 2032

Figure 106: Europe Market Value (US$ Million) by Solution, 2022 to 2032

Figure 107: Europe Market Value (US$ Million) by Service, 2022 to 2032

Figure 108: Europe Market Value (US$ Million) by Deployment, 2022 to 2032

Figure 109: Europe Market Value (US$ Million) by Enterprise Size, 2022 to 2032

Figure 110: Europe Market Value (US$ Million) by Application, 2022 to 2032

Figure 111: Europe Market Value (US$ Million) by End Use, 2022 to 2032

Figure 112: Europe Market Value (US$ Million) by Country, 2022 to 2032

Figure 113: Europe Market Value (US$ Million) Analysis by Country, 2017 to 2032

Figure 114: Europe Market Value Share (%) and BPS Analysis by Country, 2022 to 2032

Figure 115: Europe Market Y-o-Y Growth (%) Projections by Country, 2022 to 2032

Figure 116: Europe Market Value (US$ Million) Analysis by Solution, 2017 to 2032

Figure 117: Europe Market Value Share (%) and BPS Analysis by Solution, 2022 to 2032

Figure 118: Europe Market Y-o-Y Growth (%) Projections by Solution, 2022 to 2032

Figure 119: Europe Market Value (US$ Million) Analysis by Service, 2017 to 2032

Figure 120: Europe Market Value Share (%) and BPS Analysis by Service, 2022 to 2032

Figure 121: Europe Market Y-o-Y Growth (%) Projections by Service, 2022 to 2032

Figure 122: Europe Market Value (US$ Million) Analysis by Deployment, 2017 to 2032

Figure 123: Europe Market Value Share (%) and BPS Analysis by Deployment, 2022 to 2032

Figure 124: Europe Market Y-o-Y Growth (%) Projections by Deployment, 2022 to 2032

Figure 125: Europe Market Value (US$ Million) Analysis by Enterprise Size, 2017 to 2032

Figure 126: Europe Market Value Share (%) and BPS Analysis by Enterprise Size, 2022 to 2032

Figure 127: Europe Market Y-o-Y Growth (%) Projections by Enterprise Size, 2022 to 2032

Figure 128: Europe Market Value (US$ Million) Analysis by Application, 2017 to 2032

Figure 129: Europe Market Value Share (%) and BPS Analysis by Application, 2022 to 2032

Figure 130: Europe Market Y-o-Y Growth (%) Projections by Application, 2022 to 2032

Figure 131: Europe Market Value (US$ Million) Analysis by End Use, 2017 to 2032

Figure 132: Europe Market Value Share (%) and BPS Analysis by End Use, 2022 to 2032

Figure 133: Europe Market Y-o-Y Growth (%) Projections by End Use, 2022 to 2032

Figure 134: Europe Market Attractiveness by Solution, 2022 to 2032

Figure 135: Europe Market Attractiveness by Service, 2022 to 2032

Figure 136: Europe Market Attractiveness by Deployment, 2022 to 2032

Figure 137: Europe Market Attractiveness by Enterprise Size, 2022 to 2032

Figure 138: Europe Market Attractiveness by Application, 2022 to 2032

Figure 139: Europe Market Attractiveness by End Use, 2022 to 2032

Figure 140: Europe Market Attractiveness by Country, 2022 to 2032

Figure 141: Asia Pacific Market Value (US$ Million) by Solution, 2022 to 2032

Figure 142: Asia Pacific Market Value (US$ Million) by Service, 2022 to 2032

Figure 143: Asia Pacific Market Value (US$ Million) by Deployment, 2022 to 2032

Figure 144: Asia Pacific Market Value (US$ Million) by Enterprise Size, 2022 to 2032

Figure 145: Asia Pacific Market Value (US$ Million) by Application, 2022 to 2032

Figure 146: Asia Pacific Market Value (US$ Million) by End Use, 2022 to 2032

Figure 147: Asia Pacific Market Value (US$ Million) by Country, 2022 to 2032

Figure 148: Asia Pacific Market Value (US$ Million) Analysis by Country, 2017 to 2032

Figure 149: Asia Pacific Market Value Share (%) and BPS Analysis by Country, 2022 to 2032

Figure 150: Asia Pacific Market Y-o-Y Growth (%) Projections by Country, 2022 to 2032

Figure 151: Asia Pacific Market Value (US$ Million) Analysis by Solution, 2017 to 2032

Figure 152: Asia Pacific Market Value Share (%) and BPS Analysis by Solution, 2022 to 2032

Figure 153: Asia Pacific Market Y-o-Y Growth (%) Projections by Solution, 2022 to 2032

Figure 154: Asia Pacific Market Value (US$ Million) Analysis by Service, 2017 to 2032

Figure 155: Asia Pacific Market Value Share (%) and BPS Analysis by Service, 2022 to 2032

Figure 156: Asia Pacific Market Y-o-Y Growth (%) Projections by Service, 2022 to 2032

Figure 157: Asia Pacific Market Value (US$ Million) Analysis by Deployment, 2017 to 2032

Figure 158: Asia Pacific Market Value Share (%) and BPS Analysis by Deployment, 2022 to 2032

Figure 159: Asia Pacific Market Y-o-Y Growth (%) Projections by Deployment, 2022 to 2032

Figure 160: Asia Pacific Market Value (US$ Million) Analysis by Enterprise Size, 2017 to 2032

Figure 161: Asia Pacific Market Value Share (%) and BPS Analysis by Enterprise Size, 2022 to 2032

Figure 162: Asia Pacific Market Y-o-Y Growth (%) Projections by Enterprise Size, 2022 to 2032

Figure 163: Asia Pacific Market Value (US$ Million) Analysis by Application, 2017 to 2032

Figure 164: Asia Pacific Market Value Share (%) and BPS Analysis by Application, 2022 to 2032

Figure 165: Asia Pacific Market Y-o-Y Growth (%) Projections by Application, 2022 to 2032

Figure 166: Asia Pacific Market Value (US$ Million) Analysis by End Use, 2017 to 2032

Figure 167: Asia Pacific Market Value Share (%) and BPS Analysis by End Use, 2022 to 2032

Figure 168: Asia Pacific Market Y-o-Y Growth (%) Projections by End Use, 2022 to 2032

Figure 169: Asia Pacific Market Attractiveness by Solution, 2022 to 2032

Figure 170: Asia Pacific Market Attractiveness by Service, 2022 to 2032

Figure 171: Asia Pacific Market Attractiveness by Deployment, 2022 to 2032

Figure 172: Asia Pacific Market Attractiveness by Enterprise Size, 2022 to 2032

Figure 173: Asia Pacific Market Attractiveness by Application, 2022 to 2032

Figure 174: Asia Pacific Market Attractiveness by End Use, 2022 to 2032

Figure 175: Asia Pacific Market Attractiveness by Country, 2022 to 2032

Figure 176: MEA Market Value (US$ Million) by Solution, 2022 to 2032

Figure 177: MEA Market Value (US$ Million) by Service, 2022 to 2032

Figure 178: MEA Market Value (US$ Million) by Deployment, 2022 to 2032

Figure 179: MEA Market Value (US$ Million) by Enterprise Size, 2022 to 2032

Figure 180: MEA Market Value (US$ Million) by Application, 2022 to 2032

Figure 181: MEA Market Value (US$ Million) by End Use, 2022 to 2032

Figure 182: MEA Market Value (US$ Million) by Country, 2022 to 2032

Figure 183: MEA Market Value (US$ Million) Analysis by Country, 2017 to 2032

Figure 184: MEA Market Value Share (%) and BPS Analysis by Country, 2022 to 2032

Figure 185: MEA Market Y-o-Y Growth (%) Projections by Country, 2022 to 2032

Figure 186: MEA Market Value (US$ Million) Analysis by Solution, 2017 to 2032

Figure 187: MEA Market Value Share (%) and BPS Analysis by Solution, 2022 to 2032

Figure 188: MEA Market Y-o-Y Growth (%) Projections by Solution, 2022 to 2032

Figure 189: MEA Market Value (US$ Million) Analysis by Service, 2017 to 2032

Figure 190: MEA Market Value Share (%) and BPS Analysis by Service, 2022 to 2032

Figure 191: MEA Market Y-o-Y Growth (%) Projections by Service, 2022 to 2032

Figure 192: MEA Market Value (US$ Million) Analysis by Deployment, 2017 to 2032

Figure 193: MEA Market Value Share (%) and BPS Analysis by Deployment, 2022 to 2032

Figure 194: MEA Market Y-o-Y Growth (%) Projections by Deployment, 2022 to 2032

Figure 195: MEA Market Value (US$ Million) Analysis by Enterprise Size, 2017 to 2032

Figure 196: MEA Market Value Share (%) and BPS Analysis by Enterprise Size, 2022 to 2032

Figure 197: MEA Market Y-o-Y Growth (%) Projections by Enterprise Size, 2022 to 2032

Figure 198: MEA Market Value (US$ Million) Analysis by Application, 2017 to 2032

Figure 199: MEA Market Value Share (%) and BPS Analysis by Application, 2022 to 2032

Figure 200: MEA Market Y-o-Y Growth (%) Projections by Application, 2022 to 2032

Figure 201: MEA Market Value (US$ Million) Analysis by End Use, 2017 to 2032

Figure 202: MEA Market Value Share (%) and BPS Analysis by End Use, 2022 to 2032

Figure 203: MEA Market Y-o-Y Growth (%) Projections by End Use, 2022 to 2032

Figure 204: MEA Market Attractiveness by Solution, 2022 to 2032

Figure 205: MEA Market Attractiveness by Service, 2022 to 2032

Figure 206: MEA Market Attractiveness by Deployment, 2022 to 2032

Figure 207: MEA Market Attractiveness by Enterprise Size, 2022 to 2032

Figure 208: MEA Market Attractiveness by Application, 2022 to 2032

Figure 209: MEA Market Attractiveness by End Use, 2022 to 2032

Figure 210: MEA Market Attractiveness by Country, 2022 to 2032

Frequently Asked Questions

How much is the current worth of the Contact Center Analytics Market?

The global Contact Center Analytics Market is worth more than USD 1.5 Billion at present.

What is the sales forecast for Contact Center Analytics Market?

The value of Contact Center Analytics Market is projected to increase at a CAGR of around 16.2% from 2022 to 2032.

What was the last 5 year’s market CAGR?

The value of Contact Center Analytics Market increased at a CAGR of around 19.1% from 2017 to 2021.

What are the key Contact Center Analytics Market Trends?

The demand for contact center analytics in BFSI has increased tremendously, which is a prominent market trend.

At what percentage is sales of Contact Center Analytics Market going to register growth in USA?

The growth of the Contact Center Analytics market in the US is projected to expand at a CAGR of around 14.9% from 2022 to 2032.

At what percentage is sales of Contact Center Analytics Market going to register growth in China?

The growth of market for Contact Center Analytics in China is projected to expand at a CAGR of around 17.2% from 2022 to 2032.

What do statistics for South Korea and Japan reveal?

While the market in South Korea is expected to grow at nearly 16.6%, the market in Japan is projected to register a CAGR of nearly 15.6% from 2022 to 2032.

Explore Similar Insights

Future Market Insights

Contact Center Analytics Market