Crane Cabin Market Size, Share, and Forecast Outlook 2025 to 2035

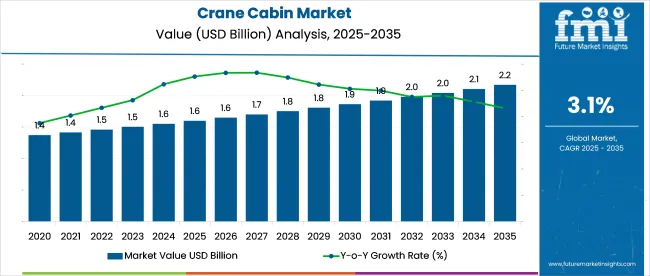
The crane cabin market is projected to grow from USD 1.6 billion in 2025 to USD 2.1 billion by 2035, reflecting a CAGR of 3.1% over the forecast period. The market is evolving as buyers prioritize comfort, safety, and better visibility for operators in sectors like ports, mining, and heavy manufacturing.
Quick Stats in Crane Cabin Market

  • Market Size (2025): USD 1.6 billion
  • Market Forecast (2035): USD 2.1 billion
  • CAGR (2025 to 2035): 3.1%
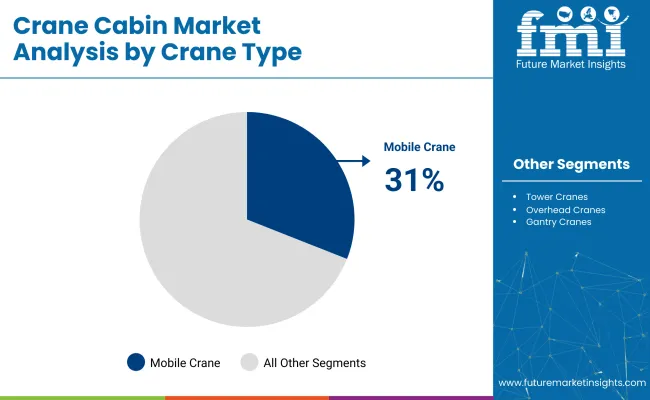
  • Top Crane Type Segment: Mobile Crane (31% share in 2025)
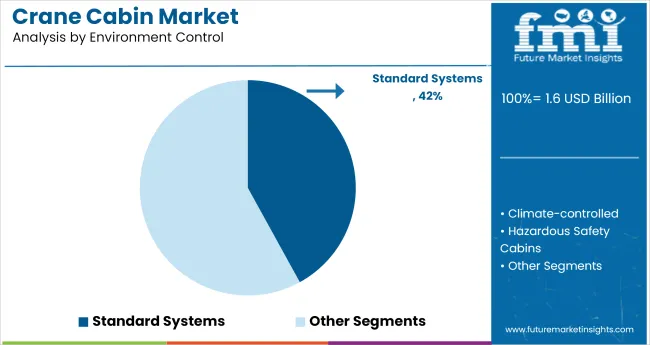
  • Leading Environment Control Type: Standard (42% share in 2025)
  • Fastest Growing Country: Turkiye (6.2% CAGR)

Crane Cabin Market

OEMs are moving toward modular cabin designs using steel-aluminum frames, with upgrades like 270-degree viewing angles and air suspension seating. Suppliers are seeing more orders for joystick controls, noise-reducing panels, and insulated glass suited for extreme climates.

Retrofitting companies are also gaining ground, especially in Southeast Asia and Eastern Europe, offering certified upgrade kits for older crane fleets. Distributors are shifting to stock pre-assembled units that speed up installation at job sites.

At the project level, engineering firms are including cabin upgrades in crane automation packages. This supply chain is increasingly focused on operator performance, quick deployment, and flexible retrofits to meet rising safety and efficiency standards.

As of 2025, the crane cabin market holds a modest but essential share across its parent industries. Within the global crane market, crane cabins contribute around 6-8%, driven by demand for operator safety, visibility, and ergonomic enhancements. In the construction equipment market, the share stands at 2-3%, since cabins represent a key but relatively small component of total machinery value.

Within the material handling equipment market, crane cabins account for approximately 3-4%, particularly in overhead and gantry crane systems used in ports and factories. In the industrial vehicle components market, their share is about 2-2.5%, tied to specialized operator enclosures. In the heavy equipment operator safety systems market, crane cabins make up around 4-5%, as safety-compliant designs gain prominence.

Analyzing Crane Cabin Market by Top Investment Segments

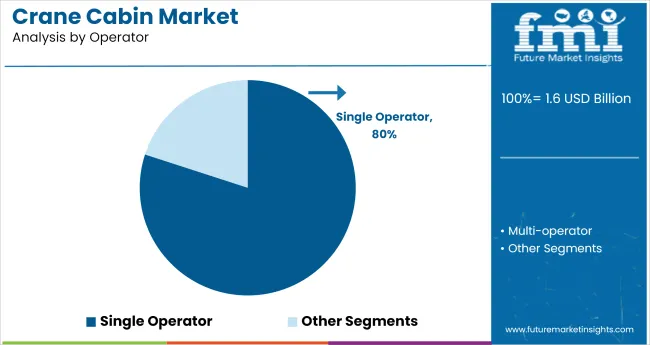
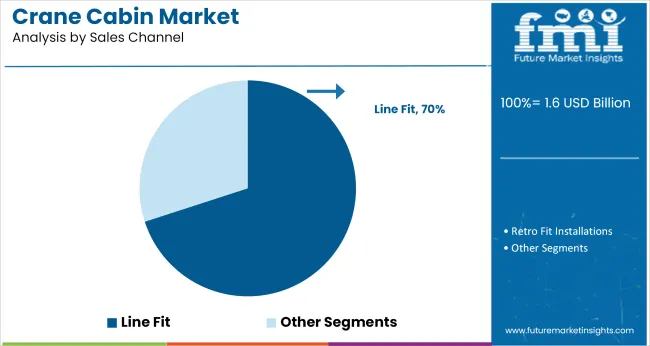
Enclosed platforms are projected to lead the platform segment with a 60% share by 2025, while mobile cranes will dominate by crane type at 31%. Standard environment control systems will command 42% of market share, and cabins designed for single-operator use are anticipated to reach 80%. Line fit will remain the dominant sales channel, contributing 70%.

Enclosed Platform to Lead the Platform Segment with 60% Market Share

Enclosed platforms are expected to account for 60% of the global market share by 2025, driven by the increasing focus on operator safety and climate resilience. Demand is growing across port terminals and construction sites where operators require protection from wind, dust, and temperature fluctuations.
  • Equipment manufacturers are designing ergonomic enclosures with sound insulation and clear visibility to reduce operator fatigue.
  • Enhanced durability, advanced air filtration systems, and built-in control interfaces are making enclosed cabins the preferred option across various crane types.

Mobile Cranes to Dominate the Crane Type Segment with 31% Market Share

Crane Cabin Market Analysis By Crane Type

Mobile cranes are projected to lead by crane type, securing 31% of the market share by 2025 due to their flexibility and widespread usage across industries. Infrastructure projects and urban development are boosting the need for highly maneuverable crane systems fitted with efficient operator cabins.
  • Custom-built cabins for mobile units are being developed to withstand vibration and dynamic load conditions in varying terrains.
  • Adoption of smart features such as touchscreen controls and telematics is further increasing cabin sophistication in mobile crane models.

Standard Systems to Lead the Environment Control Segment with 42% Market Share

Crane Cabin Market Analysis By Environment Control

Standard environment control systems are expected to hold 42% of the market share by 2025, offering practical functionality without premium cost. Industrial operators prefer cabins equipped with standard climate features such as fans, air vents, and window sunshades for daily shifts.
  • Emerging markets continue to opt for basic environment control to meet cost-efficiency requirements during high-volume equipment deployment.
  • Continued use in moderate climate zones supports consistent demand, especially where temperature extremes are not a primary concern.

Single Operator to Lead the Operator Segment with 80% Market Share

Crane Cabin Market Analysis By Operator

Single-operator crane cabins are expected to dominate the operator segment with an 80% share by 2025, reflecting the industry trend toward individualized control. Centralized cockpit designs are being optimized to accommodate solo operation without compromising visibility or functional access.
  • Safety guidelines increasingly mandate separation of operating zones, making single-operator designs more practical and compliant.
  • OEMs are integrating automated assistance systems that enhance productivity and reduce reliance on secondary cabin personnel.

Line Fit to Dominate the Sales Channel Segment with 70% Market Share

Crane Cabin Market Analysis By Sales Channel

Line fit is projected to capture 70% of the sales channel market share by 2025 as OEM integration becomes the preferred procurement route. Manufacturers are standardizing cabin installation within production lines, reducing aftermarket retrofitting costs for end users.

  • Procurement managers favor line-fit options for better warranty coverage, consistent quality assurance, and faster deployment timelines.
  • Demand from fleet buyers and construction conglomerates supports line-fit dominance due to predictable delivery and streamlined commissioning.

Top Crane Cabin Market Dynamics

The market is experiencing steady growth as automation, safety mandates, and operator ergonomics become central to industrial equipment design. In 2024, over 138,000 new cranes were commissioned globally, with nearly 72% requiring upgraded cabins built to ANSI/ASME and ISO 10245 standards. Demand is especially strong in high-capacity port cranes, mining operations, and precast concrete handling systems.

Strong Uptake in Ports, Construction, and Heavy Manufacturing Sectors

Cabin retrofits are being prioritized in maritime logistics, where panoramic visibility and anti-vibration platforms improve operator precision. In Asia Pacific alone, 61 port terminals invested in modular crane cabins last year. In construction, enclosed HVAC-equipped cabins are replacing older open-frame types to meet new safety norms and climate resilience requirements.

  • Modular cabins installed across seaport gantry and reach stacker fleets.
  • Adopted in high-rise construction sites for all-weather operability.
  • Deployed in steel mills to enhance precision handling in molten zones.

Emphasis on Operator Comfort, Visibility, and Human-Machine Interface

Ergonomics now drive cabin design, with joystick-integrated armrests, shock-absorbing seats, and 360° laminated glass becoming standard. In 2023, nearly 68% of cabin-related operator injuries were linked to poor seat design and limited visibility. Manufacturers are responding with FOPS-certified cabins, glare-free lighting, and integrated display panels for real-time load metrics.
  • Adjustable seating and anti-fatigue flooring adopted in over 40% of new installs.
  • Panoramic glass and glare-free visors improve line-of-sight in multi-shift use.
  • Touchscreen HMIs reduce manual input and streamline lifting commands.

Top Countries Engineering, Outfitting, and Scaling Demand in the Crane Cabin Market

Country Wise Analysis Of Crane Cabin Market Cagr 2025 To 2035

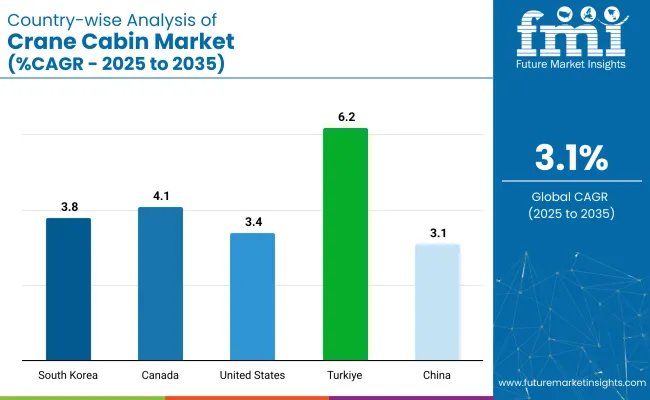
Countries CAGR (2025 to 2035)
Turkiye 6.2%
Canada 4.1%
United States 3.4%
South Korea 3.8%
China 3.1%

The global market is projected to grow at a modest 3.1% CAGR from 2025 to 2035, but country-level momentum varies sharply. Turkiye, a non-OECD manufacturing hub, leads with 6.2%, more than twice the global average. This growth is driven by its expanding role in EU-adjacent heavy equipment supply chains and increased investments in shipyards and steel production.

Cabin OEMs are targeting export-compliant designs and responding to retrofitting demand from CIS and MENA buyers. Canada follows at 4.1%, supported by demand for climate-adapted cabins suited for harsh mining and petrochemical environments in Alberta and Saskatchewan. South Korea registers 3.8%, underpinned by government-backed smart port initiatives and a robust domestic manufacturing base centered in Busan.

The USA shows moderate growth at 3.4%, primarily driven by delayed infrastructure renewal and gradual rail yard fleet upgrades. China remains flat at 3.1% due to market saturation and limited greenfield activity.

The report provides insights across 40+ countries. The five below are highlighted for their strategic influence and growth trajectory.

Market Trends for Crane Cabins in Turkiye

Turkiye’s crane cabin market is projected to grow at a CAGR of 6.2%, the highest among profiled nations. The expansion of port infrastructure under the "Middle Corridor" logistics strategy and rapid growth in industrial zones like Dilovası are increasing demand for overhead and gantry cranes.

Local OEMs such as Çemtaş and Bofimak are producing cost-competitive modular cabins with advanced HVAC, anti-vibration mounts, and wide-vision glass panels. Public-private investments in steel, logistics, and shipbuilding facilities are creating recurring demand for cabin retrofits and replacements.

  • Middle Corridor logistics driving port crane installations
  • Local OEMs scaling modular cabin production for export and domestic use
  • Steel and shipbuilding projects fueling retrofit cycles in industrial hubs

Growth Drivers for Crane Cabin Market in Canada

Canada is forecast to grow at a CAGR of 4.1% through 2035, supported by mining sector modernization and Arctic port upgrades. Cabins are being upgraded in cranes used for potash, copper, and rare earth mineral handling in Saskatchewan and Quebec.

Occupational safety reforms under CSA standards are pushing manufacturers to include ergonomic seating, visibility enhancement, and noise control systems. Canadian crane integrators are importing insulated and climate-controlled cabins for use in sub-zero environments, particularly in Yukon and Nunavut resource sites.

  • Arctic resource logistics fueling insulated cabin demand
  • Mining firms retrofitting cranes with CSA-compliant operator modules
  • Investments in northern infrastructure driving cold-climate cabin imports

Outlook for Crane Cabin Installations in the United States

The USA crane cabin market is expected to grow at a CAGR of 3.4% through 2035. Large-scale warehouse automation and inland port expansions are increasing demand for bridge cranes and corresponding cabin units. OSHA and ANSI B30 standards are shaping design requirements including temperature regulation, field visibility, and anti-fatigue flooring.

Ports in Georgia and California are upgrading ship-to-shore cranes with smart-enabled cabins offering joystick controls and monitoring displays. Demand is being driven by the logistics, steel recycling, and aerospace fabrication industries.

  • Port upgrades leading to replacement of legacy crane cabins
  • Smart cabin systems integrated into high-throughput distribution centers
  • Steel recycling firms adopting joystick-based operator enclosures

Innovation Outlook for Crane Cabins in South Korea

South Korea’s crane cabin market is projected to grow at a CAGR of 3.8% through 2035, supported by shipyard innovation and automation in container terminals. Companies like Doosan Heavy Industries are incorporating touchscreen-based control panels and AI-assisted load sensors into cabin designs.

Cabins are also being adapted for autonomous crane operations in Busan and Incheon ports, where operators remotely monitor real-time load metrics. Strict health and safety protocols have prompted demand for enclosed, pressurized cabins in dust- and fume-heavy environments.

  • Remote-control crane operations expanding in major ports
  • Pressurized cabins deployed in high-pollution work zones
  • Cabin modules now equipped with AI-aided feedback displays

Demand Analysis for Crane Cabin Market in China

China is expected to grow at a CAGR of 3.1% through 2035. State-backed industrial zone developments in Inner Mongolia and Guangxi are creating steady demand for bridge and overhead crane installations.

As part of safety reforms under GB/T 3811 to 2021 standards, crane manufacturers are offering enclosed cabins with heat-resistant materials, shock isolation, and air filtration. Growth is also linked to manufacturing upgrades in Tier 2 cities, where automated crane cabins are being installed for efficiency and worker safety.
  • Enclosed cabins with filtration mandated under updated GB/T standards
  • Tier 2 city manufacturing hubs expanding overhead crane fleets
  • Construction materials sector adopting shock-resistant cabin frames

Leading Crane Cabin Manufacturers

Crane Cabin Market Analysis By Company

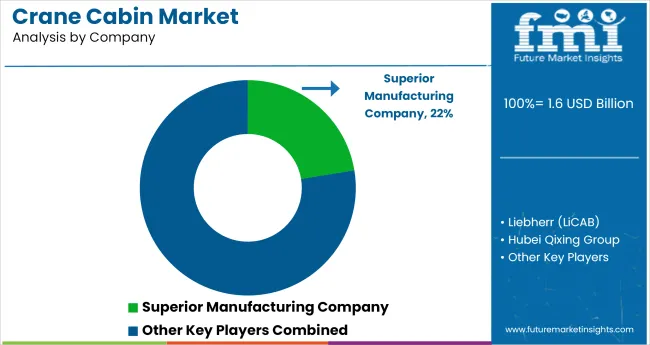
The market is moderately fragmented, with key players offering customized operator cabins for various crane types including tower, overhead, and gantry cranes. Superior Manufacturing Company and Liebherr (LiCAB) lead the space with ergonomically designed, climate-controlled cabins aimed at enhancing operator comfort and safety in heavy-duty applications.

Liebherr’s modular cabin systems are widely adopted in construction and port operations for their reliability and visibility optimization. Henan Seven Industry Co., Ltd. and Hubei Qixing Group cater to industrial and infrastructure projects with tailored cabin solutions for OEM and aftermarket use. Ralf Teichmann GmbH and DGCRANE specialize in retrofitting and supplying cabins for overhead cranes used in steel and logistics facilities.

Recent Crane Cabin Industry News

  • In March 2025, Liebherr (LiCAB) announced a strategic €989 million investment to expand its global production footprint. Key developments include a new hydraulic-cylinder facility in Kirchdorf (Germany), land acquisition near Bischofshofen (Austria), and a logistics center in Tupelo, Mississippi. These expansions aim to support rising demand for advanced crane cabins and systems.
  • In June 2025, Ralf Teichmann GmbH (TeichmannGroup) completed the acquisition of KRAFOTEC, formerly known as TAKRAF GRESSE GmbH. This move enhances the group’s engineering and manufacturing capabilities for overhead and gantry cranes, strengthening its position in the European crane cabin and structural systems market.

Report Coverage and Scope Summary

Report Attributes Details
Market Size (2025) USD 1.6 billion
Projected Market Size (2035) USD 2.2 billion
CAGR (2025 to 2035) 3.1%
Base Year for Estimation 2024
Historical Period 2020 to 2024
Projections Period 2025 to 2035
Quantitative Units USD billion for market value
Platforms Analyzed (Segment 1) Open, Enclosed
Crane Types Analyzed (Segment 2) Overhead Cranes, Tower Cranes, Mobile Cranes, Gantry Cranes
Environment Controls Analyzed (Segment 3) Standard, Climate-Controlled, Hazardous Safety Cabins
Operator Types Analyzed (Segment 4) Single-Operator, Multi-Operator
Sales Channels Analyzed (Segment 5) Line Fit, Retro Fit
Regions Covered North America, Latin America, Eastern Europe, Western Europe, South Asia & Pacific, East Asia, Middle East & Africa
Key Players Superior Manufacturing Company, Liebherr ( LiCAB ), Hubei Qixing Group, Henan Seven Industry Co., Ltd., Ralf Teichmann GmbH, Grúas Sáez, S.L., Henan FineWork Cranes Co., Ltd., DGCRANE
Additional Attributes Dollar sales by crane and platform type, increasing preference for operator safety features, demand for climate-controlled cabins, and rising installations in the construction and logistics sectors.

Leading Players in Crane Cabin Market

  • Superior Manufacturing Company
  • Liebherr (LiCAB)
  • Hubei Qixing Group
  • Henan Seven Industry Co., Ltd.
  • Ralf Teichmann GmbH
  • GrúasSáez, S.L.
  • Henan FineWork Cranes Co., Ltd.
  • DGCRANE

Crane Cabin Market Analyzed by Key Investment Segments

By Platform:

The market is segmented by platform into open and enclosed configurations.

By Crane Type:

By crane type, the industry includes overhead cranes, tower cranes, mobile cranes, and gantry cranes.

By Environment Control:

Based on environmental control, the market is categorized into standard, climate-controlled, and hazardous safety cabins.

By Operator:

In terms of operator type, the market comprises single-operator and multi-operator cabins.

By Sales Channel:

Sales channels include line fit and retrofit installations.

By Region:

Regionally, the market covers North America, Latin America, Eastern Europe, Western Europe, South Asia & Pacific, East Asia, and the Middle East & Africa.

Table of Content

  1. Executive Summary
    • Global Market Outlook
    • Demand-side Trends
    • Supply-side Trends
    • Technology Roadmap Analysis
    • Analysis and Recommendations
  2. Market Overview
    • Market Coverage / Taxonomy
    • Market Definition / Scope / Limitations
  3. Market Background
    • Market Dynamics
      • Drivers
      • Restraints
      • Opportunity
      • Trends
    • Scenario Forecast
      • Demand in Optimistic Scenario
      • Demand in Likely Scenario
      • Demand in Conservative Scenario
    • Opportunity Map Analysis
    • Product Life Cycle Analysis
    • Supply Chain Analysis
      • Supply Side Participants and their Roles
        • Producers
        • Mid-Level Participants (Traders/ Agents/ Brokers)
        • Wholesalers and Distributors
      • Value Added and Value Created at Node in the Supply Chain
      • List of Raw Material Suppliers
      • List of Existing and Potential Buyer’s
    • Investment Feasibility Matrix
    • Value Chain Analysis
      • Profit Margin Analysis
      • Wholesalers and Distributors
      • Retailers
    • PESTLE and Porter’s Analysis
    • Regulatory Landscape
      • By Key Regions
      • By Key Countries
    • Regional Parent Market Outlook
    • Production and Consumption Statistics
    • Import and Export Statistics
  4. Global Market Analysis 2020 to 2024 and Forecast, 2025 to 2035
    • Historical Market Size Value (USD Billion) & Volume (Units) Analysis, 2020 to 2024
    • Current and Future Market Size Value (USD Billion) & Volume (Units) Projections, 2025 to 2035
      • Y-o-Y Growth Trend Analysis
      • Absolute $ Opportunity Analysis
  5. Global Market Pricing Analysis 2020 to 2024 and Forecast 2025 to 2035
  6. Global Market Analysis 2020 to 2024 and Forecast 2025 to 2035, By Platform
    • Introduction / Key Findings
    • Historical Market Size Value (USD Billion) & Volume (Units) Analysis By Platform, 2020 to 2024
    • Current and Future Market Size Value (USD Billion) & Volume (Units) Analysis and Forecast By Platform, 2025 to 2035
      • Open
      • Enclosed
    • Y-o-Y Growth Trend Analysis By Platform, 2020 to 2024
    • Absolute $ Opportunity Analysis By Platform, 2025 to 2035
  7. Global Market Analysis 2020 to 2024 and Forecast 2025 to 2035, By Crane Type
    • Introduction / Key Findings
    • Historical Market Size Value (USD Billion) & Volume (Units) Analysis By Crane Type, 2020 to 2024
    • Current and Future Market Size Value (USD Billion) & Volume (Units) Analysis and Forecast By Crane Type, 2025 to 2035
      • Overhead Crane
      • Tower Crane
      • Mobile Crane
      • Gantry Crane
    • Y-o-Y Growth Trend Analysis By Crane Type, 2020 to 2024
    • Absolute $ Opportunity Analysis By Crane Type, 2025 to 2035
  8. Global Market Analysis 2020 to 2024 and Forecast 2025 to 2035, By Environment Control
    • Introduction / Key Findings
    • Historical Market Size Value (USD Billion) & Volume (Units) Analysis By Environment Control, 2020 to 2024
    • Current and Future Market Size Value (USD Billion) & Volume (Units) Analysis and Forecast By Environment Control, 2025 to 2035
      • Standard
      • Climate Controlled
      • Hazardous Safety
    • Y-o-Y Growth Trend Analysis By Environment Control, 2020 to 2024
    • Absolute $ Opportunity Analysis By Environment Control, 2025 to 2035
  9. Global Market Analysis 2020 to 2024 and Forecast 2025 to 2035, By Operator
    • Introduction / Key Findings
    • Historical Market Size Value (USD Billion) & Volume (Units) Analysis By Operator, 2020 to 2024
    • Current and Future Market Size Value (USD Billion) & Volume (Units) Analysis and Forecast By Operator, 2025 to 2035
      • Single Operator
      • Multi-operator
    • Y-o-Y Growth Trend Analysis By Operator, 2020 to 2024
    • Absolute $ Opportunity Analysis By Operator, 2025 to 2035
  10. Global Market Analysis 2020 to 2024 and Forecast 2025 to 2035, By Sales Channel
    • Introduction / Key Findings
    • Historical Market Size Value (USD Billion) & Volume (Units) Analysis By Sales Channel, 2020 to 2024
    • Current and Future Market Size Value (USD Billion) & Volume (Units) Analysis and Forecast By Sales Channel, 2025 to 2035
      • Line Fit
      • Retro Fit
    • Y-o-Y Growth Trend Analysis By Sales Channel, 2020 to 2024
    • Absolute $ Opportunity Analysis By Sales Channel, 2025 to 2035
  11. Global Market Analysis 2020 to 2024 and Forecast 2025 to 2035, By Region
    • Introduction
    • Historical Market Size Value (USD Billion) & Volume (Units) Analysis By Region, 2020 to 2024
    • Current Market Size Value (USD Billion) & Volume (Units) Analysis and Forecast By Region, 2025 to 2035
      • North America
      • Latin America
      • Western Europe
      • Eastern Europe
      • East Asia
      • South Asia & Pacific
      • Middle East and Africa
    • Market Attractiveness Analysis By Region
  12. North America Market Analysis 2020 to 2024 and Forecast 2025 to 2035, By Country
    • Historical Market Size Value (USD Billion) & Volume (Units) Trend Analysis By Market Taxonomy, 2020 to 2024
    • Market Size Value (USD Billion) & Volume (Units) Forecast By Market Taxonomy, 2025 to 2035
      • By Country
        • USA
        • Canada
        • Mexico
      • By Platform
      • By Crane Type
      • By Environment Control
      • By Operator
      • By Sales Channel
    • Market Attractiveness Analysis
      • By Country
      • By Platform
      • By Crane Type
      • By Environment Control
      • By Operator
      • By Sales Channel
    • Key Takeaways
  13. Latin America Market Analysis 2020 to 2024 and Forecast 2025 to 2035, By Country
    • Historical Market Size Value (USD Billion) & Volume (Units) Trend Analysis By Market Taxonomy, 2020 to 2024
    • Market Size Value (USD Billion) & Volume (Units) Forecast By Market Taxonomy, 2025 to 2035
      • By Country
        • Brazil
        • Argentina
        • Rest of LATAM
      • By Platform
      • By Crane Type
      • By Environment Control
      • By Operator
      • By Sales Channel
    • Market Attractiveness Analysis
      • By Country
      • By Platform
      • By Crane Type
      • By Environment Control
      • By Operator
      • By Sales Channel
    • Key Takeaways
  14. Western Europe Market Analysis 2020 to 2024 and Forecast 2025 to 2035, By Country
    • Historical Market Size Value (USD Billion) & Volume (Units) Trend Analysis By Market Taxonomy, 2020 to 2024
    • Market Size Value (USD Billion) & Volume (Units) Forecast By Market Taxonomy, 2025 to 2035
      • By Country
        • Germany
        • Italy
        • France
        • UK
        • Spain
        • BENELUX
        • Nordic
        • Rest of W.Europe
      • By Platform
      • By Crane Type
      • By Environment Control
      • By Operator
      • By Sales Channel
    • Market Attractiveness Analysis
      • By Country
      • By Platform
      • By Crane Type
      • By Environment Control
      • By Operator
      • By Sales Channel
    • Key Takeaways
  15. Eastern Europe Market Analysis 2020 to 2024 and Forecast 2025 to 2035, By Country
    • Historical Market Size Value (USD Billion) & Volume (Units) Trend Analysis By Market Taxonomy, 2020 to 2024
    • Market Size Value (USD Billion) & Volume (Units) Forecast By Market Taxonomy, 2025 to 2035
      • By Country
        • Russia
        • Hungary
        • Poland
        • Balkan & Baltics
        • Rest of E. Europe
      • By Platform
      • By Crane Type
      • By Environment Control
      • By Operator
      • By Sales Channel
    • Market Attractiveness Analysis
      • By Country
      • By Platform
      • By Crane Type
      • By Environment Control
      • By Operator
      • By Sales Channel
    • Key Takeaways
  16. East Asia Market Analysis 2020 to 2024 and Forecast 2025 to 2035, By Country
    • Historical Market Size Value (USD Billion) & Volume (Units) Trend Analysis By Market Taxonomy, 2020 to 2024
    • Market Size Value (USD Billion) & Volume (Units) Forecast By Market Taxonomy, 2025 to 2035
      • By Country
        • China
        • Japan
        • South Korea
      • By Platform
      • By Crane Type
      • By Environment Control
      • By Operator
      • By Sales Channel
    • Market Attractiveness Analysis
      • By Country
      • By Platform
      • By Crane Type
      • By Environment Control
      • By Operator
      • By Sales Channel
    • Key Takeaways
  17. South Asia & Pacific Market Analysis 2020 to 2024 and Forecast 2025 to 2035, By Country
    • Historical Market Size Value (USD Billion) & Volume (Units) Trend Analysis By Market Taxonomy, 2020 to 2024
    • Market Size Value (USD Billion) & Volume (Units) Forecast By Market Taxonomy, 2025 to 2035
      • By Country
        • India
        • Australia & New Zealand
        • ASEAN
        • Rest of SAP
      • By Platform
      • By Crane Type
      • By Environment Control
      • By Operator
      • By Sales Channel
    • Market Attractiveness Analysis
      • By Country
      • By Platform
      • By Crane Type
      • By Environment Control
      • By Operator
      • By Sales Channel
    • Key Takeaways
  18. Middle East and Africa Market Analysis 2020 to 2024 and Forecast 2025 to 2035, By Country
    • Historical Market Size Value (USD Billion) & Volume (Units) Trend Analysis By Market Taxonomy, 2020 to 2024
    • Market Size Value (USD Billion) & Volume (Units) Forecast By Market Taxonomy, 2025 to 2035
      • By Country
        • GCC Countries
        • Northern Africa
        • South Africa
        • Turkiye
        • Rest of MEA
      • By Platform
      • By Crane Type
      • By Environment Control
      • By Operator
      • By Sales Channel
    • Market Attractiveness Analysis
      • By Country
      • By Platform
      • By Crane Type
      • By Environment Control
      • By Operator
      • By Sales Channel
    • Key Takeaways
  19. Key Countries Market Analysis
    • USA
      • Pricing Analysis
      • Market Share Analysis, 2024
        • By Platform
        • By Crane Type
        • By Environment Control
        • By Operator
        • By Sales Channel
    • Canada
      • Pricing Analysis
      • Market Share Analysis, 2024
        • By Platform
        • By Crane Type
        • By Environment Control
        • By Operator
        • By Sales Channel
    • Brazil
      • Pricing Analysis
      • Market Share Analysis, 2024
        • By Platform
        • By Crane Type
        • By Environment Control
        • By Operator
        • By Sales Channel
    • Mexico
      • Pricing Analysis
      • Market Share Analysis, 2024
        • By Platform
        • By Crane Type
        • By Environment Control
        • By Operator
        • By Sales Channel
    • Argentina
      • Pricing Analysis
      • Market Share Analysis, 2024
        • By Platform
        • By Crane Type
        • By Environment Control
        • By Operator
        • By Sales Channel
  20. Market Structure Analysis
    • Competition Dashboard
    • Competition Benchmarking
    • Market Share Analysis of Top Players
      • By Regional
      • By Platform
      • By Crane Type
      • By Environment Control
      • By Operator
      • By Sales Channel
  21. Competition Analysis
    • Competition Deep Dive
      • Superior Manufacturing Company
        • Overview
        • Product Portfolio
        • Profitability by Market Segments (Product/Age /Sales Channel/Region)
        • Sales Footprint
        • Strategy Overview
          • Marketing Strategy
          • Product Strategy
          • Channel Strategy
      • Liebherr (LiCAB)
        • Overview
        • Product Portfolio
        • Profitability by Market Segments (Product/Age /Sales Channel/Region)
        • Sales Footprint
        • Strategy Overview
          • Marketing Strategy
          • Product Strategy
          • Channel Strategy
      • Hubei Qixing Group
        • Overview
        • Product Portfolio
        • Profitability by Market Segments (Product/Age /Sales Channel/Region)
        • Sales Footprint
        • Strategy Overview
          • Marketing Strategy
          • Product Strategy
          • Channel Strategy
      • Henan Seven Industry Co., Ltd.
        • Overview
        • Product Portfolio
        • Profitability by Market Segments (Product/Age /Sales Channel/Region)
        • Sales Footprint
        • Strategy Overview
          • Marketing Strategy
          • Product Strategy
          • Channel Strategy
      • Ralf Teichmann GmbH
        • Overview
        • Product Portfolio
        • Profitability by Market Segments (Product/Age /Sales Channel/Region)
        • Sales Footprint
        • Strategy Overview
          • Marketing Strategy
          • Product Strategy
          • Channel Strategy
      • Grúas Sáez, S.L.
        • Overview
        • Product Portfolio
        • Profitability by Market Segments (Product/Age /Sales Channel/Region)
        • Sales Footprint
        • Strategy Overview
          • Marketing Strategy
          • Product Strategy
          • Channel Strategy
      • Henan FineWork Cranes Co.,Ltd.
        • Overview
        • Product Portfolio
        • Profitability by Market Segments (Product/Age /Sales Channel/Region)
        • Sales Footprint
        • Strategy Overview
          • Marketing Strategy
          • Product Strategy
          • Channel Strategy
      • DGCRANE
        • Overview
        • Product Portfolio
        • Profitability by Market Segments (Product/Age /Sales Channel/Region)
        • Sales Footprint
        • Strategy Overview
          • Marketing Strategy
          • Product Strategy
          • Channel Strategy
  22. Assumptions & Acronyms Used
  23. Research Methodology

List of Tables

  • Table 1: Global Market Value (USD Billion) Forecast by Region, 2020 to 2035
  • Table 2: Global Market Volume (Units) Forecast by Region, 2020 to 2035
  • Table 3: Global Market Value (USD Billion) Forecast by Platform, 2020 to 2035
  • Table 4: Global Market Volume (Units) Forecast by Platform, 2020 to 2035
  • Table 5: Global Market Value (USD Billion) Forecast by Crane Type, 2020 to 2035
  • Table 6: Global Market Volume (Units) Forecast by Crane Type, 2020 to 2035
  • Table 7: Global Market Value (USD Billion) Forecast by Environment Control, 2020 to 2035
  • Table 8: Global Market Volume (Units) Forecast by Environment Control, 2020 to 2035
  • Table 9: Global Market Value (USD Billion) Forecast by Operator, 2020 to 2035
  • Table 10: Global Market Volume (Units) Forecast by Operator, 2020 to 2035
  • Table 11: Global Market Value (USD Billion) Forecast by Sales Channel, 2020 to 2035
  • Table 12: Global Market Volume (Units) Forecast by Sales Channel, 2020 to 2035
  • Table 13: North America Market Value (USD Billion) Forecast by Country, 2020 to 2035
  • Table 14: North America Market Volume (Units) Forecast by Country, 2020 to 2035
  • Table 15: North America Market Value (USD Billion) Forecast by Platform, 2020 to 2035
  • Table 16: North America Market Volume (Units) Forecast by Platform, 2020 to 2035
  • Table 17: North America Market Value (USD Billion) Forecast by Crane Type, 2020 to 2035
  • Table 18: North America Market Volume (Units) Forecast by Crane Type, 2020 to 2035
  • Table 19: North America Market Value (USD Billion) Forecast by Environment Control, 2020 to 2035
  • Table 20: North America Market Volume (Units) Forecast by Environment Control, 2020 to 2035
  • Table 21: North America Market Value (USD Billion) Forecast by Operator, 2020 to 2035
  • Table 22: North America Market Volume (Units) Forecast by Operator, 2020 to 2035
  • Table 23: North America Market Value (USD Billion) Forecast by Sales Channel, 2020 to 2035
  • Table 24: North America Market Volume (Units) Forecast by Sales Channel, 2020 to 2035
  • Table 25: Latin America Market Value (USD Billion) Forecast by Country, 2020 to 2035
  • Table 26: Latin America Market Volume (Units) Forecast by Country, 2020 to 2035
  • Table 27: Latin America Market Value (USD Billion) Forecast by Platform, 2020 to 2035
  • Table 28: Latin America Market Volume (Units) Forecast by Platform, 2020 to 2035
  • Table 29: Latin America Market Value (USD Billion) Forecast by Crane Type, 2020 to 2035
  • Table 30: Latin America Market Volume (Units) Forecast by Crane Type, 2020 to 2035
  • Table 31: Latin America Market Value (USD Billion) Forecast by Environment Control, 2020 to 2035
  • Table 32: Latin America Market Volume (Units) Forecast by Environment Control, 2020 to 2035
  • Table 33: Latin America Market Value (USD Billion) Forecast by Operator, 2020 to 2035
  • Table 34: Latin America Market Volume (Units) Forecast by Operator, 2020 to 2035
  • Table 35: Latin America Market Value (USD Billion) Forecast by Sales Channel, 2020 to 2035
  • Table 36: Latin America Market Volume (Units) Forecast by Sales Channel, 2020 to 2035
  • Table 37: Western Europe Market Value (USD Billion) Forecast by Country, 2020 to 2035
  • Table 38: Western Europe Market Volume (Units) Forecast by Country, 2020 to 2035
  • Table 39: Western Europe Market Value (USD Billion) Forecast by Platform, 2020 to 2035
  • Table 40: Western Europe Market Volume (Units) Forecast by Platform, 2020 to 2035
  • Table 41: Western Europe Market Value (USD Billion) Forecast by Crane Type, 2020 to 2035
  • Table 42: Western Europe Market Volume (Units) Forecast by Crane Type, 2020 to 2035
  • Table 43: Western Europe Market Value (USD Billion) Forecast by Environment Control, 2020 to 2035
  • Table 44: Western Europe Market Volume (Units) Forecast by Environment Control, 2020 to 2035
  • Table 45: Western Europe Market Value (USD Billion) Forecast by Operator, 2020 to 2035
  • Table 46: Western Europe Market Volume (Units) Forecast by Operator, 2020 to 2035
  • Table 47: Western Europe Market Value (USD Billion) Forecast by Sales Channel, 2020 to 2035
  • Table 48: Western Europe Market Volume (Units) Forecast by Sales Channel, 2020 to 2035
  • Table 49: Eastern Europe Market Value (USD Billion) Forecast by Country, 2020 to 2035
  • Table 50: Eastern Europe Market Volume (Units) Forecast by Country, 2020 to 2035
  • Table 51: Eastern Europe Market Value (USD Billion) Forecast by Platform, 2020 to 2035
  • Table 52: Eastern Europe Market Volume (Units) Forecast by Platform, 2020 to 2035
  • Table 53: Eastern Europe Market Value (USD Billion) Forecast by Crane Type, 2020 to 2035
  • Table 54: Eastern Europe Market Volume (Units) Forecast by Crane Type, 2020 to 2035
  • Table 55: Eastern Europe Market Value (USD Billion) Forecast by Environment Control, 2020 to 2035
  • Table 56: Eastern Europe Market Volume (Units) Forecast by Environment Control, 2020 to 2035
  • Table 57: Eastern Europe Market Value (USD Billion) Forecast by Operator, 2020 to 2035
  • Table 58: Eastern Europe Market Volume (Units) Forecast by Operator, 2020 to 2035
  • Table 59: Eastern Europe Market Value (USD Billion) Forecast by Sales Channel, 2020 to 2035
  • Table 60: Eastern Europe Market Volume (Units) Forecast by Sales Channel, 2020 to 2035
  • Table 61: East Asia Market Value (USD Billion) Forecast by Country, 2020 to 2035
  • Table 62: East Asia Market Volume (Units) Forecast by Country, 2020 to 2035
  • Table 63: East Asia Market Value (USD Billion) Forecast by Platform, 2020 to 2035
  • Table 64: East Asia Market Volume (Units) Forecast by Platform, 2020 to 2035
  • Table 65: East Asia Market Value (USD Billion) Forecast by Crane Type, 2020 to 2035
  • Table 66: East Asia Market Volume (Units) Forecast by Crane Type, 2020 to 2035
  • Table 67: East Asia Market Value (USD Billion) Forecast by Environment Control, 2020 to 2035
  • Table 68: East Asia Market Volume (Units) Forecast by Environment Control, 2020 to 2035
  • Table 69: East Asia Market Value (USD Billion) Forecast by Operator, 2020 to 2035
  • Table 70: East Asia Market Volume (Units) Forecast by Operator, 2020 to 2035
  • Table 71: East Asia Market Value (USD Billion) Forecast by Sales Channel, 2020 to 2035
  • Table 72: East Asia Market Volume (Units) Forecast by Sales Channel, 2020 to 2035
  • Table 73: South Asia & Pacific Market Value (USD Billion) Forecast by Country, 2020 to 2035
  • Table 74: South Asia & Pacific Market Volume (Units) Forecast by Country, 2020 to 2035
  • Table 75: South Asia & Pacific Market Value (USD Billion) Forecast by Platform, 2020 to 2035
  • Table 76: South Asia & Pacific Market Volume (Units) Forecast by Platform, 2020 to 2035
  • Table 77: South Asia & Pacific Market Value (USD Billion) Forecast by Crane Type, 2020 to 2035
  • Table 78: South Asia & Pacific Market Volume (Units) Forecast by Crane Type, 2020 to 2035
  • Table 79: South Asia & Pacific Market Value (USD Billion) Forecast by Environment Control, 2020 to 2035
  • Table 80: South Asia & Pacific Market Volume (Units) Forecast by Environment Control, 2020 to 2035
  • Table 81: South Asia & Pacific Market Value (USD Billion) Forecast by Operator, 2020 to 2035
  • Table 82: South Asia & Pacific Market Volume (Units) Forecast by Operator, 2020 to 2035
  • Table 83: South Asia & Pacific Market Value (USD Billion) Forecast by Sales Channel, 2020 to 2035
  • Table 84: South Asia & Pacific Market Volume (Units) Forecast by Sales Channel, 2020 to 2035
  • Table 85: Middle East and Africa Market Value (USD Billion) Forecast by Country, 2020 to 2035
  • Table 86: Middle East and Africa Market Volume (Units) Forecast by Country, 2020 to 2035
  • Table 87: Middle East and Africa Market Value (USD Billion) Forecast by Platform, 2020 to 2035
  • Table 88: Middle East and Africa Market Volume (Units) Forecast by Platform, 2020 to 2035
  • Table 89: Middle East and Africa Market Value (USD Billion) Forecast by Crane Type, 2020 to 2035
  • Table 90: Middle East and Africa Market Volume (Units) Forecast by Crane Type, 2020 to 2035
  • Table 91: Middle East and Africa Market Value (USD Billion) Forecast by Environment Control, 2020 to 2035
  • Table 92: Middle East and Africa Market Volume (Units) Forecast by Environment Control, 2020 to 2035
  • Table 93: Middle East and Africa Market Value (USD Billion) Forecast by Operator, 2020 to 2035
  • Table 94: Middle East and Africa Market Volume (Units) Forecast by Operator, 2020 to 2035
  • Table 95: Middle East and Africa Market Value (USD Billion) Forecast by Sales Channel, 2020 to 2035
  • Table 96: Middle East and Africa Market Volume (Units) Forecast by Sales Channel, 2020 to 2035

List of Figures

  • Figure 1: Global Market Volume (Units) Forecast 2020 to 2035
  • Figure 2: Global Market Pricing Analysis
  • Figure 3: Global Market Value (USD Billion) Forecast 2020 to 2035
  • Figure 4: Global Market Value Share and BPS Analysis by Platform, 2025 and 2035
  • Figure 5: Global Market Y-o-Y Growth Comparison by Platform, 2025 to 2035
  • Figure 6: Global Market Attractiveness Analysis by Platform
  • Figure 7: Global Market Value Share and BPS Analysis by Crane Type, 2025 and 2035
  • Figure 8: Global Market Y-o-Y Growth Comparison by Crane Type, 2025 to 2035
  • Figure 9: Global Market Attractiveness Analysis by Crane Type
  • Figure 10: Global Market Value Share and BPS Analysis by Environment Control, 2025 and 2035
  • Figure 11: Global Market Y-o-Y Growth Comparison by Environment Control, 2025 to 2035
  • Figure 12: Global Market Attractiveness Analysis by Environment Control
  • Figure 13: Global Market Value Share and BPS Analysis by Operator, 2025 and 2035
  • Figure 14: Global Market Y-o-Y Growth Comparison by Operator, 2025 to 2035
  • Figure 15: Global Market Attractiveness Analysis by Operator
  • Figure 16: Global Market Value Share and BPS Analysis by Sales Channel, 2025 and 2035
  • Figure 17: Global Market Y-o-Y Growth Comparison by Sales Channel, 2025 to 2035
  • Figure 18: Global Market Attractiveness Analysis by Sales Channel
  • Figure 19: Global Market Value (USD Billion) Share and BPS Analysis by Region, 2025 and 2035
  • Figure 20: Global Market Y-o-Y Growth Comparison by Region, 2025 to 2035
  • Figure 21: Global Market Attractiveness Analysis by Region
  • Figure 22: North America Market Incremental $ Opportunity, 2025 to 2035
  • Figure 23: Latin America Market Incremental $ Opportunity, 2025 to 2035
  • Figure 24: Western Europe Market Incremental $ Opportunity, 2025 to 2035
  • Figure 25: Eastern Europe Market Incremental $ Opportunity, 2025 to 2035
  • Figure 26: East Asia Market Incremental $ Opportunity, 2025 to 2035
  • Figure 27: South Asia & Pacific Market Incremental $ Opportunity, 2025 to 2035
  • Figure 28: Middle East and Africa Market Incremental $ Opportunity, 2025 to 2035
  • Figure 29: North America Market Value Share and BPS Analysis by Country, 2025 and 2035
  • Figure 30: North America Market Value Share and BPS Analysis by Platform, 2025 and 2035
  • Figure 31: North America Market Y-o-Y Growth Comparison by Platform, 2025 to 2035
  • Figure 32: North America Market Attractiveness Analysis by Platform
  • Figure 33: North America Market Value Share and BPS Analysis by Crane Type, 2025 and 2035
  • Figure 34: North America Market Y-o-Y Growth Comparison by Crane Type, 2025 to 2035
  • Figure 35: North America Market Attractiveness Analysis by Crane Type
  • Figure 36: North America Market Value Share and BPS Analysis by Environment Control, 2025 and 2035
  • Figure 37: North America Market Y-o-Y Growth Comparison by Environment Control, 2025 to 2035
  • Figure 38: North America Market Attractiveness Analysis by Environment Control
  • Figure 39: North America Market Value Share and BPS Analysis by Operator, 2025 and 2035
  • Figure 40: North America Market Y-o-Y Growth Comparison by Operator, 2025 to 2035
  • Figure 41: North America Market Attractiveness Analysis by Operator
  • Figure 42: North America Market Value Share and BPS Analysis by Sales Channel, 2025 and 2035
  • Figure 43: North America Market Y-o-Y Growth Comparison by Sales Channel, 2025 to 2035
  • Figure 44: North America Market Attractiveness Analysis by Sales Channel
  • Figure 45: Latin America Market Value Share and BPS Analysis by Country, 2025 and 2035
  • Figure 46: Latin America Market Value Share and BPS Analysis by Platform, 2025 and 2035
  • Figure 47: Latin America Market Y-o-Y Growth Comparison by Platform, 2025 to 2035
  • Figure 48: Latin America Market Attractiveness Analysis by Platform
  • Figure 49: Latin America Market Value Share and BPS Analysis by Crane Type, 2025 and 2035
  • Figure 50: Latin America Market Y-o-Y Growth Comparison by Crane Type, 2025 to 2035
  • Figure 51: Latin America Market Attractiveness Analysis by Crane Type
  • Figure 52: Latin America Market Value Share and BPS Analysis by Environment Control, 2025 and 2035
  • Figure 53: Latin America Market Y-o-Y Growth Comparison by Environment Control, 2025 to 2035
  • Figure 54: Latin America Market Attractiveness Analysis by Environment Control
  • Figure 55: Latin America Market Value Share and BPS Analysis by Operator, 2025 and 2035
  • Figure 56: Latin America Market Y-o-Y Growth Comparison by Operator, 2025 to 2035
  • Figure 57: Latin America Market Attractiveness Analysis by Operator
  • Figure 58: Latin America Market Value Share and BPS Analysis by Sales Channel, 2025 and 2035
  • Figure 59: Latin America Market Y-o-Y Growth Comparison by Sales Channel, 2025 to 2035
  • Figure 60: Latin America Market Attractiveness Analysis by Sales Channel
  • Figure 61: Western Europe Market Value Share and BPS Analysis by Country, 2025 and 2035
  • Figure 62: Western Europe Market Value Share and BPS Analysis by Platform, 2025 and 2035
  • Figure 63: Western Europe Market Y-o-Y Growth Comparison by Platform, 2025 to 2035
  • Figure 64: Western Europe Market Attractiveness Analysis by Platform
  • Figure 65: Western Europe Market Value Share and BPS Analysis by Crane Type, 2025 and 2035
  • Figure 66: Western Europe Market Y-o-Y Growth Comparison by Crane Type, 2025 to 2035
  • Figure 67: Western Europe Market Attractiveness Analysis by Crane Type
  • Figure 68: Western Europe Market Value Share and BPS Analysis by Environment Control, 2025 and 2035
  • Figure 69: Western Europe Market Y-o-Y Growth Comparison by Environment Control, 2025 to 2035
  • Figure 70: Western Europe Market Attractiveness Analysis by Environment Control
  • Figure 71: Western Europe Market Value Share and BPS Analysis by Operator, 2025 and 2035
  • Figure 72: Western Europe Market Y-o-Y Growth Comparison by Operator, 2025 to 2035
  • Figure 73: Western Europe Market Attractiveness Analysis by Operator
  • Figure 74: Western Europe Market Value Share and BPS Analysis by Sales Channel, 2025 and 2035
  • Figure 75: Western Europe Market Y-o-Y Growth Comparison by Sales Channel, 2025 to 2035
  • Figure 76: Western Europe Market Attractiveness Analysis by Sales Channel
  • Figure 77: Eastern Europe Market Value Share and BPS Analysis by Country, 2025 and 2035
  • Figure 78: Eastern Europe Market Value Share and BPS Analysis by Platform, 2025 and 2035
  • Figure 79: Eastern Europe Market Y-o-Y Growth Comparison by Platform, 2025 to 2035
  • Figure 80: Eastern Europe Market Attractiveness Analysis by Platform
  • Figure 81: Eastern Europe Market Value Share and BPS Analysis by Crane Type, 2025 and 2035
  • Figure 82: Eastern Europe Market Y-o-Y Growth Comparison by Crane Type, 2025 to 2035
  • Figure 83: Eastern Europe Market Attractiveness Analysis by Crane Type
  • Figure 84: Eastern Europe Market Value Share and BPS Analysis by Environment Control, 2025 and 2035
  • Figure 85: Eastern Europe Market Y-o-Y Growth Comparison by Environment Control, 2025 to 2035
  • Figure 86: Eastern Europe Market Attractiveness Analysis by Environment Control
  • Figure 87: Eastern Europe Market Value Share and BPS Analysis by Operator, 2025 and 2035
  • Figure 88: Eastern Europe Market Y-o-Y Growth Comparison by Operator, 2025 to 2035
  • Figure 89: Eastern Europe Market Attractiveness Analysis by Operator
  • Figure 90: Eastern Europe Market Value Share and BPS Analysis by Sales Channel, 2025 and 2035
  • Figure 91: Eastern Europe Market Y-o-Y Growth Comparison by Sales Channel, 2025 to 2035
  • Figure 92: Eastern Europe Market Attractiveness Analysis by Sales Channel
  • Figure 93: East Asia Market Value Share and BPS Analysis by Country, 2025 and 2035
  • Figure 94: East Asia Market Value Share and BPS Analysis by Platform, 2025 and 2035
  • Figure 95: East Asia Market Y-o-Y Growth Comparison by Platform, 2025 to 2035
  • Figure 96: East Asia Market Attractiveness Analysis by Platform
  • Figure 97: East Asia Market Value Share and BPS Analysis by Crane Type, 2025 and 2035
  • Figure 98: East Asia Market Y-o-Y Growth Comparison by Crane Type, 2025 to 2035
  • Figure 99: East Asia Market Attractiveness Analysis by Crane Type
  • Figure 100: East Asia Market Value Share and BPS Analysis by Environment Control, 2025 and 2035
  • Figure 101: East Asia Market Y-o-Y Growth Comparison by Environment Control, 2025 to 2035
  • Figure 102: East Asia Market Attractiveness Analysis by Environment Control
  • Figure 103: East Asia Market Value Share and BPS Analysis by Operator, 2025 and 2035
  • Figure 104: East Asia Market Y-o-Y Growth Comparison by Operator, 2025 to 2035
  • Figure 105: East Asia Market Attractiveness Analysis by Operator
  • Figure 106: East Asia Market Value Share and BPS Analysis by Sales Channel, 2025 and 2035
  • Figure 107: East Asia Market Y-o-Y Growth Comparison by Sales Channel, 2025 to 2035
  • Figure 108: East Asia Market Attractiveness Analysis by Sales Channel
  • Figure 109: South Asia & Pacific Market Value Share and BPS Analysis by Country, 2025 and 2035
  • Figure 110: South Asia & Pacific Market Value Share and BPS Analysis by Platform, 2025 and 2035
  • Figure 111: South Asia & Pacific Market Y-o-Y Growth Comparison by Platform, 2025 to 2035
  • Figure 112: South Asia & Pacific Market Attractiveness Analysis by Platform
  • Figure 113: South Asia & Pacific Market Value Share and BPS Analysis by Crane Type, 2025 and 2035
  • Figure 114: South Asia & Pacific Market Y-o-Y Growth Comparison by Crane Type, 2025 to 2035
  • Figure 115: South Asia & Pacific Market Attractiveness Analysis by Crane Type
  • Figure 116: South Asia & Pacific Market Value Share and BPS Analysis by Environment Control, 2025 and 2035
  • Figure 117: South Asia & Pacific Market Y-o-Y Growth Comparison by Environment Control, 2025 to 2035
  • Figure 118: South Asia & Pacific Market Attractiveness Analysis by Environment Control
  • Figure 119: South Asia & Pacific Market Value Share and BPS Analysis by Operator, 2025 and 2035
  • Figure 120: South Asia & Pacific Market Y-o-Y Growth Comparison by Operator, 2025 to 2035
  • Figure 121: South Asia & Pacific Market Attractiveness Analysis by Operator
  • Figure 122: South Asia & Pacific Market Value Share and BPS Analysis by Sales Channel, 2025 and 2035
  • Figure 123: South Asia & Pacific Market Y-o-Y Growth Comparison by Sales Channel, 2025 to 2035
  • Figure 124: South Asia & Pacific Market Attractiveness Analysis by Sales Channel
  • Figure 125: Middle East and Africa Market Value Share and BPS Analysis by Country, 2025 and 2035
  • Figure 126: Middle East and Africa Market Value Share and BPS Analysis by Platform, 2025 and 2035
  • Figure 127: Middle East and Africa Market Y-o-Y Growth Comparison by Platform, 2025 to 2035
  • Figure 128: Middle East and Africa Market Attractiveness Analysis by Platform
  • Figure 129: Middle East and Africa Market Value Share and BPS Analysis by Crane Type, 2025 and 2035
  • Figure 130: Middle East and Africa Market Y-o-Y Growth Comparison by Crane Type, 2025 to 2035
  • Figure 131: Middle East and Africa Market Attractiveness Analysis by Crane Type
  • Figure 132: Middle East and Africa Market Value Share and BPS Analysis by Environment Control, 2025 and 2035
  • Figure 133: Middle East and Africa Market Y-o-Y Growth Comparison by Environment Control, 2025 to 2035
  • Figure 134: Middle East and Africa Market Attractiveness Analysis by Environment Control
  • Figure 135: Middle East and Africa Market Value Share and BPS Analysis by Operator, 2025 and 2035
  • Figure 136: Middle East and Africa Market Y-o-Y Growth Comparison by Operator, 2025 to 2035
  • Figure 137: Middle East and Africa Market Attractiveness Analysis by Operator
  • Figure 138: Middle East and Africa Market Value Share and BPS Analysis by Sales Channel, 2025 and 2035
  • Figure 139: Middle East and Africa Market Y-o-Y Growth Comparison by Sales Channel, 2025 to 2035
  • Figure 140: Middle East and Africa Market Attractiveness Analysis by Sales Channel
  • Figure 141: Global Market - Tier Structure Analysis
  • Figure 142: Global Market - Company Share Analysis

Frequently Asked Questions

What is the current valuation of the crane cabin market?

The market is valued at USD 1.6 billion in 2025.

What is the projected growth rate for the crane cabin market?

The market is expected to expand at a CAGR of 3.1% from 2025 to 2035.

Which crane type holds the largest share in the crane cabin market?

Mobile cranes dominate with a 31% market share in 2025.

Which environment control segment leads the crane cabin market?

Standard systems hold the top position with 42% share in 2025.

Which country is witnessing the fastest growth in the crane cabin market?

Turkiye is the fastest-growing country with a CAGR of 6.2% through 2035.

Explore Similar Insights

Future Market Insights

Crane Cabin Market