Stacker Crane Market Outlook 2025 to 2035

The stacker crane market is projected to grow significantly over the forecast period, with an estimated CAGR of 7.7% until 2035, reaching USD 2,689 million in 2035 from USD 1,280.6 million in 2025.
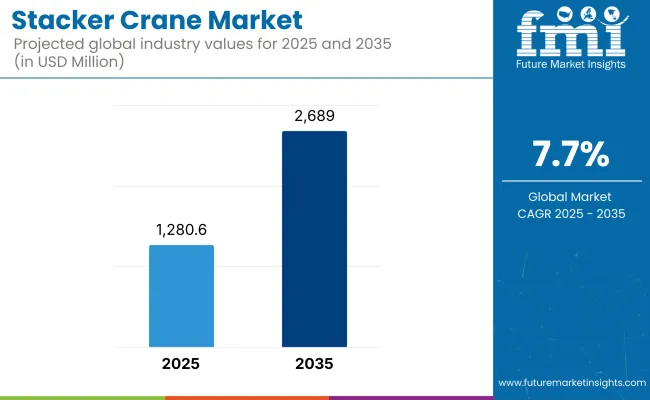
The stacker crane market is projected to witness strong growth over the next ten years owing to the implementation of automated storage and retrieval system (ASRSs) in many end-use industries. Stacker cranes are now a part of modern logistics solutions as companies look to enhance their efficiency while optimizing storage space in both warehousing and material handling.

Stacker Crane Market Projected Global Industry Values For 2025 2035

As e-commerce activities increase and require quick and precise order execution, the need for automated systems that effectively serve this purpose has also increased. Additionally the intravenous use of implementing new innovative technology with Internet of Things (IoT) and robotics with stacker cranes is expected to add functionality as well as value globally to stacker crane technology in the world market.

Regional Market Trends

North America

North America being one among the major contributor for the stacker crane market as the region has a sufficient developed logistics and warehousing infrastructure. The coexistence of major e-commerce and retail players along with the rapid expansion of the regional automotive industry are deliberate contributing factors anticipated to further drive the adoption of stacker cranes. Notably, the USA market is expected to grow at a considerable CAGR throughout the forecast period.

Europe

The stacker crane market in Europe is gradually growing, aided by the region's focus on automation, and efficiency in material handling. Germany, France, and the UK are pioneering with a lot of manufacturing and logistics companies investing in automated solutions. Another factor for the growth of stacker cranes in the region is the local government focus towards sustainability and reduction of operational costs.

Asia-Pacific

Asia-Pacific is anticipated to record the most rapid growth, driven by rapid industrialization and growth of e-commerce. China, India, and several other countries are investing heavily in manufacturing & logistics infrastructure, which is driving the demand for cost-effective material handling solutions such as stacker cranes. Market growth is further propelled by increasing population and consumer demand in the region.

Challenges and Opportunities

Challenges

High Capital Investment, Retrofit Limitations, and Skilled Labor Dependency

High initial investment and complex infrastructure requirements have always been one of the prominent challenges for the stacker crane market, resulting in a slow adoption rate from small to mid-sized warehouses. Incorporating stacker cranes into traditional warehouse modules can be challenging, mainly requiring structural changes and sophisticated warehouse control system (WCS).

Moreover, the operation in a smooth flow is highly reliant on trained technicians and warehouse automating experts which causes labor and operational bottlenecks especially in geographical locations where there are limited automation knowledge.

Opportunities

E-commerce Expansion, Smart Warehousing, and Vertical Space Optimization

The stacker crane market is undergoing rapid growth due to a global shift towards automated storage and retrieval systems (AS/RS), especially in e-commerce fulfillment centres, cold chain logistics and industrial manufacturing, despite these hindrances. space-constrained warehouses, Stackers cranes are vertical space optimizers making them a chosen solution.

With the emergence of smart warehousing solutions, opportunities are rising, where stacker cranes are integrated with IoT sensors, AI algorithms and WMS/WCS platforms to facilitate precision inventory handling, real-time tracking and energy-efficient movement.

Legitimately, the push for temperature-resilient, rapid stacker crane systems will pressure cold storage automation in pharmaceuticals and frozen food logistics. In addition, industries are looking for dual-deep and multi-deep configurations to increase throughput and storage density while enabling larger volumes in minimal facility footprints.

Shifts in the Market from 2020 to 2024 and Future Trends 2025 to 2035

The pandemic was a major selling point for the market between 2020 and 2024 as in 2020 labor shortages, supply chain digitization and warehouse boom for e-commerce ensured increased adoption. Supply chain delays and semiconductor shortages slowed the high-end automation solution deployments in some regions, however.

Between 2025 and 2035, energy-efficient AI-optimized stacker cranes offering enhanced predictive maintenance, adaptive speed controls, and seamless integration with warehouse robotics will dominate the market. More focus and specification will centre around modular crane systems offering scalability, low-noise operation and multi-temperature zone compatibility, giving a robust response to the emerging demands of evolving Omni channel supply chains.

Market Shifts: A Comparative Analysis 2020 to 2024 vs. 2025 to 2035

Market Shift 2020 to 2024 Trends
Regulatory Landscape Focus on workplace safety and automated equipment compliance
Consumer Trends Adoption in retail distribution, consumer goods, and basic warehousing
Industry Adoption Implemented in high-volume e-commerce and logistics networks
Supply Chain and Sourcing Dependent on steel, motors, and basic control systems
Market Competition Led by AS/RS vendors and warehouse integrators
Market Growth Drivers Boosted by space-saving needs and labor shortages
Sustainability and Environmental Impact Growing interest in energy recovery systems and carbon audits
Integration of Smart Technologies Basic HMI and sensor-based motion control
Advancements in Crane Design Single-mast and dual-mast systems with wired control
Market Shift 2025 to 2035 Projections
Regulatory Landscape Expansion of AI-powered system validation, warehouse automation safety codes
Consumer Trends Increased use in cold storage, pharmaceuticals, and smart manufacturing hubs
Industry Adoption Broader adoption in multi-tiered storage, green warehouses, and hybrid automation ecosystems
Supply Chain and Sourcing Integration of AI chips, modular robotic arms, and cloud-based inventory platforms
Market Competition Entry of AI-driven warehouse tech firms and autonomous material handling startups
Market Growth Drivers Accelerated by hyperlocal fulfillment, ESG goals, and warehouse-as-a-service platforms
Sustainability and Environmental Impact Widespread use of low-power servo systems, regenerative braking, and recyclable crane materials
Integration of Smart Technologies Transition to predictive load balancing, AI-enabled pathfinding, and blockchain inventory logs
Advancements in Crane Design Adoption of multi-axis autonomous cranes, remote diagnostics, and battery-powered mobile cranes

Country-Wise Outlook

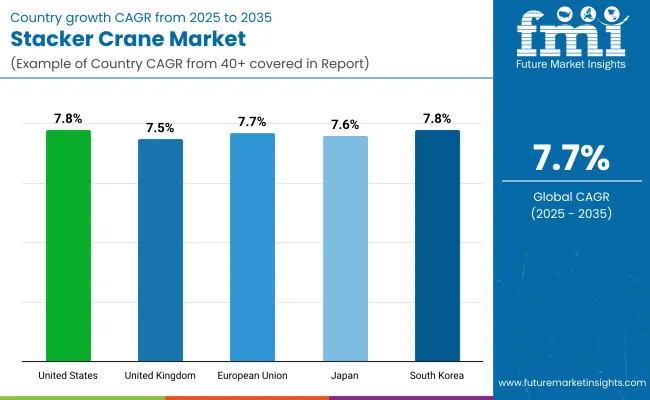
United States

Advanced e-commerce logistics, growing cold storage capacity, and strong investment in automated fulfillment infrastructure leave the USA market in the global lead. Large retailers and 3PLs are (re)deploying stacker cranes at high-density storage centers, for multi-temperature goods and last-mile hubs.

Country CAGR (2025 to 2035)
USA 7.8%

United Kingdom

In the UK demand is fueled by urban micro-fulfillment centers, healthcare logistics, and post-Brexit supply chain restructuring. Features such as dual-deep stacker cranes in vertical constructed warehouses, and modular crane units in tighter city facilities are seeing increased acceptance.

Country CAGR (2025 to 2035)
UK 7.5%

European Union

Industry 4.0 and green logistics initiatives are driving EU nations to ramp up smart warehouse infrastructure. Union German, France, and Netherlands are merging stacker cranes with AGVs and AI-enabled WMS systems, particularly in aerospace, chemicals, and precision parts storage.

Country CAGR (2025 to 2035)
EU 7.7%

Japan

For example, Japan’s automation-first manufacturing ecosystem has contributed to the high adoption of compact, high-speed stacker cranes for electronics, automotive, and pharmaceutical storage. Due to recovery from the pandemic, there are now space constraints and real estate costs at a premium, and manufacturers are leveraging vertical automation with multi-level stacker crane systems.

Country CAGR (2025 to 2035)
Japan 7.6%

South Korea

South Korea is riding to the forefront of automated cold chain and semiconductor warehousing, where the stacker crane allows for concurrent high-frequency inventory moves in real-time. The government is actively supporting smart factory development and logistics tech startups, which is stimulating the deployment of crane systems.

Country CAGR (2025 to 2035)
South Korea 7.8%

Segmentation Outlook – Stacker Crane Market

Automatic systems and e-commerce end use drive market demand through warehouse efficiency, high throughput, and labor cost reduction

Warehouse automation, alignment to just-in-time delivery models and a focus on space optimization for overall efficiency of the supply chain is driving the growth of the stacker crane market steadily. Stacker cranes are found in automated storage and retrieval systems (AS/RS) for accurate handling of pallets and containers in high-density storage environments.

When it comes to configurations, automatic operation types and e-commerce/retail applications have the maximum market share because their unmatched speed, scalability, and the contribution in supporting 24/7 distribution models.

These segments improve operational performance, minimize human error, and assist peak demand cycles. Motivated by the demand for real-time inventory tracking, shorter order fulfillment times, and lower labor costs, stacker cranes have become a key component of warehousing facility modernization across industries. Their optimization of vertical storage in smaller footprints is especially advantageous for e-commerce fulfillment centers and large retail distributors.
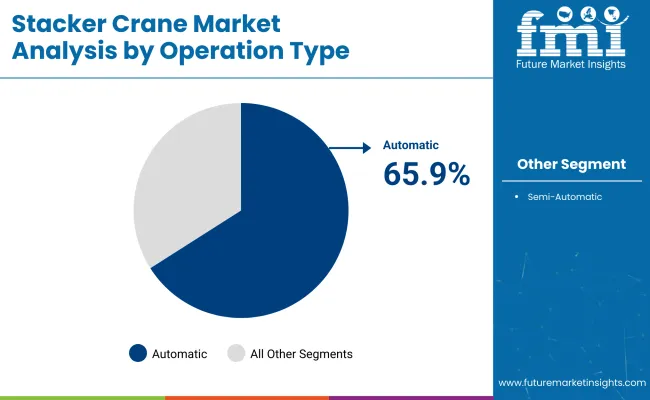
Automatic stacker cranes gain traction due to high-speed operation, system integration, and autonomous handling

Operation Type Market Share (2025)
Automatic 65.9%

The Narrow Aisle Stacker Crane Market has been further segmented into Electric Stacker Crane and Automatic Stacker Crane. These cranes also work in unison with warehouse management systems (WMS), conveyors and robotic palletizing lines to support rapid-speed, accurate, and lights-out operation in the distribution centers of today. In multi-shift environments, in high-volume facilities, and in cold storage where it is impractical or inefficient to have humans operate a system, automatic systems provide significant advantages.

The accuracy and speed with which they handle pallets, totes or cartons substantially reduces breakage and misplacement but significantly improves cycle time. Multi-deep storage capabilities, flexible load handling devices, and energy efficient drive systems continue to be developed by the vendors.

Labor supply shortages continue to impact companies, while service-level expectations grow; automatic stacker cranes continue to top the most sought after investments for warehouses looking to future-proof their operations. They still exist in lower-volume or hybrid facilities with semi-automatic systems, but their market share is decreasing and is where we begin to identify fully automated solutions.
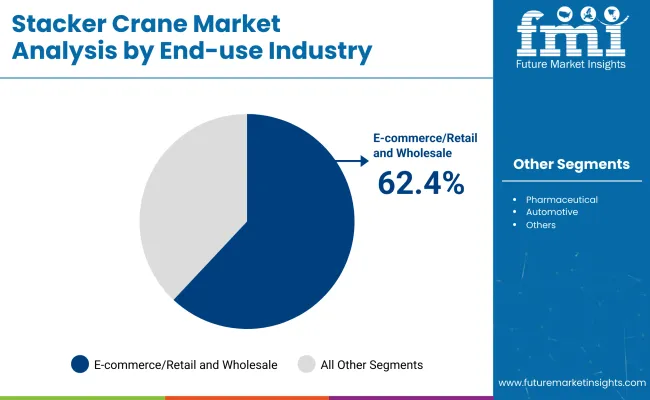
E-commerce/retail and wholesale sectors drive market use through fast order fulfillment, space utilization, and inventory accuracy

End-use Industry Market Share (2025)
E-commerce/Retail and Wholesale 62.4%

E-commerce, retail, and wholesale are the most prominent application segments for stacker cranes as consumers today expect their orders to be delivered quickly, accurately, and with track-and-trace capabilities. Stacker cranes are used in these industries to handle the rise of SKU diversity, seasonality and volume of orders efficiently. The implementation of a stacker crane allows for live inventory updates, integration with picking manufacturers and proposed scalable use in ambient and temperature-controlled settings.

In retail fulfillment centers, they enable the next-day and same-day delivery set by standards based on quick replenishment and automated dispatch. The high-load stacker cranes specially built for the wholesale sector, in particular, FMCG and bulk goods, which help reduce the labor dependence and use cubic of storage space to the maximum.

Automated cranes also assist in managing inventory, reducing stock shrinkage and improving traceability. Consumer goods applications remain a leading driver of demand in packaging and beverage facilities, but the dynamic nature and volume pressures present in e-commerce keeps this sector at the front of the adoption queue.

Competitive Outlook

The growing demand for automated warehousing, cold storage, e-commerce, and manufacturing sectors are driving significant growth for the stacker crane market. The demand for high-density storage, real-time inventory tracking, and space optimization is leading to innovative multi-deep, telescopic and robotic stacker crane systems.

Those investments include AI-based navigation, hybrid cranes to handle pallets and totes, and energy-efficient lifting mechanisms. Vertical scalability, WMS integration, and low-maintenance operation remain the most important focal points for intralogistics providers and automation technology makers.

Market Share Analysis by Key Players & Stacker Crane Providers

Company Name Estimated Market Share (%)
Daifuku Co., Ltd. 14–18%
SSI SCHAEFER Group 12–16%
Murata Machinery, Ltd. 10–14%
Swisslog Holding AG (KUKA) 8–12%
TGW Logistics Group 6–9%
Other Stacker Crane Providers 30–40%

Key Company & Stacker Crane Market Solutions

Company Name Key Offerings/Activities
Daifuku Co., Ltd. In 2024, launched the Shuttle Rack M system with advanced AI routing for multi-level pallet handling; in 2025, unveiled energy-regenerative hoist drives to reduce warehouse power consumption.
SSI SCHAEFER Group Introduced Exyz® 2.0 stacker crane in 2024 with modular design for deep-freeze and ambient zones; in 2025, added real-time diagnostics via WAMAS® software integration.
Murata Machinery, Ltd. Released high-speed Uni-Shuttle G in 2024 for mixed-case handling; in 2025, developed dual-mast stacker cranes with precision vision sensors for automated replenishment.
Swisslog Holding AG (KUKA) Upgraded its Vectura stacker crane series in 2024 with lightweight carbon fiber booms; in 2025, integrated SynQ platform with predictive maintenance and robotics orchestration.
TGW Logistics Group Debuted Mustang Evo X in 2024 for high-throughput tote handling; in 2025, launched hybrid pallet-tote cranes with multiformat compatibility and energy-saving drives.

Key Market Insights

Daifuku Co., Ltd. (14-18%)

Daifuku continues to lead global automation with its AI-enhanced, energy-efficient crane systems. Its 2024–2025 innovations address sustainability and high-throughput needs across manufacturing and retail distribution.

SSI SCHAEFER Group (12-16%)

SSI SCHAEFER’s modular Exyz® line and WAMAS® integration strengthen its presence in temperature-controlled and multilevel storage. Its 2025 software-driven enhancements reinforce intelligent crane operation.

Murata Machinery, Ltd. (10-14%)

Murata stands out for its precision and adaptability. The 2024–2025 systems provide fast, stable movement in mixed-load applications, supporting both high-volume retail and just-in-time industrial environments.

Swisslog Holding AG (KUKA) (8-12%)

Swisslog leverages robotics and lightweight materials for performance and flexibility. The 2025 orchestration tools and Vectura updates position it as a key provider for modern e-commerce fulfillment hubs.

TGW Logistics Group (6-9%)

TGW’s hybrid solutions address increasing diversity in warehouse inventory. Its 2024–2025 models deliver format-agnostic handling with high energy efficiency and vertical reach.

Other Key Players (30-40% Combined)

Numerous regional integrators and automation providers are expanding the market with sector-specific stacker crane solutions. These include:

  • Dematic (KION Group)-Automated crane systems integrated with AS/RS and AGV platforms
  • Mecalux S.A.- Pallet racking and stacker cranes tailored for mid-size logistics centers
  • Vanderlande Industries-Stacker cranes for cold chain and omni-channel distribution hubs
  • Westfalia Technologies-Satellite and deep-lane stacker cranes with load-handling attachments
  • SAVOYE-Compact stacker crane systems designed for small-item and pharma warehousing

Key Segmentation

By Operation Type:

  • Semi-automatic
  • Automatic

By End-use Industry:

  • Consumer Goods
  • E-commerce/Retail and Wholesale
  • Pharmaceutical
  • Automotive
  • Others

By Application:

  • Autostart
  • Early Baggage Storage
  • Sortation System
  • Robotized Order Preparation

By Type:

  • Single Column
  • Double Column

By Region:

  • North America
  • Latin America
  • Western Europe
  • Eastern Europe
  • East Asia
  • South Asia Pacific
  • Middle East and Africa

Table of Content

  1. Executive Summary
  2. Industry Introduction, including Taxonomy and Market Definition
  3. Market Trends and Success Factors, including Macro-economic Factors, Market Dynamics, and Recent Industry Developments
  4. Global Market Demand Analysis 2020 to 2024 and Forecast 2025 to 2035, including Historical Analysis and Future Projections
  5. Pricing Analysis
  6. Global Market Analysis 2020 to 2024 and Forecast 2025 to 2035
    • Operation Type
    • End-use Industry
    • Application
    • Type
  7. Global Market Analysis 2020 to 2024 and Forecast 2025 to 2035, By Operation Type
    • Semi-automatic
    • Automatic
  8. Global Market Analysis 2020 to 2024 and Forecast 2025 to 2035, By End-use Industry
    • Consumer Goods
    • E-commerce/Retail and Wholesale
    • Pharmaceutical
    • Automotive
  9. Global Market Analysis 2020 to 2024 and Forecast 2025 to 2035, By Application
    • Autostart
    • Early Baggage Storage
    • Sortation System
    • Robotized Order Preparation
  10. Global Market Analysis 2020 to 2024 and Forecast 2025 to 2035, By Type
    • Single Column
    • Double Column
  11. Global Market Analysis 2020 to 2024 and Forecast 2025 to 2035, By Region
    • North America
    • Latin America
    • Western Europe
    • Eastern Europe
    • East Asia
    • South Asia Pacific
    • Middle East and Africa
  12. North America Sales Analysis 2020 to 2024 and Forecast 2025 to 2035, by Key Segments and Countries
  13. Latin America Sales Analysis 2020 to 2024 and Forecast 2025 to 2035, by Key Segments and Countries
  14. Western Europe Sales Analysis 2020 to 2024 and Forecast 2025 to 2035, by Key Segments and Countries
  15. Eastern Europe Sales Analysis 2020 to 2024 and Forecast 2025 to 2035, by Key Segments and Countries
  16. East Asia Sales Analysis 2020 to 2024 and Forecast 2025 to 2035, by Key Segments and Countries
  17. South Asia Pacific Sales Analysis 2020 to 2024 and Forecast 2025 to 2035, by Key Segments and Countries
  18. Middle East and Africa Sales Analysis 2020 to 2024 and Forecast 2025 to 2035, by Key Segments and Countries
  19. Sales Forecast 2025 to 2035 by Operation Type, End-use Industry, Application, and Type for 30 Countries
  20. Competition Outlook, including Market Structure Analysis, Company Share Analysis by Key Players, and Competition Dashboard
  21. Company Profile
    • KION GROUP AG
    • Doosan Corporation
    • Ssi Schaefer
    • Swisslog Holding AG
    • Murata Machinery, Ltd.
    • Hyster-Yale Materials Handling, Inc.
    • Jungheinrich AG
    • MITSUBISHI LOGISNEXT CO., LTD.
    • TOYOTA INDUSTRIES CORPORATION
    • Vanderlande Industries B.V.

List of Tables

Table 1: Global Market Value (US$ Million) Forecast by Region, 2017 to 2033

Table 2: Global Market Volume (Units) Forecast by Region, 2017 to 2033

Table 3: Global Market Value (US$ Million) Forecast by Operation Type, 2017 to 2033

Table 4: Global Market Volume (Units) Forecast by Operation Type, 2017 to 2033

Table 5: Global Market Value (US$ Million) Forecast by End-use Industry, 2017 to 2033

Table 6: Global Market Volume (Units) Forecast by End-use Industry, 2017 to 2033

Table 7: Global Market Value (US$ Million) Forecast by Application, 2017 to 2033

Table 8: Global Market Volume (Units) Forecast by Application, 2017 to 2033

Table 9: Global Market Value (US$ Million) Forecast by Type, 2017 to 2033

Table 10: Global Market Volume (Units) Forecast by Type, 2017 to 2033

Table 11: North America Market Value (US$ Million) Forecast by Country, 2017 to 2033

Table 12: North America Market Volume (Units) Forecast by Country, 2017 to 2033

Table 13: North America Market Value (US$ Million) Forecast by Operation Type, 2017 to 2033

Table 14: North America Market Volume (Units) Forecast by Operation Type, 2017 to 2033

Table 15: North America Market Value (US$ Million) Forecast by End-use Industry, 2017 to 2033

Table 16: North America Market Volume (Units) Forecast by End-use Industry, 2017 to 2033

Table 17: North America Market Value (US$ Million) Forecast by Application, 2017 to 2033

Table 18: North America Market Volume (Units) Forecast by Application, 2017 to 2033

Table 19: North America Market Value (US$ Million) Forecast by Type, 2017 to 2033

Table 20: North America Market Volume (Units) Forecast by Type, 2017 to 2033

Table 21: Latin America Market Value (US$ Million) Forecast by Country, 2017 to 2033

Table 22: Latin America Market Volume (Units) Forecast by Country, 2017 to 2033

Table 23: Latin America Market Value (US$ Million) Forecast by Operation Type, 2017 to 2033

Table 24: Latin America Market Volume (Units) Forecast by Operation Type, 2017 to 2033

Table 25: Latin America Market Value (US$ Million) Forecast by End-use Industry, 2017 to 2033

Table 26: Latin America Market Volume (Units) Forecast by End-use Industry, 2017 to 2033

Table 27: Latin America Market Value (US$ Million) Forecast by Application, 2017 to 2033

Table 28: Latin America Market Volume (Units) Forecast by Application, 2017 to 2033

Table 29: Latin America Market Value (US$ Million) Forecast by Type, 2017 to 2033

Table 30: Latin America Market Volume (Units) Forecast by Type, 2017 to 2033

Table 31: Europe Market Value (US$ Million) Forecast by Country, 2017 to 2033

Table 32: Europe Market Volume (Units) Forecast by Country, 2017 to 2033

Table 33: Europe Market Value (US$ Million) Forecast by Operation Type, 2017 to 2033

Table 34: Europe Market Volume (Units) Forecast by Operation Type, 2017 to 2033

Table 35: Europe Market Value (US$ Million) Forecast by End-use Industry, 2017 to 2033

Table 36: Europe Market Volume (Units) Forecast by End-use Industry, 2017 to 2033

Table 37: Europe Market Value (US$ Million) Forecast by Application, 2017 to 2033

Table 38: Europe Market Volume (Units) Forecast by Application, 2017 to 2033

Table 39: Europe Market Value (US$ Million) Forecast by Type, 2017 to 2033

Table 40: Europe Market Volume (Units) Forecast by Type, 2017 to 2033

Table 41: Asia Pacific Market Value (US$ Million) Forecast by Country, 2017 to 2033

Table 42: Asia Pacific Market Volume (Units) Forecast by Country, 2017 to 2033

Table 43: Asia Pacific Market Value (US$ Million) Forecast by Operation Type, 2017 to 2033

Table 44: Asia Pacific Market Volume (Units) Forecast by Operation Type, 2017 to 2033

Table 45: Asia Pacific Market Value (US$ Million) Forecast by End-use Industry, 2017 to 2033

Table 46: Asia Pacific Market Volume (Units) Forecast by End-use Industry, 2017 to 2033

Table 47: Asia Pacific Market Value (US$ Million) Forecast by Application, 2017 to 2033

Table 48: Asia Pacific Market Volume (Units) Forecast by Application, 2017 to 2033

Table 49: Asia Pacific Market Value (US$ Million) Forecast by Type, 2017 to 2033

Table 50: Asia Pacific Market Volume (Units) Forecast by Type, 2017 to 2033

Table 51: Middle East and Africa Market Value (US$ Million) Forecast by Country, 2017 to 2033

Table 52: Middle East and Africa Market Volume (Units) Forecast by Country, 2017 to 2033

Table 53: Middle East and Africa Market Value (US$ Million) Forecast by Operation Type, 2017 to 2033

Table 54: Middle East and Africa Market Volume (Units) Forecast by Operation Type, 2017 to 2033

Table 55: Middle East and Africa Market Value (US$ Million) Forecast by End-use Industry, 2017 to 2033

Table 56: Middle East and Africa Market Volume (Units) Forecast by End-use Industry, 2017 to 2033

Table 57: Middle East and Africa Market Value (US$ Million) Forecast by Application, 2017 to 2033

Table 58: Middle East and Africa Market Volume (Units) Forecast by Application, 2017 to 2033

Table 59: Middle East and Africa Market Value (US$ Million) Forecast by Type, 2017 to 2033

Table 60: Middle East and Africa Market Volume (Units) Forecast by Type, 2017 to 2033

List of Figures

Figure 1: Global Market Value (US$ Million) by Operation Type, 2023 to 2033

Figure 2: Global Market Value (US$ Million) by End-use Industry, 2023 to 2033

Figure 3: Global Market Value (US$ Million) by Application, 2023 to 2033

Figure 4: Global Market Value (US$ Million) by Type, 2023 to 2033

Figure 5: Global Market Value (US$ Million) by Region, 2023 to 2033

Figure 6: Global Market Value (US$ Million) Analysis by Region, 2017 to 2033

Figure 7: Global Market Volume (Units) Analysis by Region, 2017 to 2033

Figure 8: Global Market Value Share (%) and BPS Analysis by Region, 2023 to 2033

Figure 9: Global Market Y-o-Y Growth (%) Projections by Region, 2023 to 2033

Figure 10: Global Market Value (US$ Million) Analysis by Operation Type, 2017 to 2033

Figure 11: Global Market Volume (Units) Analysis by Operation Type, 2017 to 2033

Figure 12: Global Market Value Share (%) and BPS Analysis by Operation Type, 2023 to 2033

Figure 13: Global Market Y-o-Y Growth (%) Projections by Operation Type, 2023 to 2033

Figure 14: Global Market Value (US$ Million) Analysis by End-use Industry, 2017 to 2033

Figure 15: Global Market Volume (Units) Analysis by End-use Industry, 2017 to 2033

Figure 16: Global Market Value Share (%) and BPS Analysis by End-use Industry, 2023 to 2033

Figure 17: Global Market Y-o-Y Growth (%) Projections by End-use Industry, 2023 to 2033

Figure 18: Global Market Value (US$ Million) Analysis by Application, 2017 to 2033

Figure 19: Global Market Volume (Units) Analysis by Application, 2017 to 2033

Figure 20: Global Market Value Share (%) and BPS Analysis by Application, 2023 to 2033

Figure 21: Global Market Y-o-Y Growth (%) Projections by Application, 2023 to 2033

Figure 22: Global Market Value (US$ Million) Analysis by Type, 2017 to 2033

Figure 23: Global Market Volume (Units) Analysis by Type, 2017 to 2033

Figure 24: Global Market Value Share (%) and BPS Analysis by Type, 2023 to 2033

Figure 25: Global Market Y-o-Y Growth (%) Projections by Type, 2023 to 2033

Figure 26: Global Market Attractiveness by Operation Type, 2023 to 2033

Figure 27: Global Market Attractiveness by End-use Industry, 2023 to 2033

Figure 28: Global Market Attractiveness by Application, 2023 to 2033

Figure 29: Global Market Attractiveness by Type, 2023 to 2033

Figure 30: Global Market Attractiveness by Region, 2023 to 2033

Figure 31: North America Market Value (US$ Million) by Operation Type, 2023 to 2033

Figure 32: North America Market Value (US$ Million) by End-use Industry, 2023 to 2033

Figure 33: North America Market Value (US$ Million) by Application, 2023 to 2033

Figure 34: North America Market Value (US$ Million) by Type, 2023 to 2033

Figure 35: North America Market Value (US$ Million) by Country, 2023 to 2033

Figure 36: North America Market Value (US$ Million) Analysis by Country, 2017 to 2033

Figure 37: North America Market Volume (Units) Analysis by Country, 2017 to 2033

Figure 38: North America Market Value Share (%) and BPS Analysis by Country, 2023 to 2033

Figure 39: North America Market Y-o-Y Growth (%) Projections by Country, 2023 to 2033

Figure 40: North America Market Value (US$ Million) Analysis by Operation Type, 2017 to 2033

Figure 41: North America Market Volume (Units) Analysis by Operation Type, 2017 to 2033

Figure 42: North America Market Value Share (%) and BPS Analysis by Operation Type, 2023 to 2033

Figure 43: North America Market Y-o-Y Growth (%) Projections by Operation Type, 2023 to 2033

Figure 44: North America Market Value (US$ Million) Analysis by End-use Industry, 2017 to 2033

Figure 45: North America Market Volume (Units) Analysis by End-use Industry, 2017 to 2033

Figure 46: North America Market Value Share (%) and BPS Analysis by End-use Industry, 2023 to 2033

Figure 47: North America Market Y-o-Y Growth (%) Projections by End-use Industry, 2023 to 2033

Figure 48: North America Market Value (US$ Million) Analysis by Application, 2017 to 2033

Figure 49: North America Market Volume (Units) Analysis by Application, 2017 to 2033

Figure 50: North America Market Value Share (%) and BPS Analysis by Application, 2023 to 2033

Figure 51: North America Market Y-o-Y Growth (%) Projections by Application, 2023 to 2033

Figure 52: North America Market Value (US$ Million) Analysis by Type, 2017 to 2033

Figure 53: North America Market Volume (Units) Analysis by Type, 2017 to 2033

Figure 54: North America Market Value Share (%) and BPS Analysis by Type, 2023 to 2033

Figure 55: North America Market Y-o-Y Growth (%) Projections by Type, 2023 to 2033

Figure 56: North America Market Attractiveness by Operation Type, 2023 to 2033

Figure 57: North America Market Attractiveness by End-use Industry, 2023 to 2033

Figure 58: North America Market Attractiveness by Application, 2023 to 2033

Figure 59: North America Market Attractiveness by Type, 2023 to 2033

Figure 60: North America Market Attractiveness by Country, 2023 to 2033

Figure 61: Latin America Market Value (US$ Million) by Operation Type, 2023 to 2033

Figure 62: Latin America Market Value (US$ Million) by End-use Industry, 2023 to 2033

Figure 63: Latin America Market Value (US$ Million) by Application, 2023 to 2033

Figure 64: Latin America Market Value (US$ Million) by Type, 2023 to 2033

Figure 65: Latin America Market Value (US$ Million) by Country, 2023 to 2033

Figure 66: Latin America Market Value (US$ Million) Analysis by Country, 2017 to 2033

Figure 67: Latin America Market Volume (Units) Analysis by Country, 2017 to 2033

Figure 68: Latin America Market Value Share (%) and BPS Analysis by Country, 2023 to 2033

Figure 69: Latin America Market Y-o-Y Growth (%) Projections by Country, 2023 to 2033

Figure 70: Latin America Market Value (US$ Million) Analysis by Operation Type, 2017 to 2033

Figure 71: Latin America Market Volume (Units) Analysis by Operation Type, 2017 to 2033

Figure 72: Latin America Market Value Share (%) and BPS Analysis by Operation Type, 2023 to 2033

Figure 73: Latin America Market Y-o-Y Growth (%) Projections by Operation Type, 2023 to 2033

Figure 74: Latin America Market Value (US$ Million) Analysis by End-use Industry, 2017 to 2033

Figure 75: Latin America Market Volume (Units) Analysis by End-use Industry, 2017 to 2033

Figure 76: Latin America Market Value Share (%) and BPS Analysis by End-use Industry, 2023 to 2033

Figure 77: Latin America Market Y-o-Y Growth (%) Projections by End-use Industry, 2023 to 2033

Figure 78: Latin America Market Value (US$ Million) Analysis by Application, 2017 to 2033

Figure 79: Latin America Market Volume (Units) Analysis by Application, 2017 to 2033

Figure 80: Latin America Market Value Share (%) and BPS Analysis by Application, 2023 to 2033

Figure 81: Latin America Market Y-o-Y Growth (%) Projections by Application, 2023 to 2033

Figure 82: Latin America Market Value (US$ Million) Analysis by Type, 2017 to 2033

Figure 83: Latin America Market Volume (Units) Analysis by Type, 2017 to 2033

Figure 84: Latin America Market Value Share (%) and BPS Analysis by Type, 2023 to 2033

Figure 85: Latin America Market Y-o-Y Growth (%) Projections by Type, 2023 to 2033

Figure 86: Latin America Market Attractiveness by Operation Type, 2023 to 2033

Figure 87: Latin America Market Attractiveness by End-use Industry, 2023 to 2033

Figure 88: Latin America Market Attractiveness by Application, 2023 to 2033

Figure 89: Latin America Market Attractiveness by Type, 2023 to 2033

Figure 90: Latin America Market Attractiveness by Country, 2023 to 2033

Figure 91: Europe Market Value (US$ Million) by Operation Type, 2023 to 2033

Figure 92: Europe Market Value (US$ Million) by End-use Industry, 2023 to 2033

Figure 93: Europe Market Value (US$ Million) by Application, 2023 to 2033

Figure 94: Europe Market Value (US$ Million) by Type, 2023 to 2033

Figure 95: Europe Market Value (US$ Million) by Country, 2023 to 2033

Figure 96: Europe Market Value (US$ Million) Analysis by Country, 2017 to 2033

Figure 97: Europe Market Volume (Units) Analysis by Country, 2017 to 2033

Figure 98: Europe Market Value Share (%) and BPS Analysis by Country, 2023 to 2033

Figure 99: Europe Market Y-o-Y Growth (%) Projections by Country, 2023 to 2033

Figure 100: Europe Market Value (US$ Million) Analysis by Operation Type, 2017 to 2033

Figure 101: Europe Market Volume (Units) Analysis by Operation Type, 2017 to 2033

Figure 102: Europe Market Value Share (%) and BPS Analysis by Operation Type, 2023 to 2033

Figure 103: Europe Market Y-o-Y Growth (%) Projections by Operation Type, 2023 to 2033

Figure 104: Europe Market Value (US$ Million) Analysis by End-use Industry, 2017 to 2033

Figure 105: Europe Market Volume (Units) Analysis by End-use Industry, 2017 to 2033

Figure 106: Europe Market Value Share (%) and BPS Analysis by End-use Industry, 2023 to 2033

Figure 107: Europe Market Y-o-Y Growth (%) Projections by End-use Industry, 2023 to 2033

Figure 108: Europe Market Value (US$ Million) Analysis by Application, 2017 to 2033

Figure 109: Europe Market Volume (Units) Analysis by Application, 2017 to 2033

Figure 110: Europe Market Value Share (%) and BPS Analysis by Application, 2023 to 2033

Figure 111: Europe Market Y-o-Y Growth (%) Projections by Application, 2023 to 2033

Figure 112: Europe Market Value (US$ Million) Analysis by Type, 2017 to 2033

Figure 113: Europe Market Volume (Units) Analysis by Type, 2017 to 2033

Figure 114: Europe Market Value Share (%) and BPS Analysis by Type, 2023 to 2033

Figure 115: Europe Market Y-o-Y Growth (%) Projections by Type, 2023 to 2033

Figure 116: Europe Market Attractiveness by Operation Type, 2023 to 2033

Figure 117: Europe Market Attractiveness by End-use Industry, 2023 to 2033

Figure 118: Europe Market Attractiveness by Application, 2023 to 2033

Figure 119: Europe Market Attractiveness by Type, 2023 to 2033

Figure 120: Europe Market Attractiveness by Country, 2023 to 2033

Figure 121: Asia Pacific Market Value (US$ Million) by Operation Type, 2023 to 2033

Figure 122: Asia Pacific Market Value (US$ Million) by End-use Industry, 2023 to 2033

Figure 123: Asia Pacific Market Value (US$ Million) by Application, 2023 to 2033

Figure 124: Asia Pacific Market Value (US$ Million) by Type, 2023 to 2033

Figure 125: Asia Pacific Market Value (US$ Million) by Country, 2023 to 2033

Figure 126: Asia Pacific Market Value (US$ Million) Analysis by Country, 2017 to 2033

Figure 127: Asia Pacific Market Volume (Units) Analysis by Country, 2017 to 2033

Figure 128: Asia Pacific Market Value Share (%) and BPS Analysis by Country, 2023 to 2033

Figure 129: Asia Pacific Market Y-o-Y Growth (%) Projections by Country, 2023 to 2033

Figure 130: Asia Pacific Market Value (US$ Million) Analysis by Operation Type, 2017 to 2033

Figure 131: Asia Pacific Market Volume (Units) Analysis by Operation Type, 2017 to 2033

Figure 132: Asia Pacific Market Value Share (%) and BPS Analysis by Operation Type, 2023 to 2033

Figure 133: Asia Pacific Market Y-o-Y Growth (%) Projections by Operation Type, 2023 to 2033

Figure 134: Asia Pacific Market Value (US$ Million) Analysis by End-use Industry, 2017 to 2033

Figure 135: Asia Pacific Market Volume (Units) Analysis by End-use Industry, 2017 to 2033

Figure 136: Asia Pacific Market Value Share (%) and BPS Analysis by End-use Industry, 2023 to 2033

Figure 137: Asia Pacific Market Y-o-Y Growth (%) Projections by End-use Industry, 2023 to 2033

Figure 138: Asia Pacific Market Value (US$ Million) Analysis by Application, 2017 to 2033

Figure 139: Asia Pacific Market Volume (Units) Analysis by Application, 2017 to 2033

Figure 140: Asia Pacific Market Value Share (%) and BPS Analysis by Application, 2023 to 2033

Figure 141: Asia Pacific Market Y-o-Y Growth (%) Projections by Application, 2023 to 2033

Figure 142: Asia Pacific Market Value (US$ Million) Analysis by Type, 2017 to 2033

Figure 143: Asia Pacific Market Volume (Units) Analysis by Type, 2017 to 2033

Figure 144: Asia Pacific Market Value Share (%) and BPS Analysis by Type, 2023 to 2033

Figure 145: Asia Pacific Market Y-o-Y Growth (%) Projections by Type, 2023 to 2033

Figure 146: Asia Pacific Market Attractiveness by Operation Type, 2023 to 2033

Figure 147: Asia Pacific Market Attractiveness by End-use Industry, 2023 to 2033

Figure 148: Asia Pacific Market Attractiveness by Application, 2023 to 2033

Figure 149: Asia Pacific Market Attractiveness by Type, 2023 to 2033

Figure 150: Asia Pacific Market Attractiveness by Country, 2023 to 2033

Figure 151: Middle East and Africa Market Value (US$ Million) by Operation Type, 2023 to 2033

Figure 152: Middle East and Africa Market Value (US$ Million) by End-use Industry, 2023 to 2033

Figure 153: Middle East and Africa Market Value (US$ Million) by Application, 2023 to 2033

Figure 154: Middle East and Africa Market Value (US$ Million) by Type, 2023 to 2033

Figure 155: Middle East and Africa Market Value (US$ Million) by Country, 2023 to 2033

Figure 156: Middle East and Africa Market Value (US$ Million) Analysis by Country, 2017 to 2033

Figure 157: Middle East and Africa Market Volume (Units) Analysis by Country, 2017 to 2033

Figure 158: Middle East and Africa Market Value Share (%) and BPS Analysis by Country, 2023 to 2033

Figure 159: Middle East and Africa Market Y-o-Y Growth (%) Projections by Country, 2023 to 2033

Figure 160: Middle East and Africa Market Value (US$ Million) Analysis by Operation Type, 2017 to 2033

Figure 161: Middle East and Africa Market Volume (Units) Analysis by Operation Type, 2017 to 2033

Figure 162: Middle East and Africa Market Value Share (%) and BPS Analysis by Operation Type, 2023 to 2033

Figure 163: Middle East and Africa Market Y-o-Y Growth (%) Projections by Operation Type, 2023 to 2033

Figure 164: Middle East and Africa Market Value (US$ Million) Analysis by End-use Industry, 2017 to 2033

Figure 165: Middle East and Africa Market Volume (Units) Analysis by End-use Industry, 2017 to 2033

Figure 166: Middle East and Africa Market Value Share (%) and BPS Analysis by End-use Industry, 2023 to 2033

Figure 167: Middle East and Africa Market Y-o-Y Growth (%) Projections by End-use Industry, 2023 to 2033

Figure 168: Middle East and Africa Market Value (US$ Million) Analysis by Application, 2017 to 2033

Figure 169: Middle East and Africa Market Volume (Units) Analysis by Application, 2017 to 2033

Figure 170: Middle East and Africa Market Value Share (%) and BPS Analysis by Application, 2023 to 2033

Figure 171: Middle East and Africa Market Y-o-Y Growth (%) Projections by Application, 2023 to 2033

Figure 172: Middle East and Africa Market Value (US$ Million) Analysis by Type, 2017 to 2033

Figure 173: Middle East and Africa Market Volume (Units) Analysis by Type, 2017 to 2033

Figure 174: Middle East and Africa Market Value Share (%) and BPS Analysis by Type, 2023 to 2033

Figure 175: Middle East and Africa Market Y-o-Y Growth (%) Projections by Type, 2023 to 2033

Figure 176: Middle East and Africa Market Attractiveness by Operation Type, 2023 to 2033

Figure 177: Middle East and Africa Market Attractiveness by End-use Industry, 2023 to 2033

Figure 178: Middle East and Africa Market Attractiveness by Application, 2023 to 2033

Figure 179: Middle East and Africa Market Attractiveness by Type, 2023 to 2033

Figure 180: Middle East and Africa Market Attractiveness by Country, 2023 to 2033

Frequently Asked Questions

What was the overall size of the stacker crane market in 2025?

The overall market size for the stacker crane market was USD 1,280.6 Million in 2025.

How big is the stacker crane market expected to be in 2035?

The stacker crane market is expected to reach USD 2,689 Million in 2035.

What will drive the demand for the stacker crane market during the forecast period?

The demand for stacker cranes is rising due to increasing automation in warehousing, the surge in e-commerce fulfillment needs, and the growing emphasis on space optimization and operational efficiency. The adoption of automatic systems across logistics and retail sectors is further driving market growth.

List the top 5 countries contributing to the stacker crane market.

The top 5 countries driving the development of the stacker crane market are the USA, China, Germany, Japan, and South Korea.

Which segment in the system and end-use type is expected to lead in the stacker crane market?

Automatic systems and e-commerce are expected to command a significant share over the assessment period.

Explore Similar Insights

Future Market Insights

Stacker Crane Market