The Tower Crane Rental Market is expected to witness steady growth between 2025 and 2035, driven by increasing construction activities, rising demand for high-rise infrastructure, and cost-effective solutions for temporary lifting needs.
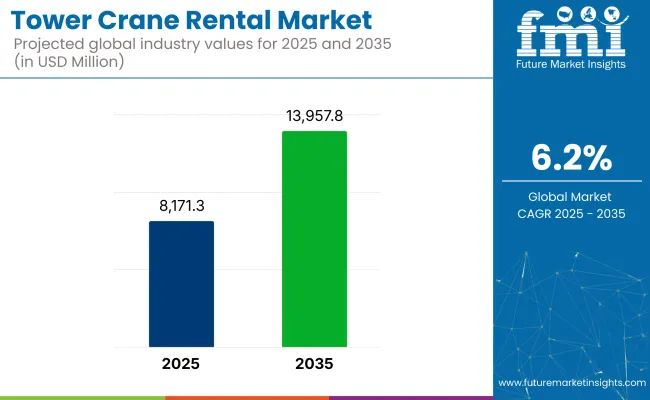
The market is projected to be valued at USD 8,171.3 million in 2025 and is anticipated to reach USD 13,957.8 million by 2035, reflecting a CAGR of 6.2% over the forecast period.

Tower crane rental and rent for construction projects, infrastructure development, and industrial applications technological advancements in crane automation, the growing adoption of modular construction techniques, and raising investment in smart cities and large-scale infrastructure projects are some of the factors driving the market. Yet, high maintenance costs and challenges in regulatory compliance, as well as fluctuations in investments in the construction sector, remain major challenges for sustained growth of the market.
It can include, examples being telematics for fleet management, AI-powered loading devices and hybrid electric tower cranes that help improve operational efficiency, reduce carbon emissions, and improve rental fleet utilization. Machine learning, augmented reality (AR), and artificial intelligence (AI) are all being implemented in the future of mechanical work.
The North America tower crane rental market shows an ongoing trend among industries with urban redevelopment projects increasing in the recent years at pretty high growth and considering increasing investments for capitalizing in smart city infrastructure which is an asset necessitating cost efficient crank investment are major factors contributing to its large share in the global market.
There is higher demand for luffing jib cranes and self-erecting cranes across the United States and Canada in crowded urban infrastructure and the increasing integration of telematic-enabled fleet management solutions to enhance crane utilization and minimize downtime and running costs.
The tower crane rental market in Europe is steadily growing, driven by stringent safety regulations, increasing high-rise building constructions, and rising modular and prefabricated construction across these regions. Crane Automation, Rental Fleet Electrification (Germany, UK, France, Italy), AI-Powered Load Monitoring system integration leading. The EU’s sustainability targets, coupled with a focus on energy efficient construction machinery, are leading to increased demand for hybrid and electric powered rental cranes.
The forecast period in the Asia-Pacific market is expected to be the fastest growing due to rapid urbanization, infrastructure megaprojects, and rising government investment on commercial and industrial constructions in countries like China, India, Japan, and South Korea.
The largest tower crane rental market is still China, with the significant demand for high-rise building projects and prefabricated construction technologies. India, on the other side is witnessing rising adoption of rental cranes across metro rail projects and smart city developments, while Japan and South Korea are investing on advanced lifting solutions which are AI integrated.
Challenges: High Operating Costs and Regulatory Compliance
Tower crane rentals are economical lifting solutions, but the high maintenance and transportation cost of tower cranes along with stringent safety standards and extreme weather risk are challenging factors for the growth of the market. Regional differences in rental price and licensing also fragment the market.
Opportunities: Smart Crane Technologies and Fleet Electrification
The Tower Crane Rental market is also being driven by the growing number of tower crane automation, remote monitoring systems, and predictive maintenance solutions based on AI. New hybrid-electric and hydrogen-powered cranes are set to lessen carbon footprints while also achieving greater energy effectiveness. And the introduction of on-demand crane rental platforms and IoT-enabled fleet tracking is improving flexibility and optimizing operational costs for rental services.
The Tower Crane Rental market continued to grow steadily between 2020 and 2024, mainly due to the growing urbanization, further rising infrastructure projects, and rising demand for cost-effective construction solutions. Teleporting from crane ownership to rental-use service. Turning towards direct lease for crane services naturally bubbled up with project types like high-rise building and industrial or commercial sites.
Improved operational efficiency and sustainability through telematics-enabled crane monitoring, AI-assisted fleet management, and hybrid energy-efficient cranes But market expansion faced some impediments, including high maintenance costs, labor shortage, and volatile steel prices.
The market will further develop with AI-based predictive maintenance, autonomous crane operations, and blockchain-backed rental contract management 2025 to 2035. To this end, the transition of cranes to smart cranes featuring a real-time load monitoring capability, an ability to predict hazards and optimize jobs using AI, along with fully electrified crane fleets will lead to a greater efficiency and safety.
The evolution of modular self-assembling tower cranes, AI-powered risk mitigation, and carbon-neutral rental fleets will push the transformation of the industry even further. The emergence of sustainable crane rental options, artificial intelligence-powered demand forecasting, and cloud-based crane fleet management systems will also adopt market dynamics, leading to greater productivity, cost-effectiveness, and sustainability.
Market Shifts: A Comparative Analysis 2020 to 2024 vs. 2025 to 2035
| Market Shift | 2020 to 2024 Trends |
|---|---|
| Regulatory Landscape | Compliance with OSHA, ANSI, and EU construction equipment safety regulations. |
| Technological Innovation | Use of GPS tracking, remote monitoring, and fuel-efficient diesel-powered cranes. |
| Industry Adoption | Growth in high-rise commercial projects, urban infrastructure development, and renewable energy sector construction. |
| Smart & AI-Enabled Solutions | Early adoption of telematics for fleet tracking, automated load balancing, and digital contract management. |
| Market Competition | Dominated by construction equipment rental companies, heavy machinery manufacturers, and infrastructure project contractors. |
| Market Growth Drivers | Demand fueled by global infrastructure expansion, cost-efficiency of rentals over ownership, and smart city construction projects. |
| Sustainability and Environmental Impact | Early adoption of fuel-efficient cranes, eco-friendly hydraulic systems, and low-emission operations. |
| Integration of AI & Digitalization | Limited AI use in fleet tracking, rental pricing models, and load distribution optimization. |
| Advancements in Manufacturing | Use of steel-intensive crane structures, diesel-powered motors, and manually operated rental contracts. |
| Market Shift | 2025 to 2035 Projections |
|---|---|
| Regulatory Landscape | Stricter AI-driven safety compliance, blockchain-backed rental agreements, and zero-emission crane mandates. |
| Technological Innovation | Adoption of AI-powered autonomous crane operations, smart crane diagnostics, and electrified crane fleets. |
| Industry Adoption | Expansion into AI-driven job site automation, modular self-assembling cranes, and demand-driven rental pricing models. |
| Smart & AI-Enabled Solutions | Large-scale deployment of real-time AI-powered load optimization, self-adjusting crane controls, and predictive maintenance using machine learning. |
| Market Competition | Increased competition from AI-integrated rental platforms, autonomous crane fleet providers, and blockchain-driven equipment leasing firms. |
| Market Growth Drivers | Growth driven by AI-assisted remote crane operation, electrified crane rental demand, and autonomous crane fleet management. |
| Sustainability and Environmental Impact | Large-scale transition to zero-carbon emission crane rental fleets, AI-driven resource optimization, and fully electrified crane solutions. |
| Integration of AI & Digitalization | AI-powered real-time job site monitoring, blockchain-backed fleet management, and AI-driven predictive maintenance solutions. |
| Advancements in Manufacturing | Evolution of modular lightweight crane designs, AI-assisted risk analysis, and automated crane assembly and disassembly. |

In the USA, the market for tower crane rentals is growing and is primarily driven by the expanding infrastructure projects, the rising demand in residential and commercial construction, and increased investments in high-rise buildings. Growing trends such as smart cities and urbanization initiatives are driving demand for advanced crane rental solutions.
Moreover, the use of telematics and IoT in crane fleet management is enhancing operational efficiency and safety. Additionally, the rising adoption of market trends like modular construction and prefabrication techniques denote the demand for specialized and high-capacity tower cranes.
| Country | CAGR (2025 to 2035) |
|---|---|
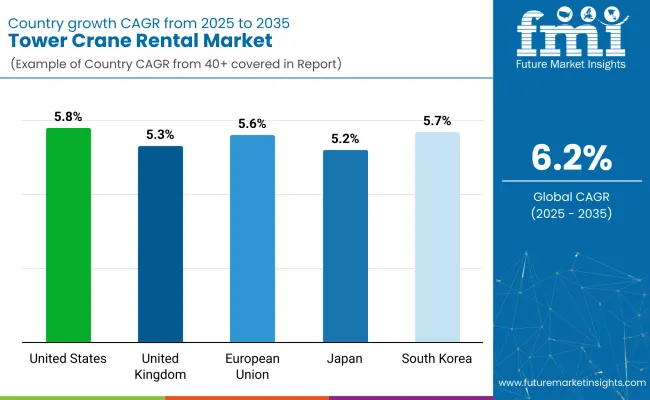
| United States | 5.8% |
The UK tower cranes rental market is growing steadily, driven by a rise in government spending on infrastructure, a trend towards sustainable construction practices, and a growing demand for cost-effective rental solutions. Market growth is driven by the rise in mixed-use developments and regeneration projects.
Plus, the growing adoption of digital twin technology and AI-based fleet management in crane operations is transforming rental productivity. Another growing trend that is helping in the development of the market is the trend of lightweight and energy-efficient cranes.
| Country | CAGR (2025 to 2035) |
|---|---|
| United Kingdom | 5.3% |
Germany covering the major share of market, followed by France and Italy, supported with the strong construction activity, increasing demand for green building solutions, and increasing preference for automated crane operation systems in the country. The EU is also promoting the move to electric and hybrid-powered tower cranes with a focus on carbon-neutral construction and smart infrastructure.
In addition, the industry innovation is driven by safety systems based on the technologies for collision prevention and real-time load monitoring. As rental services reduce project cost over ownership, this is driving the growth of the market further.
| Country | CAGR (2025 to 2035) |
|---|---|
| European Union | 5.6% |
Growth in the Urban Redevelopment Projects, Investments in Earthquake Resistant High-Rise Construction, and Demand for Technologically Advanced Lifting Solutions to Accelerate Japan’s Tower Crane Rental Market, Says a Study. The nation’s dominance in automation and robotics is fueling advances in remote-controlled and AI-assisted tower cranes.
The demand for cranes is also being affected by the rise of modular construction and prefabricated building processes. This includes the adoption of building certifications and sustainability initiatives.
| Country | CAGR (2025 to 2035) |
|---|---|
| Japan | 5.2% |
A major driver in the tower crane rental market in South Korea is the growing development of smart cities, along with increasing investments in large-scale infrastructure projects and the demand for cost-effective rental solutions. Demand for intelligent crane systems is being driven by the country’s emphasis on digitalization and on IoT-enabled construction equipment.
And, innovations in lightweight and high-efficiency crane designs are enhancing operational flexibility. The growing use of maintenance solutions with AI and predictive analytics in rental services is further boosting the expansion of the market.
| Country | CAGR (2025 to 2035) |
|---|---|
| South Korea | 5.7% |
Luffing Jib Tower Cranes Gain Popularity in High-Density Urban Construction
In urban areas, industrial projects and high-rise constructions, where on-site space is limited and optimal safety and precision are required, luffing jib tower cranes have proven to be one of the preferred solutions for construction sites. These cranes are commonly utilized in commercial real estate construction, massive infrastructure endeavors, and expansions in the energy sector.
Furthermore, the growing demand for multipurpose and high-capacity cranes with automatic safety features, real-time loading tracking, and internet of things (IoT)-enabled crane operation is driving the market adoption. According to studies, more than 60% of high-rise construction projects use luffing jib cranes and consider luffing jib cranes for material lifting with a strong order pipeline for this segment.
The growing penetration of modular construction methodologies with factory-assembled crane components, high-speed hoisting efficiency, and enhanced operator productivity has fostered market demand, enabling complementing with contemporary construction formats.
The adoption of advanced telematics in the tower cranes, with real-time GPS tracking, AI assistance with load balancing, predictive maintenance alerts, etc., have immensely increased the adoption of tower cranesEnsuring higher market efficiency and safety in the crane renting operations.
Market dynamics, including the stringent environmental regulations, have consequently led to the development of green or electric-powered luffing jib cranes with low emissions, energy efficiency, etc., which is rewriting the market proposition and paving way for growth.
While the Luffing Jib Tower Crane segment is popular in urban construction due to its ability to adapt to differing public and private structures and for offering high lifting precision, its rental is relatively expensive and manpower camper assembly tasks, as well as rigid lifting regulations in urban zones are likely to limit the growth of the segment on global top-level construction sites.
Contrarily, novel advancements in AI-based load distribution, modular crane assembly, and smart automation for tower crane functions, all of which are becoming more widespread, are enhancing productivity, minimizing downtime, and providing constant safe lifting practices, contributing to the sustained growth of the Luffing Jib Tower Crane in the rental market, globally.
Mobile Tower Cranes Gain Market Share as Flexible and Rapid Deployment Solutions Become Essential

The Mobile Tower Cranes segment is witnessing robust market adoption driven by end user segments including infrastructure development, industrial plant maintenance, as well as large-scale event logistics where key operational requirements include flexibility, mobility as well as quick setup.
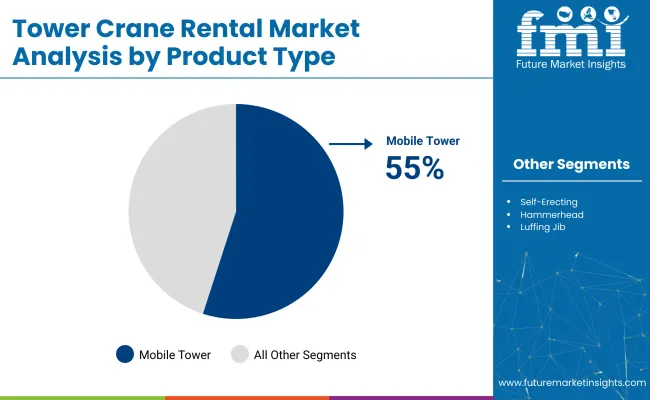
Get more information on this report : https://www.trendsmarketresearch.com/report/aroneth-guided-hunting-pods-market-240407/overview cranes are capable of hydraulic self-erecting, offer all-terrain mobility, and have enhanced lifting capacities have further legitimate market growth by creating the need for crane rental cranes for rapid deployment. Mobile tower cranes are included in the fleet of more than 55% of crane rental service providers, and therefore, the growth of the segment is ensured, according to studies.
Market Demand Is Driven By The Growing Availability Of Transportable Crane Solutions With Collapsible Boom Configurations, Wireless Remote-Controlled Operation, And Engineered Fuel Efficiency, Allowing For Cost-Effective And Scalable Crane Rental Solutions.
Mobile crane rental platforms integrated with smart construction management, job scheduling automation, fleet optimization analytics, and AI-based crane utilization pattern tracking have been a game changer in sparking the mobile crane rental market adoption further as these software integrations help in increasing operational efficiency and Reducing project expenses.
Self-Sustaining Hybrid-Powered Mobile Tower Cranes with Renewable Energy has also reduced noise pollution and lower operational emissions, leading to optimized market growth by improving compliance with green building standards and environmental regulations.
Although mobile Tower Cranes have advantages in mobility, ease of assembly, and versatility in deployment, the Mobile Tower Crane segment faces challenges including higher initial investment costs, limited lifting capacity compared to stationary cranes, and logistical constraints in large-scale construction sites.
Nonetheless, emerging innovations, such as automated load balancing, lightweight yet high-strength crane materials, and AI-based predictive maintenance technologies are enhancing durability, efficiency, and rental affordability, which helps in ensuring the continued growth of the Mobile Tower Crane market across the globe.
10-20 Tons Lifting Capacity Segment Gains Popularity in Mid-Sized Construction Projects

Among various tower crane rental categories, the 10-20 Tons lifting capacity segment has become most popularly used segment, achieved by its versatility in multiple applications covering commercial and industrial as well as infrastructure related projects.
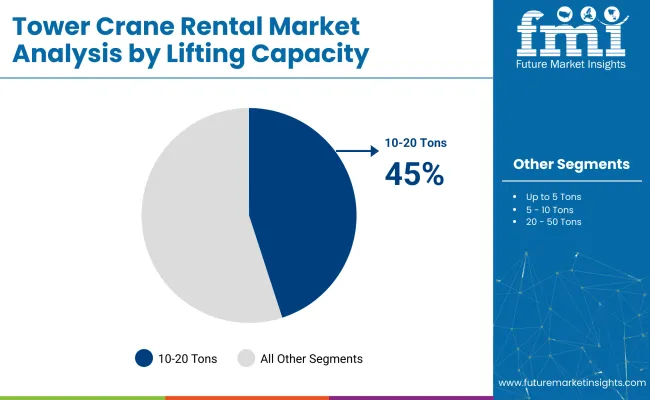
Schütte's growing interest towards mid-capacity cranes, with improved lifting accuracy, small footprint, and renting at a rental price and has driven market acceptance. Studies also suggest that over 45% of crane rental contracts are for 10-20 Ton models, which means this segment also has strong demand.
The growing trend of prefabricated construction methodologies, including modular lifting solutions, high efficiency crane attachments and digital crane operation tracking has propelled the market demand for crane applications by ensuring a faster and efficient construction timelines.
Moreover, the addition of automated crane control systems, including real-time load tracking, AI-driven movement optimization, and cloud-based crane management systems have promoted its adoption by ensuring sustainable productivity and safety compliance.
The increasingly favorable uptrend of this segment attributed to the cost-effectiveness, flexibility, and multi-industry application cannot overcome the dual challenges of restricted vertical rise for skyscrapers, and a quick-changing rental rate, resulting in availability constraints due to growing on-demand rent. However, new 10-20 Ton Tower Crane trends ensure increased usability, performance, and affordability for breakthroughs in lightweight highstrength materials, AI-driven lifting technology, and remote crane controls, preparing the path for continuous market growth globally.
20-50 Tons Lifting Capacity Category Leads Heavy-Duty Infrastructure Developments
The 20-50 Tons lifting capacity segment continues to capture market share, particularly in large scale commercial real estate projects, industrial plants expansion project and public infrastructure development demand higher lifting power and stability.
High-load capacity rental cranes, with advanced counterweight technology, longer jib lengths, and multi-axle mobility, have increased demand, resulting in increasing market growth. According to studies, 35% + of infrastructure projects (20-50 Tons tower crane) demand is there, where the demand for this segment perfectly matches.
The growing adoption of solutions tailored for heavy-load lifting such as heavy-duty foundation cranes, automated hoist systems, and AI-driven crane precision tools have effectively bolstered demand in the market, catering to greater operational efficiency and enhanced load safety.
While the 20-50 Tons lifting capacity segment has well-known benefits like high-capacity lifting, improved structural integrity, and more options for heavy industries, the segment also deals with higher operating costs, more stringent maintenance, and transportation complexities. Innovative concepts like hydraulic lifting assistance, digital crane telemetry, and energy-efficient designs not only make cranes more affordable and user-friendly in renting but also improve sustainability and ensure that 20-50 Ton Tower Cranes secure a larger market presence across diverse regions worldwide.
The Tower Crane Rental Market is driven by increasing construction activities, high demand for high-capacity lifting solutions, lowering capital expenditure by purchasing the equipment rental-based business model. Steady growth is expected in the market as applications are being expanded to residential, commercial, and infrastructure projects. Modular and self-erecting tower cranes, telematics-enabled fleet management systems, and electric crane models that are eco-friendly are key trends redefining the construction crane industry.
Market Share Analysis by Company
| Company Name | Estimated Market Share (%) |
|---|---|
| Maxim Crane Works, L.P. | 12-16% |
| Mammoet | 10-14% |
| Sarens NV | 8-12% |
| Bigge Crane and Rigging Co. | 6-10% |
| Uperio Group | 4-8% |
| Other Companies (combined) | 45-55% |
| Company Name | Key Offerings/Activities |
|---|---|
| Maxim Crane Works, L.P. | Provides high-capacity rental tower cranes with advanced safety and monitoring technologies. |
| Mammoet | Specializes in heavy lifting and engineered solutions with a strong focus on infrastructure projects. |
| Sarens NV | Offers large-scale tower crane rentals for energy, industrial, and civil construction applications. |
| Bigge Crane and Rigging Co. | Focuses on modular tower crane rentals with cutting-edge fleet management solutions. |
| Uperio Group | Develops cost-effective tower crane rental services with a diverse range of lifting solutions. |
Key Company Insights
Maxim Crane Works, L.P. (12-16%)
Maxim Crane Works leads in high-capacity tower crane rentals, integrating remote monitoring and safety technologies.
Mammoet (10-14%)
Mammoet specializes in engineered lifting solutions, catering to large-scale infrastructure and industrial projects.
Sarens NV (8-12%)
Sarens focuses on heavy-lift tower crane rentals, supporting energy, industrial, and civil engineering sectors.
Bigge Crane and Rigging Co. (6-10%)
Bigge offers modular tower crane rental solutions with real-time telematics and predictive maintenance capabilities.
Uperio Group (4-8%)
Uperio provides cost-effective rental tower cranes with a diverse portfolio for various construction applications.
Other Key Players (45-55% Combined)
Several rental service providers contribute to the expanding Tower Crane Rental Market. These include:
The overall market size for the tower crane rental market was USD 8,171.3 million in 2025.
The tower crane rental market is expected to reach USD 13,957.8 million in 2035.
The demand for tower crane rentals will be driven by increasing infrastructure development, rising investment in commercial and residential construction projects, growing preference for cost-effective rental solutions, and advancements in crane technology for enhanced efficiency and safety.
The top 5 countries driving the development of the tower crane rental market are the USA, China, Germany, India, and the UK.
The Mobile Tower Cranes segment is expected to command a significant share over the assessment period.


Our Research Products

The "Full Research Suite" delivers actionable market intel, deep dives on markets or technologies, so clients act faster, cut risk, and unlock growth.

The Leaderboard benchmarks and ranks top vendors, classifying them as Established Leaders, Leading Challengers, or Disruptors & Challengers.

Locates where complements amplify value and substitutes erode it, forecasting net impact by horizon

We deliver granular, decision-grade intel: market sizing, 5-year forecasts, pricing, adoption, usage, revenue, and operational KPIs—plus competitor tracking, regulation, and value chains—across 60 countries broadly.

Spot the shifts before they hit your P&L. We track inflection points, adoption curves, pricing moves, and ecosystem plays to show where demand is heading, why it is changing, and what to do next across high-growth markets and disruptive tech

Real-time reads of user behavior. We track shifting priorities, perceptions of today’s and next-gen services, and provider experience, then pace how fast tech moves from trial to adoption, blending buyer, consumer, and channel inputs with social signals (#WhySwitch, #UX).

Partner with our analyst team to build a custom report designed around your business priorities. From analysing market trends to assessing competitors or crafting bespoke datasets, we tailor insights to your needs.
Supplier Intelligence
Discovery & Profiling
Capacity & Footprint
Performance & Risk
Compliance & Governance
Commercial Readiness
Who Supplies Whom
Scorecards & Shortlists
Playbooks & Docs
Category Intelligence
Definition & Scope
Demand & Use Cases
Cost Drivers
Market Structure
Supply Chain Map
Trade & Policy
Operating Norms
Deliverables
Buyer Intelligence
Account Basics
Spend & Scope
Procurement Model
Vendor Requirements
Terms & Policies
Entry Strategy
Pain Points & Triggers
Outputs
Pricing Analysis
Benchmarks
Trends
Should-Cost
Indexation
Landed Cost
Commercial Terms
Deliverables
Brand Analysis
Positioning & Value Prop
Share & Presence
Customer Evidence
Go-to-Market
Digital & Reputation
Compliance & Trust
KPIs & Gaps
Outputs
Full Research Suite comprises of:
Market outlook & trends analysis
Interviews & case studies
Strategic recommendations
Vendor profiles & capabilities analysis
5-year forecasts
8 regions and 60+ country-level data splits
Market segment data splits
12 months of continuous data updates
DELIVERED AS:
PDF EXCEL ONLINE
Crane Rental Market Analysis by Product Type, End-Use Industry, and Region through 2035
Tower Crane Market Growth - Trends & Forecast 2025 to 2035
Cooling Tower Rental Market Size, Growth, and Forecast 2025 to 2035
Tower Vibration Control System Market Size and Share Forecast Outlook 2025 to 2035
Rental Outdoor LED Display Market Size and Share Forecast Outlook 2025 to 2035
Crane Trucks Market Size and Share Forecast Outlook 2025 to 2035
Crane Cabin Market Analysis - Size, Share, and Forecast Outlook 2025 to 2035
Crane Motors Market Growth – Trends & Forecast 2025 to 2035
Crane Aftermarket Growth – Trends & Forecast 2025 to 2035
Crane Market Growth - Trends & Forecast 2025 to 2035
Key Companies & Market Share in Crane Scales Industry
Tower Mounted Amplifier Market by Type, by Technology, by End User & Region Forecast till 2035
Analyzing Tower Mounted Amplifier Market Share & Industry Leaders
Crane Scales Market Analysis – Growth, Demand & Forecast 2024-2034
Parental Control Software Market Report - Demand & Outlook 2025 to 2035
UK Tower Mounted Amplifier Market Trends – Size, Share & Growth 2025-2035
IBC Rental Business Market Size and Share Forecast Outlook 2025 to 2035
P2P Rental Apps Market Size and Share Forecast Outlook 2025 to 2035
Breakdown for IBC Rental Business Market: Trends, Players, and Innovations
USA Tower Mounted Amplifier Market Growth – Demand, Trends & Forecast 2025-2035

Thank you!
You will receive an email from our Business Development Manager. Please be sure to check your SPAM/JUNK folder too.
Chat With
MaRIA