Electric Stacker Market
Market Insights on Electric Stacker covering sales outlook, demand forecast & up-to-date key trends
Electric Stacker Market by Application, Carrying Capacity, Lifting Height & Region - Forecast 2022 - 2032
Electric Stacker Market Snapshot (2022-2032)
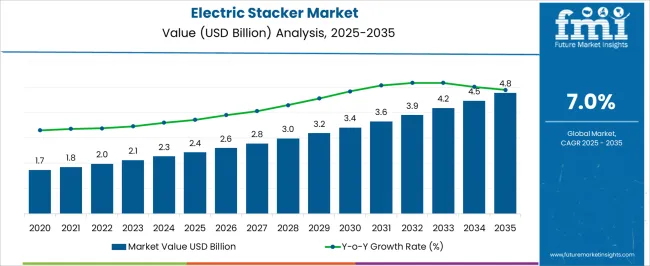
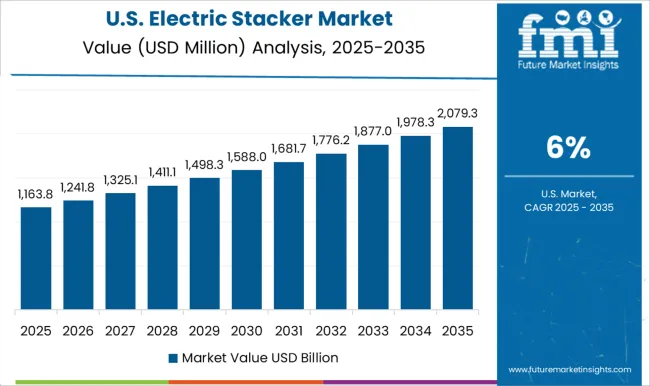
[301 Pages Report] The global electric stacker market is forecasted to be valued at US$ 1,987.8 Million in 2022. During the forecast period ranging from 2022-2032, sales of electric stacker are expected to grow at a CAGR of 7.2%, to be valued at US$ 3,965.7 Million.
Report Attribute |
Details |
Expected Market Value (2022) |
US$ 1,987.8 Million |
Anticipated Forecast Value (2032) |
US$ 3965.7 Million |
Projected Growth Rate (2022-2032) |
7.2% CAGR |
During the historical period 2016-2021, electric stacker consumption inclined at a 5.8% value CAGR.
Let us know your requirement to get
100% FREE customization
Which are Some Prominent Drivers Spearheading Electric Stacker Market Growth?
One of the most important elements projected to promote the expansion of the electric stacker market is an increase in capital to industries. The high throughput value and the short time required to load the plates in the electric stacker are two of the most important factors driving the electric stacker market's rapid expansion.
Several new trends are emerging in the electric stacker industry. Furthermore, the electric Stackers Industry is expanding, and several new advancements are taking place in the market. Technological progress is also assisting the market's quick growth. These stackers come in a variety of sizes and styles, each with a different capacity for the electric and are also employed in the process of transporting equipment.
What are the Challenges Faced by the Electric Stacker Industry?
One of the problems limiting the growth of the electric stacker industry is a lack of information about new features and higher capacity of new electric stackers. Another problem that may limit the growth of the electric stacker market is the high cost of the device, which may deter firms from utilizing one.
Find your sweet spots for generating winning opportunities in this market.
Talk to AnalystRegion-wise Analysis
Why is Asia-Pacific emerging as an Opportunistic Electric Stacker Market?
Since the adoption of electric stacker market improves packaging capacity, APEJ is predicted to expand at a higher CAGR throughout the projection period. In Japan, the worldwide electric stacker market is well established and predicted to develop at an average CAGR over the forecast period.
What is the Growth Scenario for Electric Stacker Sales across North America?
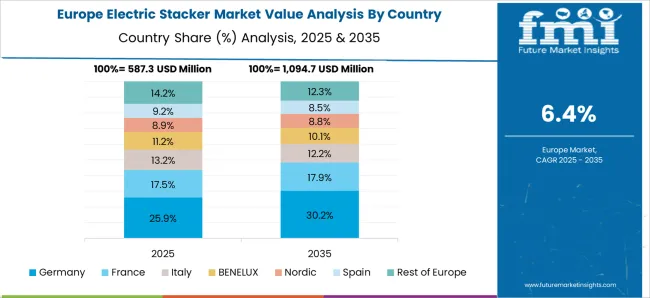
North America accounts for a sizable share of the global electric stacker market in terms of consumption, owing to a growing concern about the adoption of easier lifting methods and the production of various products is also a major factor driving the growth of the electric stacker market in this region.
Category wise insights
By Load Carrying Capacity, which Electric Stacker Category is expected to Dominate?
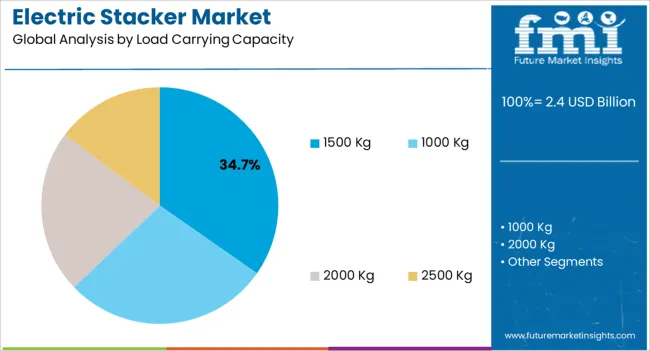
By load carrying capacity, the electric stacker market is segmented into 1000 kg, 1500 kg, 2000 kg and 2500 kg capacities.
Among all of them demand for 1500 kg load carrying capacity is expected to tower over the rest, as they are built using quality guaranteed materials and innovative procedures, ensuring that they meet the standards in this extremely demanding area.

An unified Market Research Subscription Platform, built for today’s disparate research needs.
Market Competition
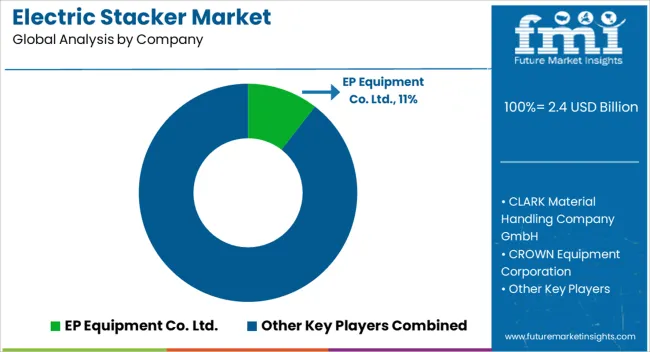
Some of the key participants present in the global electric stacker market include Jost’s Engineering Company Limited, Jungheinrich AG, Reliable Storage System, Gloline Equipment Pvt. Ltd., Vestil Manufacturing Corporation, and EP Equipment Co. Ltd., CLARK EUROPE GmbH, CROWN, MAINI Materials Movement Pvt. Ltd., JUNGHEINRICH, Linde Material Handling GmbH, Presto Lifts, PROLIFT Handling Ltd. and Godrej Material Handling among others.
Due to the sheer range of participants, the market is extremely competitive. Some recent developments in the electric stacker industry are as follows:
- On 29th June 2022, Godrej Appliances substitutes recyclable paper-based honeycomb packaging with Thermocole.
Report Scope
Report Attribute |
Details |
Growth Rate |
CAGR of 7.2% from 2022 to 2032 |
Market Value in 2022 |
US$ 1,987 Million |
Market Value in 2032 |
US$ 3,965 Million |
Base Year for Estimation |
2021 |
Historical Data |
2016-2021 |
Forecast Period |
2022-2032 |
Quantitative Units |
Revenue in US$ Million and CAGR from 2022-2032 |
Report Coverage |
Revenue Forecast, Company Ranking, Competitive Landscape, Growth Factors, Trends and Pricing Analysis |
Segments Covered |
|
Regions Covered |
|
Key Countries Profiled |
|
Key Companies Profiled |
|
Customization |
Available Upon Request |
Key Segments Profiled in the Electric Stacker Industry Survey
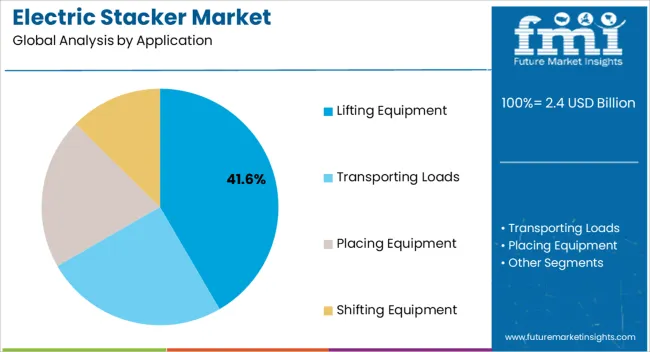
Electric Stacker Market by Application:
- Electric Stackers for Lifting Equipment
- Electric Stackers for Transporting Loads
- Electric Stackers for Placing Equipment
- Electric Stackers for Shifting Equipment
Electric Stacker Market by Load Carrying Capacity:
- Electric Stackers up to 1000 kg
- Electric Stackers up to 1500 kg
- Electric Stackers up to 2000 kg
- Electric Stackers up to 2500 kg
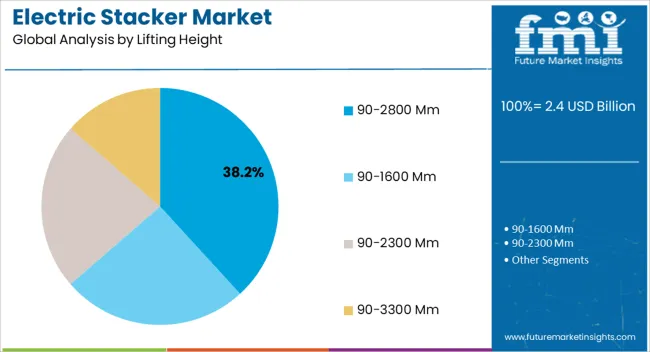
Electric Stacker Market by Lifting Height:
- Electric Stackers from 90-1600 mm
- Electric Stackers from 90-2300 mm
- Electric Stackers from 90-2800 mm
- Electric Stackers from 90-3300 mm
Electric Stacker Market by Region:
- North America Electric Stacker Market
- Asia Pacific exclusive of Japan Electric Stacker Market
- Latin America Electric Stacker Market
- Europe Electric Stacker Market
- Middle East and Africa Electric Stacker
Frequently Asked Questions
FMI projects the global Electric Stacker market to expand at a 7.2% value CAGR by 2032
North America is expected to be the most opportunistic Electric Stacker market, accumulating 18.5% revenue in 2022
Jost’s Engineering Company Limited, and Reliable Storage System are among the prominent companies recognized globally in the Electric Stacker industry.
Table of Content
1. Executive Summary
1.1. Global Market Outlook
1.2. Demand-side Trends
1.3. Supply-side Trends
1.4. Technology Roadmap Analysis
1.5. Analysis and Recommendations
2. Market Overview
2.1. Market Coverage / Taxonomy
2.2. Market Definition / Scope / Limitations
3. Market Background
3.1. Market Dynamics
3.1.1. Drivers
3.1.2. Restraints
3.1.3. Opportunity
3.1.4. Trends
3.2. Scenario Forecast
3.2.1. Demand in Optimistic Scenario
3.2.2. Demand in Likely Scenario
3.2.3. Demand in Conservative Scenario
3.3. Opportunity Map Analysis
3.4. Product Life Cycle Analysis
3.5. Supply Chain Analysis
3.5.1. Supply Side Participants and their Roles
3.5.1.1. Producers
3.5.1.2. Mid-Level Participants (Traders/ Agents/ Brokers)
3.5.1.3. Wholesalers and Distributors
3.5.2. Value Added and Value Created at Node in the Supply Chain
3.5.3. List of Raw Material Suppliers
3.5.4. List of Existing and Potential Buyer’s
3.6. Investment Feasibility Matrix
3.7. Value Chain Analysis
3.7.1. Profit Margin Analysis
3.7.2. Wholesalers and Distributors
3.7.3. Retailers
3.8. PESTLE and Porter’s Analysis
3.9. Regulatory Landscape
3.9.1. By Key Regions
3.9.2. By Key Countries
3.10. Regional Parent Market Outlook
3.11. Production and Consumption Statistics
3.12. Import and Export Statistics
4. Global Electric Stacker Market Analysis 2016-2021 and Forecast, 2022-2032
4.1. Historical Market Size Value (US$ Mn) & Volume (Units) Analysis, 2016-2021
4.2. Current and Future Market Size Value (US$ Mn) & Volume (Units) Projections, 2022-2032
4.2.1. Y-o-Y Growth Trend Analysis
4.2.2. Absolute $ Opportunity Analysis
5. Global Electric Stacker Market Analysis 2016-2021 and Forecast 2022-2032, By Application
5.1. Introduction / Key Findings
5.2. Historical Market Size Value (US$ Mn) & Volume (Units) Analysis By Application, 2016-2021
5.3. Current and Future Market Size Value (US$ Mn) & Volume (Units) Analysis and Forecast By Application, 2022-2032
5.3.1. Lifting Equipment
5.3.2. Transporting Load
5.3.3. Placing Equipment
5.3.4. Shifting Equipment
5.4. Y-o-Y Growth Trend Analysis By Application, 2016-2021
5.5. Absolute $ Opportunity Analysis By Application, 2022-2032
6. Global Electric Stacker Market Analysis 2016-2021 and Forecast 2022-2032, By Load Carrying Capacity
6.1. Introduction / Key Findings
6.2. Historical Market Size Value (US$ Mn) & Volume (Units) Analysis By Load Carrying Capacity, 2016-2021
6.3. Current and Future Market Size Value (US$ Mn) & Volume (Units) Analysis and Forecast By Load Carrying Capacity, 2022-2032
6.3.1. 1000 kg
6.3.2. 1500 kg
6.3.3. 2000 kg
6.3.4. 2500 kg
6.4. Y-o-Y Growth Trend Analysis By Load Carrying Capacity, 2016-2021
6.5. Absolute $ Opportunity Analysis By Load Carrying Capacity, 2022-2032
7. Global Electric Stacker Market Analysis 2016-2021 and Forecast 2022-2032, By Lifting Height
7.1. Introduction / Key Findings
7.2. Historical Market Size Value (US$ Mn) & Volume (Units) Analysis By Lifting Height, 2016-2021
7.3. Current and Future Market Size Value (US$ Mn) & Volume (Units) Analysis and Forecast By Lifting Height, 2022-2032
7.3.1. 90-1600 mm
7.3.2. 90-2300 mm
7.3.3. 90-2800 mm
7.3.4. 90-3300 mm
7.4. Y-o-Y Growth Trend Analysis By Lifting Height, 2016-2021
7.5. Absolute $ Opportunity Analysis By Lifting Height, 2022-2032
8. Global Electric Stacker Market Analysis 2016-2021 and Forecast 2022-2032, By Region
8.1. Introduction
8.2. Historical Market Size Value (US$ Mn) & Volume (Units) Analysis By Region, 2016-2021
8.3. Current Market Size Value (US$ Mn) & Volume (Units) Analysis and Forecast By Region, 2022-2032
8.3.1. North America
8.3.2. Latin America
8.3.3. Europe
8.3.4. Asia Pacific
8.3.5. MEA
8.4. Market Attractiveness Analysis By Region
9. North America Electric Stacker Market Analysis 2016-2021 and Forecast 2022-2032, By Country
9.1. Historical Market Size Value (US$ Mn) & Volume (Units) Trend Analysis By Market Taxonomy, 2016-2021
9.2. Market Size Value (US$ Mn) & Volume (Units) Forecast By Market Taxonomy, 2022-2032
9.2.1. By Country
9.2.1.1. U.S.
9.2.1.2. Canada
9.2.2. By Application
9.2.3. By Load Carrying Capacity
9.2.4. By Lifting Height
9.3. Market Attractiveness Analysis
9.3.1. By Country
9.3.2. By Application
9.3.3. By Load Carrying Capacity
9.3.4. By Lifting Height
9.4. Key Takeaways
10. Latin America Electric Stacker Market Analysis 2016-2021 and Forecast 2022-2032, By Country
10.1. Historical Market Size Value (US$ Mn) & Volume (Units) Trend Analysis By Market Taxonomy, 2016-2021
10.2. Market Size Value (US$ Mn) & Volume (Units) Forecast By Market Taxonomy, 2022-2032
10.2.1. By Country
10.2.1.1. Brazil
10.2.1.2. Mexico
10.2.1.3. Rest of Latin America
10.2.2. By Application
10.2.3. By Load Carrying Capacity
10.2.4. By Lifting Height
10.3. Market Attractiveness Analysis
10.3.1. By Country
10.3.2. By Application
10.3.3. By Load Carrying Capacity
10.3.4. By Lifting Height
10.4. Key Takeaways
11. Europe Electric Stacker Market Analysis 2016-2021 and Forecast 2022-2032, By Country
11.1. Historical Market Size Value (US$ Mn) & Volume (Units) Trend Analysis By Market Taxonomy, 2016-2021
11.2. Market Size Value (US$ Mn) & Volume (Units) Forecast By Market Taxonomy, 2022-2032
11.2.1. By Country
11.2.1.1. Germany
11.2.1.2. U.K.
11.2.1.3. France
11.2.1.4. Spain
11.2.1.5. Italy
11.2.1.6. Rest of Europe
11.2.2. By Application
11.2.3. By Load Carrying Capacity
11.2.4. By Lifting Height
11.3. Market Attractiveness Analysis
11.3.1. By Country
11.3.2. By Application
11.3.3. By Load Carrying Capacity
11.3.4. By Lifting Height
11.4. Key Takeaways
12. Asia Pacific Electric Stacker Market Analysis 2016-2021 and Forecast 2022-2032, By Country
12.1. Historical Market Size Value (US$ Mn) & Volume (Units) Trend Analysis By Market Taxonomy, 2016-2021
12.2. Market Size Value (US$ Mn) & Volume (Units) Forecast By Market Taxonomy, 2022-2032
12.2.1. By Country
12.2.1.1. China
12.2.1.2. Japan
12.2.1.3. South Korea
12.2.1.4. Malaysia
12.2.1.5. Singapore
12.2.1.6. Australia
12.2.1.7. New Zealand
12.2.1.8. Rest of APAC
12.2.2. By Application
12.2.3. By Load Carrying Capacity
12.2.4. By Lifting Height
12.3. Market Attractiveness Analysis
12.3.1. By Country
12.3.2. By Application
12.3.3. By Load Carrying Capacity
12.3.4. By Lifting Height
12.4. Key Takeaways
13. MEA Electric Stacker Market Analysis 2016-2021 and Forecast 2022-2032, By Country
13.1. Historical Market Size Value (US$ Mn) & Volume (Units) Trend Analysis By Market Taxonomy, 2016-2021
13.2. Market Size Value (US$ Mn) & Volume (Units) Forecast By Market Taxonomy, 2022-2032
13.2.1. By Country
13.2.1.1. GCC Countries
13.2.1.2. South Africa
13.2.1.3. Israel
13.2.1.4. Rest of MEA
13.2.2. By Application
13.2.3. By Load Carrying Capacity
13.2.4. By Lifting Height
13.3. Market Attractiveness Analysis
13.3.1. By Country
13.3.2. By Application
13.3.3. By Load Carrying Capacity
13.3.4. By Lifting Height
13.4. Key Takeaways
14. Key Countries Electric Stacker Market Analysis
14.1. U.S.
14.1.1. Pricing Analysis
14.1.2. Market Share Analysis, 2021
14.1.2.1. By Application
14.1.2.2. By Load Carrying Capacity
14.1.2.3. By Lifting Height
14.2. Canada
14.2.1. Pricing Analysis
14.2.2. Market Share Analysis, 2021
14.2.2.1. By Application
14.2.2.2. By Load Carrying Capacity
14.2.2.3. By Lifting Height
14.3. Brazil
14.3.1. Pricing Analysis
14.3.2. Market Share Analysis, 2021
14.3.2.1. By Application
14.3.2.2. By Load Carrying Capacity
14.3.2.3. By Lifting Height
14.4. Mexico
14.4.1. Pricing Analysis
14.4.2. Market Share Analysis, 2021
14.4.2.1. By Application
14.4.2.2. By Load Carrying Capacity
14.4.2.3. By Lifting Height
14.5. Germany
14.5.1. Pricing Analysis
14.5.2. Market Share Analysis, 2021
14.5.2.1. By Application
14.5.2.2. By Load Carrying Capacity
14.5.2.3. By Lifting Height
14.6. U.K.
14.6.1. Pricing Analysis
14.6.2. Market Share Analysis, 2021
14.6.2.1. By Application
14.6.2.2. By Load Carrying Capacity
14.6.2.3. By Lifting Height
14.7. France
14.7.1. Pricing Analysis
14.7.2. Market Share Analysis, 2021
14.7.2.1. By Application
14.7.2.2. By Load Carrying Capacity
14.7.2.3. By Lifting Height
14.8. Spain
14.8.1. Pricing Analysis
14.8.2. Market Share Analysis, 2021
14.8.2.1. By Application
14.8.2.2. By Load Carrying Capacity
14.8.2.3. By Lifting Height
14.9. Italy
14.9.1. Pricing Analysis
14.9.2. Market Share Analysis, 2021
14.9.2.1. By Application
14.9.2.2. By Load Carrying Capacity
14.9.2.3. By Lifting Height
14.10. China
14.10.1. Pricing Analysis
14.10.2. Market Share Analysis, 2021
14.10.2.1. By Application
14.10.2.2. By Load Carrying Capacity
14.10.2.3. By Lifting Height
14.11. Japan
14.11.1. Pricing Analysis
14.11.2. Market Share Analysis, 2021
14.11.2.1. By Application
14.11.2.2. By Load Carrying Capacity
14.11.2.3. By Lifting Height
14.12. South Korea
14.12.1. Pricing Analysis
14.12.2. Market Share Analysis, 2021
14.12.2.1. By Application
14.12.2.2. By Load Carrying Capacity
14.12.2.3. By Lifting Height
14.13. Malaysia
14.13.1. Pricing Analysis
14.13.2. Market Share Analysis, 2021
14.13.2.1. By Application
14.13.2.2. By Load Carrying Capacity
14.13.2.3. By Lifting Height
14.14. Singapore
14.14.1. Pricing Analysis
14.14.2. Market Share Analysis, 2021
14.14.2.1. By Application
14.14.2.2. By Load Carrying Capacity
14.14.2.3. By Lifting Height
14.15. Australia
14.15.1. Pricing Analysis
14.15.2. Market Share Analysis, 2021
14.15.2.1. By Application
14.15.2.2. By Load Carrying Capacity
14.15.2.3. By Lifting Height
14.16. New Zealand
14.16.1. Pricing Analysis
14.16.2. Market Share Analysis, 2021
14.16.2.1. By Application
14.16.2.2. By Load Carrying Capacity
14.16.2.3. By Lifting Height
14.17. GCC Countries
14.17.1. Pricing Analysis
14.17.2. Market Share Analysis, 2021
14.17.2.1. By Application
14.17.2.2. By Load Carrying Capacity
14.17.2.3. By Lifting Height
14.18. South Africa
14.18.1. Pricing Analysis
14.18.2. Market Share Analysis, 2021
14.18.2.1. By Application
14.18.2.2. By Load Carrying Capacity
14.18.2.3. By Lifting Height
14.19. Israel
14.19.1. Pricing Analysis
14.19.2. Market Share Analysis, 2021
14.19.2.1. By Application
14.19.2.2. By Load Carrying Capacity
14.19.2.3. By Lifting Height
15. Market Structure Analysis
15.1. Competition Dashboard
15.2. Competition Benchmarking
15.3. Market Share Analysis of Top Players
15.3.1. By Regional
15.3.2. By Application
15.3.3. By Load Carrying Capacity
15.3.4. By Lifting Height
16. Competition Analysis
16.1. Competition Deep Dive
16.1.1. Jost’s Engineering Company Limited
16.1.1.1. Overview
16.1.1.2. Product Portfolio
16.1.1.3. Profitability by Market Segments
16.1.1.4. Sales Footprint
16.1.1.5. Strategy Overview
16.1.1.5.1. Marketing Strategy
16.1.1.5.2. Product Strategy
16.1.1.5.3. Channel Strategy
16.1.2. Jungheinrich AG
16.1.2.1. Overview
16.1.2.2. Product Portfolio
16.1.2.3. Profitability by Market Segments
16.1.2.4. Sales Footprint
16.1.2.5. Strategy Overview
16.1.2.5.1. Marketing Strategy
16.1.2.5.2. Product Strategy
16.1.2.5.3. Channel Strategy
16.1.3. Reliable Storage System
16.1.3.1. Overview
16.1.3.2. Product Portfolio
16.1.3.3. Profitability by Market Segments
16.1.3.4. Sales Footprint
16.1.3.5. Strategy Overview
16.1.3.5.1. Marketing Strategy
16.1.3.5.2. Product Strategy
16.1.3.5.3. Channel Strategy
16.1.4. Gloline Equipment Pvt. Ltd.
16.1.4.1. Overview
16.1.4.2. Product Portfolio
16.1.4.3. Profitability by Market Segments
16.1.4.4. Sales Footprint
16.1.4.5. Strategy Overview
16.1.4.5.1. Marketing Strategy
16.1.4.5.2. Product Strategy
16.1.4.5.3. Channel Strategy
16.1.5. Vestil Manufacturing Corporation
16.1.5.1. Overview
16.1.5.2. Product Portfolio
16.1.5.3. Profitability by Market Segments
16.1.5.4. Sales Footprint
16.1.5.5. Strategy Overview
16.1.5.5.1. Marketing Strategy
16.1.5.5.2. Product Strategy
16.1.5.5.3. Channel Strategy
16.1.6. EP Equipment Co. Ltd.
16.1.6.1. Overview
16.1.6.2. Product Portfolio
16.1.6.3. Profitability by Market Segments
16.1.6.4. Sales Footprint
16.1.6.5. Strategy Overview
16.1.6.5.1. Marketing Strategy
16.1.6.5.2. Product Strategy
16.1.6.5.3. Channel Strategy
16.1.7. CLARK EUROPE GmbH
16.1.7.1. Overview
16.1.7.2. Product Portfolio
16.1.7.3. Profitability by Market Segments
16.1.7.4. Sales Footprint
16.1.7.5. Strategy Overview
16.1.7.5.1. Marketing Strategy
16.1.7.5.2. Product Strategy
16.1.7.5.3. Channel Strategy
16.1.8. MAINI Materials Movement Pvt. Ltd.
16.1.8.1. Overview
16.1.8.2. Product Portfolio
16.1.8.3. Profitability by Market Segments
16.1.8.4. Sales Footprint
16.1.8.5. Strategy Overview
16.1.8.5.1. Marketing Strategy
16.1.8.5.2. Product Strategy
16.1.8.5.3. Channel Strategy
16.1.9. Linde Material Handling GmbH
16.1.9.1. Overview
16.1.9.2. Product Portfolio
16.1.9.3. Profitability by Market Segments
16.1.9.4. Sales Footprint
16.1.9.5. Strategy Overview
16.1.9.5.1. Marketing Strategy
16.1.9.5.2. Product Strategy
16.1.9.5.3. Channel Strategy
16.1.10. Presto Lifts
16.1.10.1. Overview
16.1.10.2. Product Portfolio
16.1.10.3. Profitability by Market Segments
16.1.10.4. Sales Footprint
16.1.10.5. Strategy Overview
16.1.10.5.1. Marketing Strategy
16.1.10.5.2. Product Strategy
16.1.10.5.3. Channel Strategy
16.1.11. PROLIFT Handling Ltd.
16.1.11.1. Overview
16.1.11.2. Product Portfolio
16.1.11.3. Profitability by Market Segments
16.1.11.4. Sales Footprint
16.1.11.5. Strategy Overview
16.1.11.5.1. Marketing Strategy
16.1.11.5.2. Product Strategy
16.1.11.5.3. Channel Strategy
16.1.12. Godrej Material Handling
16.1.12.1. Overview
16.1.12.2. Product Portfolio
16.1.12.3. Profitability by Market Segments
16.1.12.4. Sales Footprint
16.1.12.5. Strategy Overview
16.1.12.5.1. Marketing Strategy
16.1.12.5.2. Product Strategy
16.1.12.5.3. Channel Strategy
17. Assumptions & Acronyms Used
18. Research Methodology
Let us know your requirement to get
100% FREE customization
List of Tables
Table 1: Global Electric Stacker Market Value (US$ Mn) Forecast by Region, 2016-2032
Table 2: Global Electric Stacker Market Volume (Units) Forecast by Region, 2016-2032
Table 3: Global Electric Stacker Market Value (US$ Mn) Forecast by Application, 2016-2032
Table 4: Global Electric Stacker Market Volume (Units) Forecast by Application, 2016-2032
Table 5: Global Electric Stacker Market Value (US$ Mn) Forecast by Load Carrying Capacity, 2016-2032
Table 6: Global Electric Stacker Market Volume (Units) Forecast by Load Carrying Capacity, 2016-2032
Table 7: Global Electric Stacker Market Value (US$ Mn) Forecast by Lifting Height, 2016-2032
Table 8: Global Electric Stacker Market Volume (Units) Forecast by Lifting Height, 2016-2032
Table 9: North America Electric Stacker Market Value (US$ Mn) Forecast by Country, 2016-2032
Table 10: North America Electric Stacker Market Volume (Units) Forecast by Country, 2016-2032
Table 11: North America Electric Stacker Market Value (US$ Mn) Forecast by Application, 2016-2032
Table 12: North America Electric Stacker Market Volume (Units) Forecast by Application, 2016-2032
Table 13: North America Electric Stacker Market Value (US$ Mn) Forecast by Load Carrying Capacity, 2016-2032
Table 14: North America Electric Stacker Market Volume (Units) Forecast by Load Carrying Capacity, 2016-2032
Table 15: North America Electric Stacker Market Value (US$ Mn) Forecast by Lifting Height, 2016-2032
Table 16: North America Electric Stacker Market Volume (Units) Forecast by Lifting Height, 2016-2032
Table 17: Latin America Electric Stacker Market Value (US$ Mn) Forecast by Country, 2016-2032
Table 18: Latin America Electric Stacker Market Volume (Units) Forecast by Country, 2016-2032
Table 19: Latin America Electric Stacker Market Value (US$ Mn) Forecast by Application, 2016-2032
Table 20: Latin America Electric Stacker Market Volume (Units) Forecast by Application, 2016-2032
Table 21: Latin America Electric Stacker Market Value (US$ Mn) Forecast by Load Carrying Capacity, 2016-2032
Table 22: Latin America Electric Stacker Market Volume (Units) Forecast by Load Carrying Capacity, 2016-2032
Table 23: Latin America Electric Stacker Market Value (US$ Mn) Forecast by Lifting Height, 2016-2032
Table 24: Latin America Electric Stacker Market Volume (Units) Forecast by Lifting Height, 2016-2032
Table 25: Europe Electric Stacker Market Value (US$ Mn) Forecast by Country, 2016-2032
Table 26: Europe Electric Stacker Market Volume (Units) Forecast by Country, 2016-2032
Table 27: Europe Electric Stacker Market Value (US$ Mn) Forecast by Application, 2016-2032
Table 28: Europe Electric Stacker Market Volume (Units) Forecast by Application, 2016-2032
Table 29: Europe Electric Stacker Market Value (US$ Mn) Forecast by Load Carrying Capacity, 2016-2032
Table 30: Europe Electric Stacker Market Volume (Units) Forecast by Load Carrying Capacity, 2016-2032
Table 31: Europe Electric Stacker Market Value (US$ Mn) Forecast by Lifting Height, 2016-2032
Table 32: Europe Electric Stacker Market Volume (Units) Forecast by Lifting Height, 2016-2032
Table 33: Asia Pacific Electric Stacker Market Value (US$ Mn) Forecast by Country, 2016-2032
Table 34: Asia Pacific Electric Stacker Market Volume (Units) Forecast by Country, 2016-2032
Table 35: Asia Pacific Electric Stacker Market Value (US$ Mn) Forecast by Application, 2016-2032
Table 36: Asia Pacific Electric Stacker Market Volume (Units) Forecast by Application, 2016-2032
Table 37: Asia Pacific Electric Stacker Market Value (US$ Mn) Forecast by Load Carrying Capacity, 2016-2032
Table 38: Asia Pacific Electric Stacker Market Volume (Units) Forecast by Load Carrying Capacity, 2016-2032
Table 39: Asia Pacific Electric Stacker Market Value (US$ Mn) Forecast by Lifting Height, 2016-2032
Table 40: Asia Pacific Electric Stacker Market Volume (Units) Forecast by Lifting Height, 2016-2032
Table 41: MEA Electric Stacker Market Value (US$ Mn) Forecast by Country, 2016-2032
Table 42: MEA Electric Stacker Market Volume (Units) Forecast by Country, 2016-2032
Table 43: MEA Electric Stacker Market Value (US$ Mn) Forecast by Application, 2016-2032
Table 44: MEA Electric Stacker Market Volume (Units) Forecast by Application, 2016-2032
Table 45: MEA Electric Stacker Market Value (US$ Mn) Forecast by Load Carrying Capacity, 2016-2032
Table 46: MEA Electric Stacker Market Volume (Units) Forecast by Load Carrying Capacity, 2016-2032
Table 47: MEA Electric Stacker Market Value (US$ Mn) Forecast by Lifting Height, 2016-2032
Table 48: MEA Electric Stacker Market Volume (Units) Forecast by Lifting Height, 2016-2032
Find your sweet spots for generating winning opportunities in this market.
Talk to AnalystList of Charts
Figure 1: Global Electric Stacker Market Value (US$ Mn) by Application, 2022-2032
Figure 2: Global Electric Stacker Market Value (US$ Mn) by Load Carrying Capacity, 2022-2032
Figure 3: Global Electric Stacker Market Value (US$ Mn) by Lifting Height, 2022-2032
Figure 4: Global Electric Stacker Market Value (US$ Mn) by Region, 2022-2032
Figure 5: Global Electric Stacker Market Value (US$ Mn) Analysis by Region, 2016-2032
Figure 6: Global Electric Stacker Market Volume (Units) Analysis by Region, 2016-2032
Figure 7: Global Electric Stacker Market Value Share (%) and BPS Analysis by Region, 2022-2032
Figure 8: Global Electric Stacker Market Y-o-Y Growth (%) Projections by Region, 2022-2032
Figure 9: Global Electric Stacker Market Value (US$ Mn) Analysis by Application, 2016-2032
Figure 10: Global Electric Stacker Market Volume (Units) Analysis by Application, 2016-2032
Figure 11: Global Electric Stacker Market Value Share (%) and BPS Analysis by Application, 2022-2032
Figure 12: Global Electric Stacker Market Y-o-Y Growth (%) Projections by Application, 2022-2032
Figure 13: Global Electric Stacker Market Value (US$ Mn) Analysis by Load Carrying Capacity, 2016-2032
Figure 14: Global Electric Stacker Market Volume (Units) Analysis by Load Carrying Capacity, 2016-2032
Figure 15: Global Electric Stacker Market Value Share (%) and BPS Analysis by Load Carrying Capacity, 2022-2032
Figure 16: Global Electric Stacker Market Y-o-Y Growth (%) Projections by Load Carrying Capacity, 2022-2032
Figure 17: Global Electric Stacker Market Value (US$ Mn) Analysis by Lifting Height, 2016-2032
Figure 18: Global Electric Stacker Market Volume (Units) Analysis by Lifting Height, 2016-2032
Figure 19: Global Electric Stacker Market Value Share (%) and BPS Analysis by Lifting Height, 2022-2032
Figure 20: Global Electric Stacker Market Y-o-Y Growth (%) Projections by Lifting Height, 2022-2032
Figure 21: Global Electric Stacker Market Attractiveness by Application, 2022-2032
Figure 22: Global Electric Stacker Market Attractiveness by Load Carrying Capacity, 2022-2032
Figure 23: Global Electric Stacker Market Attractiveness by Lifting Height, 2022-2032
Figure 24: Global Electric Stacker Market Attractiveness by Region, 2022-2032
Figure 25: North America Electric Stacker Market Value (US$ Mn) by Application, 2022-2032
Figure 26: North America Electric Stacker Market Value (US$ Mn) by Load Carrying Capacity, 2022-2032
Figure 27: North America Electric Stacker Market Value (US$ Mn) by Lifting Height, 2022-2032
Figure 28: North America Electric Stacker Market Value (US$ Mn) by Country, 2022-2032
Figure 29: North America Electric Stacker Market Value (US$ Mn) Analysis by Country, 2016-2032
Figure 30: North America Electric Stacker Market Volume (Units) Analysis by Country, 2016-2032
Figure 31: North America Electric Stacker Market Value Share (%) and BPS Analysis by Country, 2022-2032
Figure 32: North America Electric Stacker Market Y-o-Y Growth (%) Projections by Country, 2022-2032
Figure 33: North America Electric Stacker Market Value (US$ Mn) Analysis by Application, 2016-2032
Figure 34: North America Electric Stacker Market Volume (Units) Analysis by Application, 2016-2032
Figure 35: North America Electric Stacker Market Value Share (%) and BPS Analysis by Application, 2022-2032
Figure 36: North America Electric Stacker Market Y-o-Y Growth (%) Projections by Application, 2022-2032
Figure 37: North America Electric Stacker Market Value (US$ Mn) Analysis by Load Carrying Capacity, 2016-2032
Figure 38: North America Electric Stacker Market Volume (Units) Analysis by Load Carrying Capacity, 2016-2032
Figure 39: North America Electric Stacker Market Value Share (%) and BPS Analysis by Load Carrying Capacity, 2022-2032
Figure 40: North America Electric Stacker Market Y-o-Y Growth (%) Projections by Load Carrying Capacity, 2022-2032
Figure 41: North America Electric Stacker Market Value (US$ Mn) Analysis by Lifting Height, 2016-2032
Figure 42: North America Electric Stacker Market Volume (Units) Analysis by Lifting Height, 2016-2032
Figure 43: North America Electric Stacker Market Value Share (%) and BPS Analysis by Lifting Height, 2022-2032
Figure 44: North America Electric Stacker Market Y-o-Y Growth (%) Projections by Lifting Height, 2022-2032
Figure 45: North America Electric Stacker Market Attractiveness by Application, 2022-2032
Figure 46: North America Electric Stacker Market Attractiveness by Load Carrying Capacity, 2022-2032
Figure 47: North America Electric Stacker Market Attractiveness by Lifting Height, 2022-2032
Figure 48: North America Electric Stacker Market Attractiveness by Country, 2022-2032
Figure 49: Latin America Electric Stacker Market Value (US$ Mn) by Application, 2022-2032
Figure 50: Latin America Electric Stacker Market Value (US$ Mn) by Load Carrying Capacity, 2022-2032
Figure 51: Latin America Electric Stacker Market Value (US$ Mn) by Lifting Height, 2022-2032
Figure 52: Latin America Electric Stacker Market Value (US$ Mn) by Country, 2022-2032
Figure 53: Latin America Electric Stacker Market Value (US$ Mn) Analysis by Country, 2016-2032
Figure 54: Latin America Electric Stacker Market Volume (Units) Analysis by Country, 2016-2032
Figure 55: Latin America Electric Stacker Market Value Share (%) and BPS Analysis by Country, 2022-2032
Figure 56: Latin America Electric Stacker Market Y-o-Y Growth (%) Projections by Country, 2022-2032
Figure 57: Latin America Electric Stacker Market Value (US$ Mn) Analysis by Application, 2016-2032
Figure 58: Latin America Electric Stacker Market Volume (Units) Analysis by Application, 2016-2032
Figure 59: Latin America Electric Stacker Market Value Share (%) and BPS Analysis by Application, 2022-2032
Figure 60: Latin America Electric Stacker Market Y-o-Y Growth (%) Projections by Application, 2022-2032
Figure 61: Latin America Electric Stacker Market Value (US$ Mn) Analysis by Load Carrying Capacity, 2016-2032
Figure 62: Latin America Electric Stacker Market Volume (Units) Analysis by Load Carrying Capacity, 2016-2032
Figure 63: Latin America Electric Stacker Market Value Share (%) and BPS Analysis by Load Carrying Capacity, 2022-2032
Figure 64: Latin America Electric Stacker Market Y-o-Y Growth (%) Projections by Load Carrying Capacity, 2022-2032
Figure 65: Latin America Electric Stacker Market Value (US$ Mn) Analysis by Lifting Height, 2016-2032
Figure 66: Latin America Electric Stacker Market Volume (Units) Analysis by Lifting Height, 2016-2032
Figure 67: Latin America Electric Stacker Market Value Share (%) and BPS Analysis by Lifting Height, 2022-2032
Figure 68: Latin America Electric Stacker Market Y-o-Y Growth (%) Projections by Lifting Height, 2022-2032
Figure 69: Latin America Electric Stacker Market Attractiveness by Application, 2022-2032
Figure 70: Latin America Electric Stacker Market Attractiveness by Load Carrying Capacity, 2022-2032
Figure 71: Latin America Electric Stacker Market Attractiveness by Lifting Height, 2022-2032
Figure 72: Latin America Electric Stacker Market Attractiveness by Country, 2022-2032
Figure 73: Europe Electric Stacker Market Value (US$ Mn) by Application, 2022-2032
Figure 74: Europe Electric Stacker Market Value (US$ Mn) by Load Carrying Capacity, 2022-2032
Figure 75: Europe Electric Stacker Market Value (US$ Mn) by Lifting Height, 2022-2032
Figure 76: Europe Electric Stacker Market Value (US$ Mn) by Country, 2022-2032
Figure 77: Europe Electric Stacker Market Value (US$ Mn) Analysis by Country, 2016-2032
Figure 78: Europe Electric Stacker Market Volume (Units) Analysis by Country, 2016-2032
Figure 79: Europe Electric Stacker Market Value Share (%) and BPS Analysis by Country, 2022-2032
Figure 80: Europe Electric Stacker Market Y-o-Y Growth (%) Projections by Country, 2022-2032
Figure 81: Europe Electric Stacker Market Value (US$ Mn) Analysis by Application, 2016-2032
Figure 82: Europe Electric Stacker Market Volume (Units) Analysis by Application, 2016-2032
Figure 83: Europe Electric Stacker Market Value Share (%) and BPS Analysis by Application, 2022-2032
Figure 84: Europe Electric Stacker Market Y-o-Y Growth (%) Projections by Application, 2022-2032
Figure 85: Europe Electric Stacker Market Value (US$ Mn) Analysis by Load Carrying Capacity, 2016-2032
Figure 86: Europe Electric Stacker Market Volume (Units) Analysis by Load Carrying Capacity, 2016-2032
Figure 87: Europe Electric Stacker Market Value Share (%) and BPS Analysis by Load Carrying Capacity, 2022-2032
Figure 88: Europe Electric Stacker Market Y-o-Y Growth (%) Projections by Load Carrying Capacity, 2022-2032
Figure 89: Europe Electric Stacker Market Value (US$ Mn) Analysis by Lifting Height, 2016-2032
Figure 90: Europe Electric Stacker Market Volume (Units) Analysis by Lifting Height, 2016-2032
Figure 91: Europe Electric Stacker Market Value Share (%) and BPS Analysis by Lifting Height, 2022-2032
Figure 92: Europe Electric Stacker Market Y-o-Y Growth (%) Projections by Lifting Height, 2022-2032
Figure 93: Europe Electric Stacker Market Attractiveness by Application, 2022-2032
Figure 94: Europe Electric Stacker Market Attractiveness by Load Carrying Capacity, 2022-2032
Figure 95: Europe Electric Stacker Market Attractiveness by Lifting Height, 2022-2032
Figure 96: Europe Electric Stacker Market Attractiveness by Country, 2022-2032
Figure 97: Asia Pacific Electric Stacker Market Value (US$ Mn) by Application, 2022-2032
Figure 98: Asia Pacific Electric Stacker Market Value (US$ Mn) by Load Carrying Capacity, 2022-2032
Figure 99: Asia Pacific Electric Stacker Market Value (US$ Mn) by Lifting Height, 2022-2032
Figure 100: Asia Pacific Electric Stacker Market Value (US$ Mn) by Country, 2022-2032
Figure 101: Asia Pacific Electric Stacker Market Value (US$ Mn) Analysis by Country, 2016-2032
Figure 102: Asia Pacific Electric Stacker Market Volume (Units) Analysis by Country, 2016-2032
Figure 103: Asia Pacific Electric Stacker Market Value Share (%) and BPS Analysis by Country, 2022-2032
Figure 104: Asia Pacific Electric Stacker Market Y-o-Y Growth (%) Projections by Country, 2022-2032
Figure 105: Asia Pacific Electric Stacker Market Value (US$ Mn) Analysis by Application, 2016-2032
Figure 106: Asia Pacific Electric Stacker Market Volume (Units) Analysis by Application, 2016-2032
Figure 107: Asia Pacific Electric Stacker Market Value Share (%) and BPS Analysis by Application, 2022-2032
Figure 108: Asia Pacific Electric Stacker Market Y-o-Y Growth (%) Projections by Application, 2022-2032
Figure 109: Asia Pacific Electric Stacker Market Value (US$ Mn) Analysis by Load Carrying Capacity, 2016-2032
Figure 110: Asia Pacific Electric Stacker Market Volume (Units) Analysis by Load Carrying Capacity, 2016-2032
Figure 111: Asia Pacific Electric Stacker Market Value Share (%) and BPS Analysis by Load Carrying Capacity, 2022-2032
Figure 112: Asia Pacific Electric Stacker Market Y-o-Y Growth (%) Projections by Load Carrying Capacity, 2022-2032
Figure 113: Asia Pacific Electric Stacker Market Value (US$ Mn) Analysis by Lifting Height, 2016-2032
Figure 114: Asia Pacific Electric Stacker Market Volume (Units) Analysis by Lifting Height, 2016-2032
Figure 115: Asia Pacific Electric Stacker Market Value Share (%) and BPS Analysis by Lifting Height, 2022-2032
Figure 116: Asia Pacific Electric Stacker Market Y-o-Y Growth (%) Projections by Lifting Height, 2022-2032
Figure 117: Asia Pacific Electric Stacker Market Attractiveness by Application, 2022-2032
Figure 118: Asia Pacific Electric Stacker Market Attractiveness by Load Carrying Capacity, 2022-2032
Figure 119: Asia Pacific Electric Stacker Market Attractiveness by Lifting Height, 2022-2032
Figure 120: Asia Pacific Electric Stacker Market Attractiveness by Country, 2022-2032
Figure 121: MEA Electric Stacker Market Value (US$ Mn) by Application, 2022-2032
Figure 122: MEA Electric Stacker Market Value (US$ Mn) by Load Carrying Capacity, 2022-2032
Figure 123: MEA Electric Stacker Market Value (US$ Mn) by Lifting Height, 2022-2032
Figure 124: MEA Electric Stacker Market Value (US$ Mn) by Country, 2022-2032
Figure 125: MEA Electric Stacker Market Value (US$ Mn) Analysis by Country, 2016-2032
Figure 126: MEA Electric Stacker Market Volume (Units) Analysis by Country, 2016-2032
Figure 127: MEA Electric Stacker Market Value Share (%) and BPS Analysis by Country, 2022-2032
Figure 128: MEA Electric Stacker Market Y-o-Y Growth (%) Projections by Country, 2022-2032
Figure 129: MEA Electric Stacker Market Value (US$ Mn) Analysis by Application, 2016-2032
Figure 130: MEA Electric Stacker Market Volume (Units) Analysis by Application, 2016-2032
Figure 131: MEA Electric Stacker Market Value Share (%) and BPS Analysis by Application, 2022-2032
Figure 132: MEA Electric Stacker Market Y-o-Y Growth (%) Projections by Application, 2022-2032
Figure 133: MEA Electric Stacker Market Value (US$ Mn) Analysis by Load Carrying Capacity, 2016-2032
Figure 134: MEA Electric Stacker Market Volume (Units) Analysis by Load Carrying Capacity, 2016-2032
Figure 135: MEA Electric Stacker Market Value Share (%) and BPS Analysis by Load Carrying Capacity, 2022-2032
Figure 136: MEA Electric Stacker Market Y-o-Y Growth (%) Projections by Load Carrying Capacity, 2022-2032
Figure 137: MEA Electric Stacker Market Value (US$ Mn) Analysis by Lifting Height, 2016-2032
Figure 138: MEA Electric Stacker Market Volume (Units) Analysis by Lifting Height, 2016-2032
Figure 139: MEA Electric Stacker Market Value Share (%) and BPS Analysis by Lifting Height, 2022-2032
Figure 140: MEA Electric Stacker Market Y-o-Y Growth (%) Projections by Lifting Height, 2022-2032
Figure 141: MEA Electric Stacker Market Attractiveness by Application, 2022-2032
Figure 142: MEA Electric Stacker Market Attractiveness by Load Carrying Capacity, 2022-2032
Figure 143: MEA Electric Stacker Market Attractiveness by Lifting Height, 2022-2032
Figure 144: MEA Electric Stacker Market Attractiveness by Country, 2022-2032
Need specific information?
Request CustomizationExplore Technology Insights
View Reports