Pallet Jacks Market
Market Insights on Pallet Jacks covering sales outlook, demand forecast & up-to-date key trends
Pallet Jacks Market by Capacity, Product, End Use & Region - Forecast 2022 - 2032
Pallet Jacks Market Outlook (2022-2032)
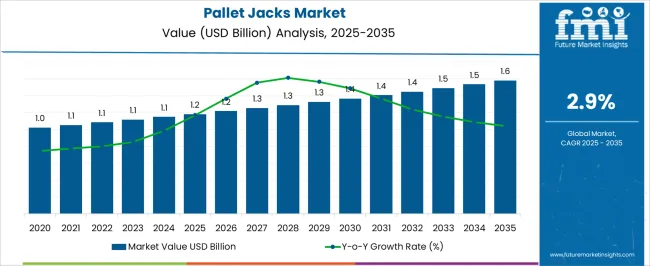
[308 Pages Report] The pallet jacks market, which is valued at US$ 1054.1 million as on 2022, is anticipated to be valued at US$ 1888.3 million in 2032 and is expected to grow at a CAGR of 6% during the forecast period. The increased demand for material handling with increase in the number of warehouses and plenty of other factors are anticipated to increase the demand for pallet jacks.
Report Attribute |
Details |
Pallet Jacks Market Valuation as on 2022 |
US$ 1054.1 million |
Pallet Jacks Market Anticipated Forecast Value (2032) |
US$ 1888.3 million |
Pallet Jacks Market Projected Growth Rate (2022-2032) |
6% |
The availability of fully automated electric pallet jacks, which have the capacity to handle high-capacity goods, is expected to surge the adoption of pallet jacks. Moreover, even the statistics reveal that the sales of pallet jacks are expected to surge during the forecast period.
The historical CAGR for the pallet jacks market was 4.3% during 2016-2021. But with the increase in the applications, the CAGR for the forecast period is predicted to be 6%, which shows a huge surge in the coming times.
Let us know your requirement to get
100% FREE customization
What Are The Current Market Dynamics Pertaining To Pallet Jacks Market?
The evolution in logistics has led to a rapid increase in the number of storehouses. With so much increase in the number of storehouses, the continuous movement of heavy products is a common activity.
The expected surge in demand for pallet jacks can be attributed to the fact that they assist in the seamless movement of such heavy goods, which in turn increases the efficiency of the entire value chain.
While manually handling heavy goods, there might be unforeseen accidents. If such activities are performed by pallet jacks, there would not be many cases related to accidents, which is anticipated to surge the demand for pallet jacks.
The sales of pallet jacks are also driven by the fact that they help in cost-cutting. They operate using electricity, because of which they utilize much less energy as compared to gasoline-operated equipment.
The pallet jacks are available in a variety of sizes, which makes it easier for the manufacturers to choose the size they desire to. This is something that is expected to further increase the adoption of pallet jacks.
The pallet jacks are easy to use as well and do not require any technical training on how to operate. This is something that is projected to increase the sales of pallet jacks. Another major driver of the pallet jacks market share is the rapid urbanization process. Rapid urbanisation in developing countries presents a huge opportunity to such markets as these are the countries that are willing the most to invest in development activities.
There has been an increase in the application of various advanced technologies like IoT, Robotics, etc., to fully automate the process of material handling. These applications are used along with pallet jacks for increased efficiency.
The growth of the E-Commerce industry presents a huge opportunity to the pallet jacks market as this industry invests a lot in the development of warehouses, and the pallet jacks play a vital role in the management of warehouses.
Regional Analysis
How is the Performance of North American Pallet Jacks Market?
North America, which currently has a market share of 25%, is expected to grow significantly during the forecast period. The growth in the IoT, Robotics and E commerce sector is expected to increase the pallet jacks market size in this region.
How is the Performance of European Pallet Jacks Market?
Europe, which currently has a market share of 21%, is expected to grow at a decent rate during the forecast period. Specifically in Europe, there have been company policies pertaining to employee wellness.
Taking these factors into consideration, the companies have started implementing pallet jacks for transporting heavy materials instead of involving human beings to bear the weight of such materials, and this has been implemented on a large-scale basis.
Additionally, in Europe as well, there has been a growth in Robotics and E commerce sector, which has led to increase in the adoption of pallet jacks.
Find your sweet spots for generating winning opportunities in this market.
Talk to AnalystHow Is The Start Up Ecosystem In The Pallet Jacks Market?
With the evolution of technology, and people expecting simpler solutions for logistics, the start up community of pallet jacks market is actively involved in providing the best possible solutions for our needs. Some of the start-ups are Ant Robotics and Vecna Robotics.
The aim of these start-ups has been to integrate robotics with pallet jacks, thus making the entire process fully automated and ensuring maximum efficiency along with maximum safety.
Who Are Some Of The Key Market Players In The Pallet Jacks Market?
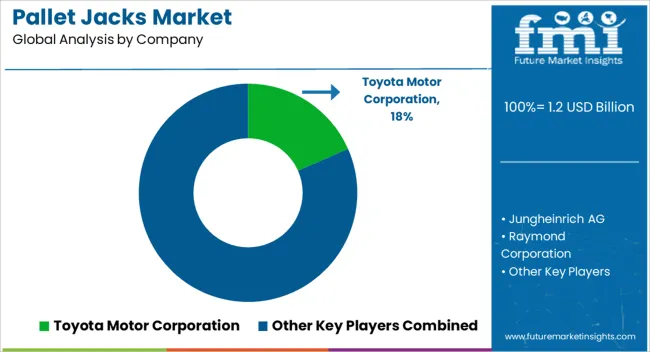
Some of the key players in the pallet jacks market are: Toyota Motor Corporation, Jungheinrich AG, Raymond Corporation, Yale Materials Handling Corporation, Clark Material Handling Company Inc., Crown Equipment Corporation, Komatsu Ltd., Godrej Material Handling, Carborundum Universal Limited (CUMI), Jost's Engineering Company Limited, Patel Material Handling Equipment, Noveltek Industrial Manufacturing, Niuli Machinery Manufacture Co. Ltd, Ningbo Ruyi Joint Stock Co. Ltd., Wesco Industrial Products LLC and Mitsubishi Caterpillar Forklift America Inc.
To increase the efficiency and to focus towards cost cutting for the customers, the key players are developing pallet jacks that save more than 20% electricity and come with a battery life of 5 years.
- In January 2022, Crown equipped its Wave Work Assist Vehicle with cutting-edge V-Force Lithium-Ion Battery technology, because of which the vehicle supports opportunity charging, and can be used for a wide range of applications.
- In March 2022, Yale Materials Handling Corporation announced key technology update to its enclosed end rider, which is designed to support ergonomics and high productivity in demanding warehouse settings.

An unified Market Research Subscription Platform, built for today’s disparate research needs.
Report Scope
Report Attribute |
Details |
Growth Rate |
CAGR of 6% from 2022 to 2032 |
Base Year for Estimation |
2021 |
Historical Data |
2014-2020 |
Forecast Period |
2022-2032 |
Quantitative Units |
Revenue in USD million and CAGR from 2022-2032 |
Report Coverage |
Revenue Forecast, Volume Forecast, Company Ranking, Competitive Landscape, Growth Factors, Trends and Pricing Analysis |
Segments Covered |
|
Regions Covered |
|
Key Countries Profiled |
|
Key Companies Profiled |
|
Customization |
Available Upon Request |
Key Segments Profiled In The Pallet Jacks Market Survey
By Capacity:
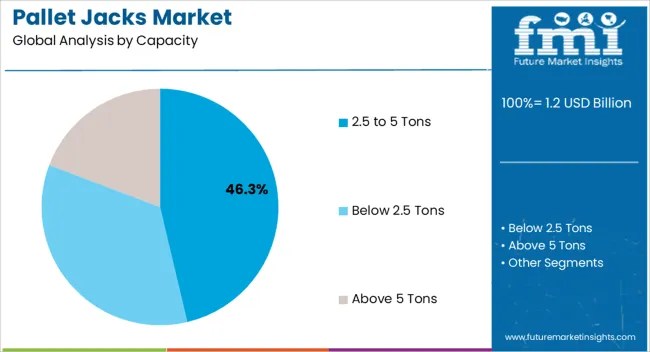
- Below 2.5 Tons
- 2.5 to 5 Tons
- Above 5 Tons
By Product:
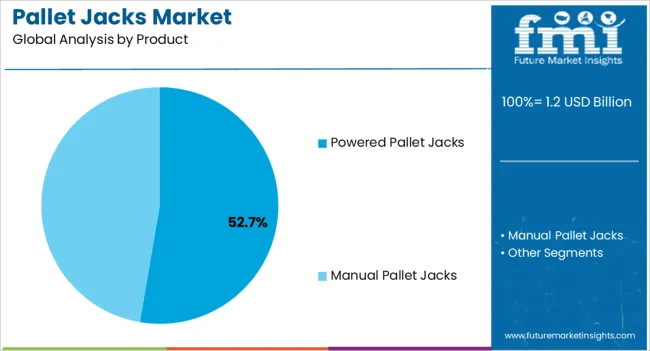
- Manual Pallet Jacks
- Powered Pallet Jacks
By End Use:
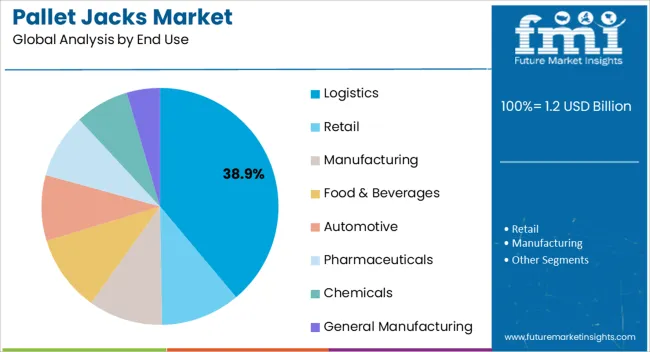
- Logistics
- Retail
- Manufacturing
- Food & Beverages
- Automotive
- Pharmaceuticals
- Chemicals
- General Manufacturing
- Aerospace & Defence
By Region:
- North America
- Latin America
- Europe
- East Asia
- South Asia
- Oceania
- Middle East and Africa
Frequently Asked Questions
The pallet jacks market is projected to grow at a CAGR of 6% during the forecast period (2022-2032).
The pallet jacks market has a valuation of US$ 1054.1 million as on 2022.
The pallet jacks market is expected to be valued US$ 1888.3 million by 2032.
Table of Content
1. Executive Summary
1.1. Global Market Outlook
1.2. Demand-side Trends
1.3. Supply-side Trends
1.4. Technology Roadmap Analysis
1.5. Analysis and Recommendations
2. Market Overview
2.1. Market Coverage / Taxonomy
2.2. Market Definition / Scope / Limitations
3. Market Background
3.1. Market Dynamics
3.1.1. Drivers
3.1.2. Restraints
3.1.3. Opportunity
3.1.4. Trends
3.2. Scenario Forecast
3.2.1. Demand in Optimistic Scenario
3.2.2. Demand in Likely Scenario
3.2.3. Demand in Conservative Scenario
3.3. Opportunity Map Analysis
3.4. Product Life Cycle Analysis
3.5. Supply Chain Analysis
3.5.1. Supply Side Participants and their Roles
3.5.1.1. Producers
3.5.1.2. Mid-Level Participants (Traders/ Agents/ Brokers)
3.5.1.3. Wholesalers and Distributors
3.5.2. Value Added and Value Created at Node in the Supply Chain
3.5.3. List of Raw Material Suppliers
3.5.4. List of Existing and Potential Buyer’s
3.6. Investment Feasibility Matrix
3.7. Value Chain Analysis
3.7.1. Profit Margin Analysis
3.7.2. Wholesalers and Distributors
3.7.3. Retailers
3.8. PESTLE and Porter’s Analysis
3.9. Regulatory Landscape
3.9.1. By Key Regions
3.9.2. By Key Countries
3.10. Regional Parent Market Outlook
3.11. Production and Consumption Statistics
3.12. Import and Export Statistics
4. Global Pallet Jacks Market Analysis 2017-2021 and Forecast, 2022-2032
4.1. Historical Market Size Value (US$ Mn) & Volume (Units) Analysis, 2017-2021
4.2. Current and Future Market Size Value (US$ Mn) & Volume (Units) Projections, 2022-2032
4.2.1. Y-o-Y Growth Trend Analysis
4.2.2. Absolute $ Opportunity Analysis
5. Global Pallet Jacks Market Analysis 2017-2021 and Forecast 2022-2032, By Product Type
5.1. Introduction / Key Findings
5.2. Historical Market Size Value (US$ Mn) & Volume (Units) Analysis By Product Type, 2017-2021
5.3. Current and Future Market Size Value (US$ Mn) & Volume (Units) Analysis and Forecast By Product Type, 2022-2032
5.3.1. Manual
5.3.2. Electric
5.4. Y-o-Y Growth Trend Analysis By Product Type, 2017-2021
5.5. Absolute $ Opportunity Analysis By Product Type, 2022-2032
6. Global Pallet Jacks Market Analysis 2017-2021 and Forecast 2022-2032, By Load Capacity
6.1. Introduction / Key Findings
6.2. Historical Market Size Value (US$ Mn) & Volume (Units) Analysis By Load Capacity, 2017-2021
6.3. Current and Future Market Size Value (US$ Mn) & Volume (Units) Analysis and Forecast By Load Capacity, 2022-2032
6.3.1. Standard
6.3.2. High Lift
6.4. Y-o-Y Growth Trend Analysis By Load Capacity, 2017-2021
6.5. Absolute $ Opportunity Analysis By Load Capacity, 2022-2032
7. Global Pallet Jacks Market Analysis 2017-2021 and Forecast 2022-2032, By End Use
7.1. Introduction / Key Findings
7.2. Historical Market Size Value (US$ Mn) & Volume (Units) Analysis By End Use, 2017-2021
7.3. Current and Future Market Size Value (US$ Mn) & Volume (Units) Analysis and Forecast By End Use, 2022-2032
7.3.1. Retail Store
7.3.2. Warehousing
7.3.3. Manufacturing Plant
7.3.4. Others
7.4. Y-o-Y Growth Trend Analysis By End Use, 2017-2021
7.5. Absolute $ Opportunity Analysis By End Use, 2022-2032
8. Global Pallet Jacks Market Analysis 2017-2021 and Forecast 2022-2032, By Region
8.1. Introduction
8.2. Historical Market Size Value (US$ Mn) & Volume (Units) Analysis By Region, 2017-2021
8.3. Current Market Size Value (US$ Mn) & Volume (Units) Analysis and Forecast By Region, 2022-2032
8.3.1. North America
8.3.2. Latin America
8.3.3. Europe
8.3.4. Asia Pacific
8.3.5. MEA
8.4. Market Attractiveness Analysis By Region
9. North America Pallet Jacks Market Analysis 2017-2021 and Forecast 2022-2032, By Country
9.1. Historical Market Size Value (US$ Mn) & Volume (Units) Trend Analysis By Market Taxonomy, 2017-2021
9.2. Market Size Value (US$ Mn) & Volume (Units) Forecast By Market Taxonomy, 2022-2032
9.2.1. By Country
9.2.1.1. U.S.
9.2.1.2. Canada
9.2.2. By Product Type
9.2.3. By Load Capacity
9.2.4. By End Use
9.3. Market Attractiveness Analysis
9.3.1. By Country
9.3.2. By Product Type
9.3.3. By Load Capacity
9.3.4. By End Use
9.4. Key Takeaways
10. Latin America Pallet Jacks Market Analysis 2017-2021 and Forecast 2022-2032, By Country
10.1. Historical Market Size Value (US$ Mn) & Volume (Units) Trend Analysis By Market Taxonomy, 2017-2021
10.2. Market Size Value (US$ Mn) & Volume (Units) Forecast By Market Taxonomy, 2022-2032
10.2.1. By Country
10.2.1.1. Brazil
10.2.1.2. Mexico
10.2.1.3. Rest of Latin America
10.2.2. By Product Type
10.2.3. By Load Capacity
10.2.4. By End Use
10.3. Market Attractiveness Analysis
10.3.1. By Country
10.3.2. By Product Type
10.3.3. By Load Capacity
10.3.4. By End Use
10.4. Key Takeaways
11. Europe Pallet Jacks Market Analysis 2017-2021 and Forecast 2022-2032, By Country
11.1. Historical Market Size Value (US$ Mn) & Volume (Units) Trend Analysis By Market Taxonomy, 2017-2021
11.2. Market Size Value (US$ Mn) & Volume (Units) Forecast By Market Taxonomy, 2022-2032
11.2.1. By Country
11.2.1.1. Germany
11.2.1.2. U.K.
11.2.1.3. France
11.2.1.4. Spain
11.2.1.5. Italy
11.2.1.6. Rest of Europe
11.2.2. By Product Type
11.2.3. By Load Capacity
11.2.4. By End Use
11.3. Market Attractiveness Analysis
11.3.1. By Country
11.3.2. By Product Type
11.3.3. By Load Capacity
11.3.4. By End Use
11.4. Key Takeaways
12. Asia Pacific Pallet Jacks Market Analysis 2017-2021 and Forecast 2022-2032, By Country
12.1. Historical Market Size Value (US$ Mn) & Volume (Units) Trend Analysis By Market Taxonomy, 2017-2021
12.2. Market Size Value (US$ Mn) & Volume (Units) Forecast By Market Taxonomy, 2022-2032
12.2.1. By Country
12.2.1.1. China
12.2.1.2. Japan
12.2.1.3. South Korea
12.2.1.4. Malaysia
12.2.1.5. Singapore
12.2.1.6. Australia
12.2.1.7. New Zealand
12.2.1.8. Rest of APAC
12.2.2. By Product Type
12.2.3. By Load Capacity
12.2.4. By End Use
12.3. Market Attractiveness Analysis
12.3.1. By Country
12.3.2. By Product Type
12.3.3. By Load Capacity
12.3.4. By End Use
12.4. Key Takeaways
13. MEA Pallet Jacks Market Analysis 2017-2021 and Forecast 2022-2032, By Country
13.1. Historical Market Size Value (US$ Mn) & Volume (Units) Trend Analysis By Market Taxonomy, 2017-2021
13.2. Market Size Value (US$ Mn) & Volume (Units) Forecast By Market Taxonomy, 2022-2032
13.2.1. By Country
13.2.1.1. GCC Countries
13.2.1.2. South Africa
13.2.1.3. Israel
13.2.1.4. Rest of MEA
13.2.2. By Product Type
13.2.3. By Load Capacity
13.2.4. By End Use
13.3. Market Attractiveness Analysis
13.3.1. By Country
13.3.2. By Product Type
13.3.3. By Load Capacity
13.3.4. By End Use
13.4. Key Takeaways
14. Key Countries Pallet Jacks Market Analysis
14.1. U.S.
14.1.1. Pricing Analysis
14.1.2. Market Share Analysis, 2021
14.1.2.1. By Product Type
14.1.2.2. By Load Capacity
14.1.2.3. By End Use
14.2. Canada
14.2.1. Pricing Analysis
14.2.2. Market Share Analysis, 2021
14.2.2.1. By Product Type
14.2.2.2. By Load Capacity
14.2.2.3. By End Use
14.3. Brazil
14.3.1. Pricing Analysis
14.3.2. Market Share Analysis, 2021
14.3.2.1. By Product Type
14.3.2.2. By Load Capacity
14.3.2.3. By End Use
14.4. Mexico
14.4.1. Pricing Analysis
14.4.2. Market Share Analysis, 2021
14.4.2.1. By Product Type
14.4.2.2. By Load Capacity
14.4.2.3. By End Use
14.5. Germany
14.5.1. Pricing Analysis
14.5.2. Market Share Analysis, 2021
14.5.2.1. By Product Type
14.5.2.2. By Load Capacity
14.5.2.3. By End Use
14.6. U.K.
14.6.1. Pricing Analysis
14.6.2. Market Share Analysis, 2021
14.6.2.1. By Product Type
14.6.2.2. By Load Capacity
14.6.2.3. By End Use
14.7. France
14.7.1. Pricing Analysis
14.7.2. Market Share Analysis, 2021
14.7.2.1. By Product Type
14.7.2.2. By Load Capacity
14.7.2.3. By End Use
14.8. Spain
14.8.1. Pricing Analysis
14.8.2. Market Share Analysis, 2021
14.8.2.1. By Product Type
14.8.2.2. By Load Capacity
14.8.2.3. By End Use
14.9. Italy
14.9.1. Pricing Analysis
14.9.2. Market Share Analysis, 2021
14.9.2.1. By Product Type
14.9.2.2. By Load Capacity
14.9.2.3. By End Use
14.10. China
14.10.1. Pricing Analysis
14.10.2. Market Share Analysis, 2021
14.10.2.1. By Product Type
14.10.2.2. By Load Capacity
14.10.2.3. By End Use
14.11. Japan
14.11.1. Pricing Analysis
14.11.2. Market Share Analysis, 2021
14.11.2.1. By Product Type
14.11.2.2. By Load Capacity
14.11.2.3. By End Use
14.12. South Korea
14.12.1. Pricing Analysis
14.12.2. Market Share Analysis, 2021
14.12.2.1. By Product Type
14.12.2.2. By Load Capacity
14.12.2.3. By End Use
14.13. Malaysia
14.13.1. Pricing Analysis
14.13.2. Market Share Analysis, 2021
14.13.2.1. By Product Type
14.13.2.2. By Load Capacity
14.13.2.3. By End Use
14.14. Singapore
14.14.1. Pricing Analysis
14.14.2. Market Share Analysis, 2021
14.14.2.1. By Product Type
14.14.2.2. By Load Capacity
14.14.2.3. By End Use
14.15. Australia
14.15.1. Pricing Analysis
14.15.2. Market Share Analysis, 2021
14.15.2.1. By Product Type
14.15.2.2. By Load Capacity
14.15.2.3. By End Use
14.16. New Zealand
14.16.1. Pricing Analysis
14.16.2. Market Share Analysis, 2021
14.16.2.1. By Product Type
14.16.2.2. By Load Capacity
14.16.2.3. By End Use
14.17. GCC Countries
14.17.1. Pricing Analysis
14.17.2. Market Share Analysis, 2021
14.17.2.1. By Product Type
14.17.2.2. By Load Capacity
14.17.2.3. By End Use
14.18. South Africa
14.18.1. Pricing Analysis
14.18.2. Market Share Analysis, 2021
14.18.2.1. By Product Type
14.18.2.2. By Load Capacity
14.18.2.3. By End Use
14.19. Israel
14.19.1. Pricing Analysis
14.19.2. Market Share Analysis, 2021
14.19.2.1. By Product Type
14.19.2.2. By Load Capacity
14.19.2.3. By End Use
15. Market Structure Analysis
15.1. Competition Dashboard
15.2. Competition Benchmarking
15.3. Market Share Analysis of Top Players
15.3.1. By Regional
15.3.2. By Product Type
15.3.3. By Load Capacity
15.3.4. By End Use
16. Competition Analysis
16.1. Competition Deep Dive
16.1.1. Toyota Motor Corporation
16.1.1.1. Overview
16.1.1.2. Product Portfolio
16.1.1.3. Profitability by Market Segments
16.1.1.4. Sales Footprint
16.1.1.5. Strategy Overview
16.1.1.5.1. Marketing Strategy
16.1.1.5.2. Product Strategy
16.1.1.5.3. Channel Strategy
16.1.2. Jungheinrich AG
16.1.2.1. Overview
16.1.2.2. Product Portfolio
16.1.2.3. Profitability by Market Segments
16.1.2.4. Sales Footprint
16.1.2.5. Strategy Overview
16.1.2.5.1. Marketing Strategy
16.1.2.5.2. Product Strategy
16.1.2.5.3. Channel Strategy
16.1.3. Raymond Corporation
16.1.3.1. Overview
16.1.3.2. Product Portfolio
16.1.3.3. Profitability by Market Segments
16.1.3.4. Sales Footprint
16.1.3.5. Strategy Overview
16.1.3.5.1. Marketing Strategy
16.1.3.5.2. Product Strategy
16.1.3.5.3. Channel Strategy
16.1.4. Yale Materials Handling Corporation
16.1.4.1. Overview
16.1.4.2. Product Portfolio
16.1.4.3. Profitability by Market Segments
16.1.4.4. Sales Footprint
16.1.4.5. Strategy Overview
16.1.4.5.1. Marketing Strategy
16.1.4.5.2. Product Strategy
16.1.4.5.3. Channel Strategy
16.1.5. Caterpillar Inc.
16.1.5.1. Overview
16.1.5.2. Product Portfolio
16.1.5.3. Profitability by Market Segments
16.1.5.4. Sales Footprint
16.1.5.5. Strategy Overview
16.1.5.5.1. Marketing Strategy
16.1.5.5.2. Product Strategy
16.1.5.5.3. Channel Strategy
16.1.6. Clark Material Handling Company Inc.
16.1.6.1. Overview
16.1.6.2. Product Portfolio
16.1.6.3. Profitability by Market Segments
16.1.6.4. Sales Footprint
16.1.6.5. Strategy Overview
16.1.6.5.1. Marketing Strategy
16.1.6.5.2. Product Strategy
16.1.6.5.3. Channel Strategy
16.1.7. Crown Equipment Corporation
16.1.7.1. Overview
16.1.7.2. Product Portfolio
16.1.7.3. Profitability by Market Segments
16.1.7.4. Sales Footprint
16.1.7.5. Strategy Overview
16.1.7.5.1. Marketing Strategy
16.1.7.5.2. Product Strategy
16.1.7.5.3. Channel Strategy
16.1.8. Komatsu Ltd.
16.1.8.1. Overview
16.1.8.2. Product Portfolio
16.1.8.3. Profitability by Market Segments
16.1.8.4. Sales Footprint
16.1.8.5. Strategy Overview
16.1.8.5.1. Marketing Strategy
16.1.8.5.2. Product Strategy
16.1.8.5.3. Channel Strategy
16.1.9. UniCarriers Corp.
16.1.9.1. Overview
16.1.9.2. Product Portfolio
16.1.9.3. Profitability by Market Segments
16.1.9.4. Sales Footprint
16.1.9.5. Strategy Overview
16.1.9.5.1. Marketing Strategy
16.1.9.5.2. Product Strategy
16.1.9.5.3. Channel Strategy
16.1.10. Combilift Ltd.
16.1.10.1. Overview
16.1.10.2. Product Portfolio
16.1.10.3. Profitability by Market Segments
16.1.10.4. Sales Footprint
16.1.10.5. Strategy Overview
16.1.10.5.1. Marketing Strategy
16.1.10.5.2. Product Strategy
16.1.10.5.3. Channel Strategy
16.1.11. Godrej Material Handling
16.1.11.1. Overview
16.1.11.2. Product Portfolio
16.1.11.3. Profitability by Market Segments
16.1.11.4. Sales Footprint
16.1.11.5. Strategy Overview
16.1.11.5.1. Marketing Strategy
16.1.11.5.2. Product Strategy
16.1.11.5.3. Channel Strategy
16.1.12. Carborundum Universal Limited
16.1.12.1. Overview
16.1.12.2. Product Portfolio
16.1.12.3. Profitability by Market Segments
16.1.12.4. Sales Footprint
16.1.12.5. Strategy Overview
16.1.12.5.1. Marketing Strategy
16.1.12.5.2. Product Strategy
16.1.12.5.3. Channel Strategy
16.1.13. Jost's Engineering Company Limited
16.1.13.1. Overview
16.1.13.2. Product Portfolio
16.1.13.3. Profitability by Market Segments
16.1.13.4. Sales Footprint
16.1.13.5. Strategy Overview
16.1.13.5.1. Marketing Strategy
16.1.13.5.2. Product Strategy
16.1.13.5.3. Channel Strategy
16.1.14. Patel Material Handling Equipment
16.1.14.1. Overview
16.1.14.2. Product Portfolio
16.1.14.3. Profitability by Market Segments
16.1.14.4. Sales Footprint
16.1.14.5. Strategy Overview
16.1.14.5.1. Marketing Strategy
16.1.14.5.2. Product Strategy
16.1.14.5.3. Channel Strategy
16.1.15. Noveltek Industrial Manufacturing Inc.
16.1.15.1. Overview
16.1.15.2. Product Portfolio
16.1.15.3. Profitability by Market Segments
16.1.15.4. Sales Footprint
16.1.15.5. Strategy Overview
16.1.15.5.1. Marketing Strategy
16.1.15.5.2. Product Strategy
16.1.15.5.3. Channel Strategy
17. Assumptions & Acronyms Used
18. Research Methodology
Let us know your requirement to get
100% FREE customization
List of Tables
Table 01: Global Pallet Jacks Market Value (US$ Mn) Forecast by Region, 2017-2032
Table 02: Global Pallet Jacks Market Volume (Units) Forecast by Region, 2017-2032
Table 03: Global Pallet Jacks Market Value (US$ Mn) Forecast by Product Type, 2017-2032
Table 04: Global Pallet Jacks Market Volume (Units) Forecast by Product Type, 2017-2032
Table 05: Global Pallet Jacks Market Value (US$ Mn) Forecast by Load Capacity, 2017-2032
Table 06: Global Pallet Jacks Market Volume (Units) Forecast by Load Capacity, 2017-2032
Table 07: Global Pallet Jacks Market Value (US$ Mn) Forecast by End Use, 2017-2032
Table 08: Global Pallet Jacks Market Volume (Units) Forecast by End Use, 2017-2032
Table 09: North America Pallet Jacks Market Value (US$ Mn) Forecast by Country, 2017-2032
Table 10: North America Pallet Jacks Market Volume (Units) Forecast by Country, 2017-2032
Table 11: North America Pallet Jacks Market Value (US$ Mn) Forecast by Product Type, 2017-2032
Table 12: North America Pallet Jacks Market Volume (Units) Forecast by Product Type, 2017-2032
Table 13: North America Pallet Jacks Market Value (US$ Mn) Forecast by Load Capacity, 2017-2032
Table 14: North America Pallet Jacks Market Volume (Units) Forecast by Load Capacity, 2017-2032
Table 15: North America Pallet Jacks Market Value (US$ Mn) Forecast by End Use, 2017-2032
Table 16: North America Pallet Jacks Market Volume (Units) Forecast by End Use, 2017-2032
Table 17: Latin America Pallet Jacks Market Value (US$ Mn) Forecast by Country, 2017-2032
Table 18: Latin America Pallet Jacks Market Volume (Units) Forecast by Country, 2017-2032
Table 19: Latin America Pallet Jacks Market Value (US$ Mn) Forecast by Product Type, 2017-2032
Table 20: Latin America Pallet Jacks Market Volume (Units) Forecast by Product Type, 2017-2032
Table 21: Latin America Pallet Jacks Market Value (US$ Mn) Forecast by Load Capacity, 2017-2032
Table 22: Latin America Pallet Jacks Market Volume (Units) Forecast by Load Capacity, 2017-2032
Table 23: Latin America Pallet Jacks Market Value (US$ Mn) Forecast by End Use, 2017-2032
Table 24: Latin America Pallet Jacks Market Volume (Units) Forecast by End Use, 2017-2032
Table 25: Europe Pallet Jacks Market Value (US$ Mn) Forecast by Country, 2017-2032
Table 26: Europe Pallet Jacks Market Volume (Units) Forecast by Country, 2017-2032
Table 27: Europe Pallet Jacks Market Value (US$ Mn) Forecast by Product Type, 2017-2032
Table 28: Europe Pallet Jacks Market Volume (Units) Forecast by Product Type, 2017-2032
Table 29: Europe Pallet Jacks Market Value (US$ Mn) Forecast by Load Capacity, 2017-2032
Table 30: Europe Pallet Jacks Market Volume (Units) Forecast by Load Capacity, 2017-2032
Table 31: Europe Pallet Jacks Market Value (US$ Mn) Forecast by End Use, 2017-2032
Table 32: Europe Pallet Jacks Market Volume (Units) Forecast by End Use, 2017-2032
Table 33: Asia Pacific Pallet Jacks Market Value (US$ Mn) Forecast by Country, 2017-2032
Table 34: Asia Pacific Pallet Jacks Market Volume (Units) Forecast by Country, 2017-2032
Table 35: Asia Pacific Pallet Jacks Market Value (US$ Mn) Forecast by Product Type, 2017-2032
Table 36: Asia Pacific Pallet Jacks Market Volume (Units) Forecast by Product Type, 2017-2032
Table 37: Asia Pacific Pallet Jacks Market Value (US$ Mn) Forecast by Load Capacity, 2017-2032
Table 38: Asia Pacific Pallet Jacks Market Volume (Units) Forecast by Load Capacity, 2017-2032
Table 39: Asia Pacific Pallet Jacks Market Value (US$ Mn) Forecast by End Use, 2017-2032
Table 40: Asia Pacific Pallet Jacks Market Volume (Units) Forecast by End Use, 2017-2032
Table 41: MEA Pallet Jacks Market Value (US$ Mn) Forecast by Country, 2017-2032
Table 42: MEA Pallet Jacks Market Volume (Units) Forecast by Country, 2017-2032
Table 43: MEA Pallet Jacks Market Value (US$ Mn) Forecast by Product Type, 2017-2032
Table 44: MEA Pallet Jacks Market Volume (Units) Forecast by Product Type, 2017-2032
Table 45: MEA Pallet Jacks Market Value (US$ Mn) Forecast by Load Capacity, 2017-2032
Table 46: MEA Pallet Jacks Market Volume (Units) Forecast by Load Capacity, 2017-2032
Table 47: MEA Pallet Jacks Market Value (US$ Mn) Forecast by End Use, 2017-2032
Table 48: MEA Pallet Jacks Market Volume (Units) Forecast by End Use, 2017-2032
Find your sweet spots for generating winning opportunities in this market.
Talk to AnalystList of Charts
Figure 01: Global Pallet Jacks Market Value (US$ Mn) by Product Type, 2022-2032
Figure 02: Global Pallet Jacks Market Value (US$ Mn) by Load Capacity, 2022-2032
Figure 03: Global Pallet Jacks Market Value (US$ Mn) by End Use, 2022-2032
Figure 04: Global Pallet Jacks Market Value (US$ Mn) by Region, 2022-2032
Figure 05: Global Pallet Jacks Market Value (US$ Mn) Analysis by Region, 2017-2032
Figure 06: Global Pallet Jacks Market Volume (Units) Analysis by Region, 2017-2032
Figure 07: Global Pallet Jacks Market Value Share (%) and BPS Analysis by Region, 2022-2032
Figure 08: Global Pallet Jacks Market Y-o-Y Growth (%) Projections by Region, 2022-2032
Figure 09: Global Pallet Jacks Market Value (US$ Mn) Analysis by Product Type, 2017-2032
Figure 10: Global Pallet Jacks Market Volume (Units) Analysis by Product Type, 2017-2032
Figure 11: Global Pallet Jacks Market Value Share (%) and BPS Analysis by Product Type, 2022-2032
Figure 12: Global Pallet Jacks Market Y-o-Y Growth (%) Projections by Product Type, 2022-2032
Figure 13: Global Pallet Jacks Market Value (US$ Mn) Analysis by Load Capacity, 2017-2032
Figure 14: Global Pallet Jacks Market Volume (Units) Analysis by Load Capacity, 2017-2032
Figure 15: Global Pallet Jacks Market Value Share (%) and BPS Analysis by Load Capacity, 2022-2032
Figure 16: Global Pallet Jacks Market Y-o-Y Growth (%) Projections by Load Capacity, 2022-2032
Figure 17: Global Pallet Jacks Market Value (US$ Mn) Analysis by End Use, 2017-2032
Figure 18: Global Pallet Jacks Market Volume (Units) Analysis by End Use, 2017-2032
Figure 19: Global Pallet Jacks Market Value Share (%) and BPS Analysis by End Use, 2022-2032
Figure 20: Global Pallet Jacks Market Y-o-Y Growth (%) Projections by End Use, 2022-2032
Figure 21: Global Pallet Jacks Market Attractiveness by Product Type, 2022-2032
Figure 22: Global Pallet Jacks Market Attractiveness by Load Capacity, 2022-2032
Figure 23: Global Pallet Jacks Market Attractiveness by End Use, 2022-2032
Figure 24: Global Pallet Jacks Market Attractiveness by Region, 2022-2032
Figure 25: North America Pallet Jacks Market Value (US$ Mn) by Product Type, 2022-2032
Figure 26: North America Pallet Jacks Market Value (US$ Mn) by Load Capacity, 2022-2032
Figure 27: North America Pallet Jacks Market Value (US$ Mn) by End Use, 2022-2032
Figure 28: North America Pallet Jacks Market Value (US$ Mn) by Country, 2022-2032
Figure 29: North America Pallet Jacks Market Value (US$ Mn) Analysis by Country, 2017-2032
Figure 30: North America Pallet Jacks Market Volume (Units) Analysis by Country, 2017-2032
Figure 31: North America Pallet Jacks Market Value Share (%) and BPS Analysis by Country, 2022-2032
Figure 32: North America Pallet Jacks Market Y-o-Y Growth (%) Projections by Country, 2022-2032
Figure 33: North America Pallet Jacks Market Value (US$ Mn) Analysis by Product Type, 2017-2032
Figure 34: North America Pallet Jacks Market Volume (Units) Analysis by Product Type, 2017-2032
Figure 35: North America Pallet Jacks Market Value Share (%) and BPS Analysis by Product Type, 2022-2032
Figure 36: North America Pallet Jacks Market Y-o-Y Growth (%) Projections by Product Type, 2022-2032
Figure 37: North America Pallet Jacks Market Value (US$ Mn) Analysis by Load Capacity, 2017-2032
Figure 38: North America Pallet Jacks Market Volume (Units) Analysis by Load Capacity, 2017-2032
Figure 39: North America Pallet Jacks Market Value Share (%) and BPS Analysis by Load Capacity, 2022-2032
Figure 40: North America Pallet Jacks Market Y-o-Y Growth (%) Projections by Load Capacity, 2022-2032
Figure 41: North America Pallet Jacks Market Value (US$ Mn) Analysis by End Use, 2017-2032
Figure 42: North America Pallet Jacks Market Volume (Units) Analysis by End Use, 2017-2032
Figure 43: North America Pallet Jacks Market Value Share (%) and BPS Analysis by End Use, 2022-2032
Figure 44: North America Pallet Jacks Market Y-o-Y Growth (%) Projections by End Use, 2022-2032
Figure 45: North America Pallet Jacks Market Attractiveness by Product Type, 2022-2032
Figure 46: North America Pallet Jacks Market Attractiveness by Load Capacity, 2022-2032
Figure 47: North America Pallet Jacks Market Attractiveness by End Use, 2022-2032
Figure 48: North America Pallet Jacks Market Attractiveness by Country, 2022-2032
Figure 49: Latin America Pallet Jacks Market Value (US$ Mn) by Product Type, 2022-2032
Figure 50: Latin America Pallet Jacks Market Value (US$ Mn) by Load Capacity, 2022-2032
Figure 51: Latin America Pallet Jacks Market Value (US$ Mn) by End Use, 2022-2032
Figure 52: Latin America Pallet Jacks Market Value (US$ Mn) by Country, 2022-2032
Figure 53: Latin America Pallet Jacks Market Value (US$ Mn) Analysis by Country, 2017-2032
Figure 54: Latin America Pallet Jacks Market Volume (Units) Analysis by Country, 2017-2032
Figure 55: Latin America Pallet Jacks Market Value Share (%) and BPS Analysis by Country, 2022-2032
Figure 56: Latin America Pallet Jacks Market Y-o-Y Growth (%) Projections by Country, 2022-2032
Figure 57: Latin America Pallet Jacks Market Value (US$ Mn) Analysis by Product Type, 2017-2032
Figure 58: Latin America Pallet Jacks Market Volume (Units) Analysis by Product Type, 2017-2032
Figure 59: Latin America Pallet Jacks Market Value Share (%) and BPS Analysis by Product Type, 2022-2032
Figure 60: Latin America Pallet Jacks Market Y-o-Y Growth (%) Projections by Product Type, 2022-2032
Figure 61: Latin America Pallet Jacks Market Value (US$ Mn) Analysis by Load Capacity, 2017-2032
Figure 62: Latin America Pallet Jacks Market Volume (Units) Analysis by Load Capacity, 2017-2032
Figure 63: Latin America Pallet Jacks Market Value Share (%) and BPS Analysis by Load Capacity, 2022-2032
Figure 64: Latin America Pallet Jacks Market Y-o-Y Growth (%) Projections by Load Capacity, 2022-2032
Figure 65: Latin America Pallet Jacks Market Value (US$ Mn) Analysis by End Use, 2017-2032
Figure 66: Latin America Pallet Jacks Market Volume (Units) Analysis by End Use, 2017-2032
Figure 67: Latin America Pallet Jacks Market Value Share (%) and BPS Analysis by End Use, 2022-2032
Figure 68: Latin America Pallet Jacks Market Y-o-Y Growth (%) Projections by End Use, 2022-2032
Figure 69: Latin America Pallet Jacks Market Attractiveness by Product Type, 2022-2032
Figure 70: Latin America Pallet Jacks Market Attractiveness by Load Capacity, 2022-2032
Figure 71: Latin America Pallet Jacks Market Attractiveness by End Use, 2022-2032
Figure 72: Latin America Pallet Jacks Market Attractiveness by Country, 2022-2032
Figure 73: Europe Pallet Jacks Market Value (US$ Mn) by Product Type, 2022-2032
Figure 74: Europe Pallet Jacks Market Value (US$ Mn) by Load Capacity, 2022-2032
Figure 75: Europe Pallet Jacks Market Value (US$ Mn) by End Use, 2022-2032
Figure 76: Europe Pallet Jacks Market Value (US$ Mn) by Country, 2022-2032
Figure 77: Europe Pallet Jacks Market Value (US$ Mn) Analysis by Country, 2017-2032
Figure 78: Europe Pallet Jacks Market Volume (Units) Analysis by Country, 2017-2032
Figure 79: Europe Pallet Jacks Market Value Share (%) and BPS Analysis by Country, 2022-2032
Figure 80: Europe Pallet Jacks Market Y-o-Y Growth (%) Projections by Country, 2022-2032
Figure 81: Europe Pallet Jacks Market Value (US$ Mn) Analysis by Product Type, 2017-2032
Figure 82: Europe Pallet Jacks Market Volume (Units) Analysis by Product Type, 2017-2032
Figure 83: Europe Pallet Jacks Market Value Share (%) and BPS Analysis by Product Type, 2022-2032
Figure 84: Europe Pallet Jacks Market Y-o-Y Growth (%) Projections by Product Type, 2022-2032
Figure 85: Europe Pallet Jacks Market Value (US$ Mn) Analysis by Load Capacity, 2017-2032
Figure 86: Europe Pallet Jacks Market Volume (Units) Analysis by Load Capacity, 2017-2032
Figure 87: Europe Pallet Jacks Market Value Share (%) and BPS Analysis by Load Capacity, 2022-2032
Figure 88: Europe Pallet Jacks Market Y-o-Y Growth (%) Projections by Load Capacity, 2022-2032
Figure 89: Europe Pallet Jacks Market Value (US$ Mn) Analysis by End Use, 2017-2032
Figure 90: Europe Pallet Jacks Market Volume (Units) Analysis by End Use, 2017-2032
Figure 91: Europe Pallet Jacks Market Value Share (%) and BPS Analysis by End Use, 2022-2032
Figure 92: Europe Pallet Jacks Market Y-o-Y Growth (%) Projections by End Use, 2022-2032
Figure 93: Europe Pallet Jacks Market Attractiveness by Product Type, 2022-2032
Figure 94: Europe Pallet Jacks Market Attractiveness by Load Capacity, 2022-2032
Figure 95: Europe Pallet Jacks Market Attractiveness by End Use, 2022-2032
Figure 96: Europe Pallet Jacks Market Attractiveness by Country, 2022-2032
Figure 97: Asia Pacific Pallet Jacks Market Value (US$ Mn) by Product Type, 2022-2032
Figure 98: Asia Pacific Pallet Jacks Market Value (US$ Mn) by Load Capacity, 2022-2032
Figure 99: Asia Pacific Pallet Jacks Market Value (US$ Mn) by End Use, 2022-2032
Figure 100: Asia Pacific Pallet Jacks Market Value (US$ Mn) by Country, 2022-2032
Figure 101: Asia Pacific Pallet Jacks Market Value (US$ Mn) Analysis by Country, 2017-2032
Figure 102: Asia Pacific Pallet Jacks Market Volume (Units) Analysis by Country, 2017-2032
Figure 103: Asia Pacific Pallet Jacks Market Value Share (%) and BPS Analysis by Country, 2022-2032
Figure 104: Asia Pacific Pallet Jacks Market Y-o-Y Growth (%) Projections by Country, 2022-2032
Figure 105: Asia Pacific Pallet Jacks Market Value (US$ Mn) Analysis by Product Type, 2017-2032
Figure 106: Asia Pacific Pallet Jacks Market Volume (Units) Analysis by Product Type, 2017-2032
Figure 107: Asia Pacific Pallet Jacks Market Value Share (%) and BPS Analysis by Product Type, 2022-2032
Figure 108: Asia Pacific Pallet Jacks Market Y-o-Y Growth (%) Projections by Product Type, 2022-2032
Figure 109: Asia Pacific Pallet Jacks Market Value (US$ Mn) Analysis by Load Capacity, 2017-2032
Figure 110: Asia Pacific Pallet Jacks Market Volume (Units) Analysis by Load Capacity, 2017-2032
Figure 111: Asia Pacific Pallet Jacks Market Value Share (%) and BPS Analysis by Load Capacity, 2022-2032
Figure 112: Asia Pacific Pallet Jacks Market Y-o-Y Growth (%) Projections by Load Capacity, 2022-2032
Figure 113: Asia Pacific Pallet Jacks Market Value (US$ Mn) Analysis by End Use, 2017-2032
Figure 114: Asia Pacific Pallet Jacks Market Volume (Units) Analysis by End Use, 2017-2032
Figure 115: Asia Pacific Pallet Jacks Market Value Share (%) and BPS Analysis by End Use, 2022-2032
Figure 116: Asia Pacific Pallet Jacks Market Y-o-Y Growth (%) Projections by End Use, 2022-2032
Figure 117: Asia Pacific Pallet Jacks Market Attractiveness by Product Type, 2022-2032
Figure 118: Asia Pacific Pallet Jacks Market Attractiveness by Load Capacity, 2022-2032
Figure 119: Asia Pacific Pallet Jacks Market Attractiveness by End Use, 2022-2032
Figure 120: Asia Pacific Pallet Jacks Market Attractiveness by Country, 2022-2032
Figure 121: MEA Pallet Jacks Market Value (US$ Mn) by Product Type, 2022-2032
Figure 122: MEA Pallet Jacks Market Value (US$ Mn) by Load Capacity, 2022-2032
Figure 123: MEA Pallet Jacks Market Value (US$ Mn) by End Use, 2022-2032
Figure 124: MEA Pallet Jacks Market Value (US$ Mn) by Country, 2022-2032
Figure 125: MEA Pallet Jacks Market Value (US$ Mn) Analysis by Country, 2017-2032
Figure 126: MEA Pallet Jacks Market Volume (Units) Analysis by Country, 2017-2032
Figure 127: MEA Pallet Jacks Market Value Share (%) and BPS Analysis by Country, 2022-2032
Figure 128: MEA Pallet Jacks Market Y-o-Y Growth (%) Projections by Country, 2022-2032
Figure 129: MEA Pallet Jacks Market Value (US$ Mn) Analysis by Product Type, 2017-2032
Figure 130: MEA Pallet Jacks Market Volume (Units) Analysis by Product Type, 2017-2032
Figure 131: MEA Pallet Jacks Market Value Share (%) and BPS Analysis by Product Type, 2022-2032
Figure 132: MEA Pallet Jacks Market Y-o-Y Growth (%) Projections by Product Type, 2022-2032
Figure 133: MEA Pallet Jacks Market Value (US$ Mn) Analysis by Load Capacity, 2017-2032
Figure 134: MEA Pallet Jacks Market Volume (Units) Analysis by Load Capacity, 2017-2032
Figure 135: MEA Pallet Jacks Market Value Share (%) and BPS Analysis by Load Capacity, 2022-2032
Figure 136: MEA Pallet Jacks Market Y-o-Y Growth (%) Projections by Load Capacity, 2022-2032
Figure 137: MEA Pallet Jacks Market Value (US$ Mn) Analysis by End Use, 2017-2032
Figure 138: MEA Pallet Jacks Market Volume (Units) Analysis by End Use, 2017-2032
Figure 139: MEA Pallet Jacks Market Value Share (%) and BPS Analysis by End Use, 2022-2032
Figure 140: MEA Pallet Jacks Market Y-o-Y Growth (%) Projections by End Use, 2022-2032
Figure 141: MEA Pallet Jacks Market Attractiveness by Product Type, 2022-2032
Figure 142: MEA Pallet Jacks Market Attractiveness by Load Capacity, 2022-2032
Figure 143: MEA Pallet Jacks Market Attractiveness by End Use, 2022-2032
Figure 144: MEA Pallet Jacks Market Attractiveness by Country, 2022-2032
Need specific information?
Request CustomizationExplore Packaging Insights
View Reports