Electric Ships Market Size and Share Forecast Outlook 2025 to 2035

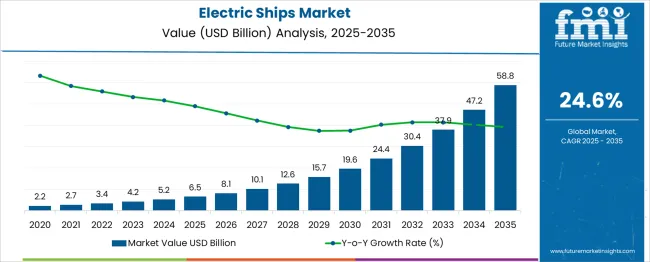
The Electric Ships Market is estimated to be valued at USD 6.5 billion in 2025 and is projected to reach USD 58.8 billion by 2035, registering a compound annual growth rate (CAGR) of 24.6% over the forecast period. Year-on-year (YoY) analysis of the provided data reveals a progressive acceleration in both absolute and percentage growth as adoption scales. Between 2025 and 2026, the market expands by USD 1.6 billion (24.6%), maintaining a similar growth rate into 2027 with an additional USD 2.0 billion. From 2028 onward, YoY gains exceed USD 3 billion annually, with a particularly sharp rise from USD 30.4 billion in 2032 to USD 37.9 billion in 2033 (+24.7%), reflecting an intensified uptake of hybrid and fully electric propulsion solutions. In absolute terms, early-stage growth (2025–2029) contributes USD 9.2 billion, or roughly 21% of the total market expansion, while later years (2030–2035) contribute USD 43.1 billion, equating to 73% of total gains. This skew toward the latter half underscores a back-loaded growth pattern typical of high-technology adoption curves, where early infrastructure, regulatory clarity, and fleet transition investments enable exponential scaling in later years. The YoY profile signals a compounding effect, driven by cost declines in battery systems, expanded vessel range capabilities, and increasing maritime decarbonization mandates, positioning the market for sustained momentum beyond 2035.
Quick Stats for Electric Ships Market

  • Electric Ships Market Value (2025): USD 6.5 billion
  • Electric Ships Market Forecast Value (2035): USD 58.8 billion
  • Electric Ships Market Forecast CAGR: 24.6%
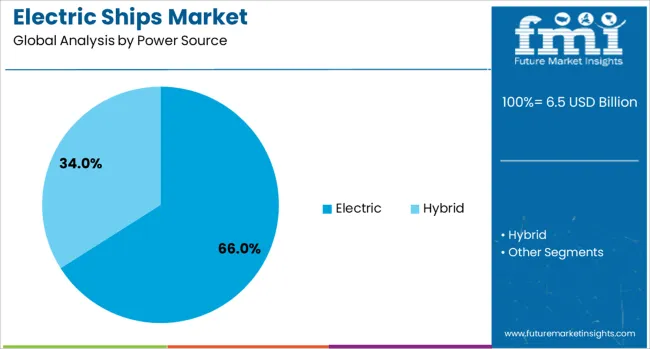
  • Leading Segment in Electric Ships Market in 2025: Electric (66.0%)
  • Key Growth Regions in Electric Ships Market: North America, Asia-Pacific, Europe
  • Top Key Players in Electric Ships Market: Hyundai Heavy Industries (HHI), China State Shipbuilding Corporation (CSSC), Fincantieri, Samsung Heavy Industries, Imabari Shipbuilding, BMT Group, Damen Shipyards Group

Electric Ships Market Market Value Analysis

Electric Ships Market Key Takeaways

Metric Value
Electric Ships Market Estimated Value in (2025 E) USD 6.5 billion
Electric Ships Market Forecast Value in (2035 F) USD 58.8 billion
Forecast CAGR (2025 to 2035) 24.6%

The electric ships market is expanding its footprint across multiple parent industries. It is estimated to represent about 2.5% of the maritime transportation market, reflecting early adoption stages. Within the shipbuilding industry, electric vessels account for approximately 4.2%, supported by rising orders for hybrid and zero-emission ships. In the marine propulsion systems market, electric and hybrid technologies now hold an estimated 11.8% share, largely driven by new-build and retrofit projects.

The marine segment of the electric and hybrid vehicle market contributes around 6.5%, while in renewable and clean energy technologies, electric ships hold a niche 1.4%, showing strong growth potential. Groundbreaking trends in the electric ships industry include the launch of large-capacity battery-powered ferries, such as the 129 m all-electric vessels by Incat Tasmania with 45 000 kWh battery packs. Key players like abb, siemens, and kongsberg are investing in advanced energy storage systems, hybrid propulsion integration, and hydrogen-based solutions. Strategic partnerships are forming between battery makers and shipbuilders to accelerate technology transfer. Adoption of modular electric propulsion units enables faster retrofits for cargo ships and ferries. Governments are introducing incentives for zero-emission vessels, pushing companies to innovate in marine fuel cells, ultra-fast charging systems, and ai-driven energy management for long-range electric shipping.

Why is the Electric Ships Market Growing?

The electric ships market is undergoing accelerated growth, driven by tightening maritime emission regulations, rising fuel costs, and the global push for sustainable transport solutions. Governments and regulatory bodies are incentivizing the shift toward cleaner marine propulsion through subsidies and compliance mandates, especially for inland and short-sea shipping routes.

Technological advancements in lithium-ion and solid-state batteries, as well as improvements in power electronics and propulsion efficiency, are enabling longer operational ranges and greater vessel performance. Shipbuilders and naval architects are also investing in electric ship prototypes that meet zero-emission targets without compromising payload or navigation efficiency.

The integration of renewable sources such as solar and hydrogen for auxiliary support is gaining traction, with hybrid-electric designs also acting as a transition step. As global ports enforce carbon offset targets and retrofit programs, the demand for electric vessels is expected to expand across cargo, passenger, and defense applications.

Segmental Analysis

The electric ships market is segmented by power source, system, operation, platform, and end-use and geographic regions. By power source of the electric ships market is divided into Electric and Hybrid. In terms of system of the electric ships market is classified into Power Generation, Energy Storage, Power Conversion, and Power Distribution. Based on operation of the electric ships market is segmented into Manned and Autonomous. By platform of the electric ships market is segmented into Commercial and Defense. By end-use of the electric ships market is segmented into Line Fit and Retro Fit. Regionally, the electric ships industry is classified into North America, Latin America, Western Europe, Eastern Europe, Balkan & Baltic Countries, Russia & Belarus, Central Asia, East Asia, South Asia & Pacific, and the Middle East & Africa.
Insights into the Electric Power Source Segment

Electric Ships Market Analysis By Power Source

Electric propulsion is projected to lead the market with a 66.00% share in 2025, making it the dominant power source in the electric ships segment. This leadership is driven by a combination of reduced operational costs, regulatory pressure on fossil fuels, and improving battery technologies.

Electric systems offer high energy efficiency, low noise emissions, and simplified mechanical design, all of which are advantageous for ferries, patrol boats, and inland cargo vessels. The segment is further supported by expanding charging infrastructure at ports and innovations in fast-charging and modular battery swapping solutions.

As range anxiety continues to decline due to energy density improvements, electric propulsion is expected to gain significant traction in both commercial and leisure marine sectors.
Insights into the Power Generation System Segment

Electric Ships Market Analysis By System

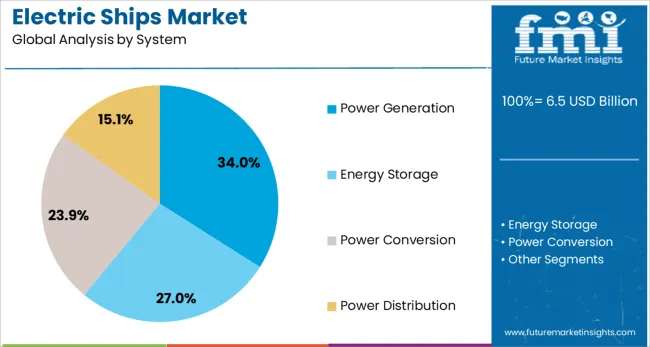
Power generation systems are expected to account for 34.00% of the market share by 2025, becoming the leading system category within electric ships. These systems include onboard energy conversion units such as fuel cells, solar arrays, and generators that complement battery-based storage.

The segment’s growth is supported by increasing interest in hybrid-electric configurations and the need for redundancy and reliability during long voyages. Advanced control systems allow dynamic energy balancing between renewable inputs and stored power, enhancing overall vessel autonomy.

With rising investments in offshore renewable projects and naval research programs, power generation modules are becoming integral to scalable and mission-flexible electric ship architectures.
Insights into the Manned Operation Segment

Electric Ships Market Analysis By Operation

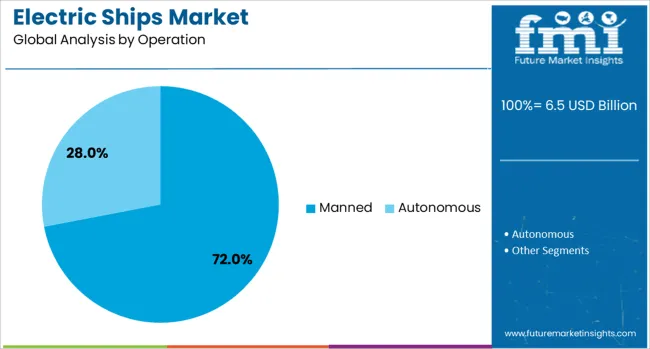
Manned operation is anticipated to dominate with a 72.00% share of the electric ships market in 2025. Despite advancements in autonomy, crewed vessels continue to lead adoption due to existing maritime regulations, navigational complexities, and human oversight requirements in commercial and defense applications.

Operators are integrating electric systems to improve crew comfort through reduced noise and vibration while lowering environmental impact. Retrofitting traditional manned vessels with electric drivetrains is also more feasible and cost-effective in the current regulatory environment.

While autonomous shipping remains a long-term goal, manned electric ships will remain central to mainstream maritime electrification in the near future.

What are the Drivers, Restraints, and Key Trends of the Electric Ships Market?

The shift toward electric propulsion in the maritime sector has been progressing in passenger ferries, cargo vessels, and inland waterway crafts. Battery-electric and hybrid-electric ships are being deployed for operational efficiency and compliance with maritime emission regulations. Europe and East Asia have demonstrated strong adoption, supported by port electrification programs and shipbuilding investments. Asia Pacific is showing notable fleet growth for coastal and riverine routes. Advances in marine battery technology, lightweight hull structures, and modular propulsion units are influencing vessel procurement and design strategies across multiple regions.

Fuel Efficiency and Low Operating Cost Advantage Stimulate Fleet Conversions

Rising marine fuel prices and stricter emission standards have been influencing shipowners to adopt electric propulsion for both retrofitted and newly built vessels. In regions such as Scandinavia, Japan, and China, fleet operators have reported substantial cost savings through reduced fuel usage and lower maintenance requirements following the introduction of electric ferries and hybrid cargo ships. Noise reduction and minimal vibration levels in electric systems have been considered beneficial for passenger comfort and cargo stability. Shore-to-ship charging capabilities have allowed port operations without auxiliary engine reliance, reducing wear on mechanical components. Vessel lifespans have been extended as a result, further lowering operational costs over time. Electric propulsion is viewed as a practical solution for meeting environmental regulations while achieving predictable long-term fuel savings, motivating its inclusion in competitive shipbuilding contracts and public procurement specifications.

Passenger and Cargo Segments Drive Demand for Range and Reliability Features

Ferry services, inland passenger routes, and short-sea cargo operations have been actively adopting electric propulsion where predictable timetables and frequent charging intervals are feasible. Shipyards in Germany, South Korea, and Norway have launched designs featuring advanced battery management systems, redundant propulsion units, and rapid charging solutions to enhance reliability. Electric ships have been preferred in environmentally sensitive zones such as tourism harbors and protected waterways due to reduced operational noise and absence of exhaust emissions. Hybrid-electric configurations combining battery propulsion with LNG or biofuel generators are increasingly favored for medium-distance maritime routes. Certification to stringent safety and performance benchmarks has been influencing purchasing decisions, especially in regions with demanding maritime operation standards. Fleet operators consider proven performance in heavy-load conditions, optimized energy consumption, and low lifecycle maintenance requirements as critical in selecting electric propulsion platforms for passenger and commercial shipping applications.

Technological Innovation Supports Compliance with Maritime Emission Directives

Global maritime emission reduction goals and regional vessel electrification policies have been encouraging investment in electric and hybrid propulsion technologies. Marine battery producers have been introducing higher energy density solutions with improved thermal management for deployment in research vessels, patrol ships, and offshore service crafts. Shipbuilders in the Netherlands and Japan have incorporated recyclable composite materials, waste heat recovery systems, and regenerative energy capture into vessel designs, achieving notable efficiency gains. Government-supported pilot programs for autonomous electric vessels have been accelerating proof-of-concept adoption and establishing best practices for integration. Manufacturers offering comprehensive solutions that combine propulsion hardware, intelligent energy software, and long-term service support have been gaining preference in both public and private sector projects. Technological progress in charging infrastructure, modular propulsion units, and predictive maintenance tools is expected to further drive confidence in electric ship investments over the next decade.

Battery Weight, Range Limitations, and Capital Costs Restrict Wider Adoption

The adoption of electric ships has been constrained by battery weight, range restrictions, and significant initial investment requirements. Marine-grade lithium-ion battery systems, while offering safety and stability, add substantial mass to the vessel, reducing cargo or passenger capacity. Operational range limitations require accurate route planning and reliable charging availability, which remains inconsistent across global ports. High capital costs, especially for large passenger vessels, can exceed those of conventional diesel ships, making profitability dependent on fuel price trends and regulatory incentives. The absence of widespread battery recycling infrastructure for marine applications has created uncertainty regarding end-of-life management. Overcoming these challenges will likely depend on advances in high-capacity lightweight battery technologies, expansion of shore charging facilities, and development of standardized charging systems. Without these improvements, electric ship deployment is expected to remain concentrated in short-range and government-supported maritime sectors.
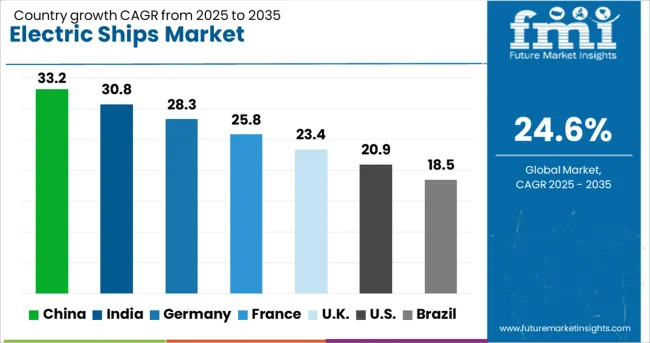
Analysis of Electric Ships Market By Key Countries

Electric Ships Market Cagr Analysis By Country

Country CAGR
China 33.2%
India 30.8%
Germany 28.3%
France 25.8%
UK 23.4%
USA 20.9%
Brazil 18.5%

The electric ships market is expected to grow at a global CAGR of 24.6% between 2025 and 2035, fueled by advancements in battery technology, emission reduction targets, and modernization of maritime transport. China leads with a 33.2% CAGR, driven by large-scale shipbuilding programs and rapid adoption of hybrid and fully electric vessels. India follows at 30.8%, supported by coastal shipping electrification and inland waterway projects. Germany, at 28.3%, benefits from strong R&D in marine propulsion and green maritime initiatives. The UK, projected at 23.4%, sees growth from passenger ferry electrification and harbor decarbonization. The USA, at 20.9%, reflects steady adoption in defense and commercial shipping. The report covers market insights for 40+ countries, with the five below standing out for their strategic role and growth potential.

Analysis of Electric Ships Market in China

China is projected to lead the market with an estimated CAGR of 33.2% from 2025 to 2035, driven by a rapid transition in maritime transportation systems. Government-backed shipbuilding programs have prioritized electric propulsion systems in both passenger and cargo vessels, positioning China as the largest manufacturing hub for hybrid and fully electric ships. Local players such as China State Shipbuilding Corporation and Guangzhou Shipyard International are increasing R&D investments to enhance battery density and vessel efficiency. Strategic collaborations with battery manufacturers have accelerated technology deployment in domestic ports and coastal shipping. Policies encouraging green port operations have further stimulated adoption, creating significant opportunities for market players targeting Asia Pacific exports and domestic routes that connect key economic corridors.

  • Over 65% of new coastal ferries launched in 2024 integrated electric propulsion.
  • Lithium-titanate battery systems adoption grew by 19% between 2023 and 2024.
  • Cargo ship retrofitting for electric drives rose by 14% in state-owned shipyards.

Growth Prospects of Electric Ships Market in India

India is expected to record a strong CAGR of 30.8% during 2025 to 2035 in the electric ships sector, supported by the government’s push for clean energy maritime solutions across inland waterways and short-sea shipping. The Inland Waterways Authority of India is spearheading initiatives to introduce fully electric ferries for passenger movement in key corridors such as the Ganga and Brahmaputra. Shipbuilders like Cochin Shipyard Limited are investing in high-capacity battery systems sourced from domestic and international suppliers. The presence of a growing electronics manufacturing ecosystem is enabling cost-effective sourcing of propulsion components. Pilot projects in Kerala and Assam have demonstrated operational viability, prompting private operators to consider scaling their fleets, particularly in tourism-centric water routes.
  • Passenger ferry electrification in Kerala increased by 22% in 2024.
  • Imports of marine-grade lithium-ion cells rose by 16% year on year.
  • Prototype testing of solar-assisted electric boats completed on two national waterways.

Technological Expansion of Electric Ships Market in Germany

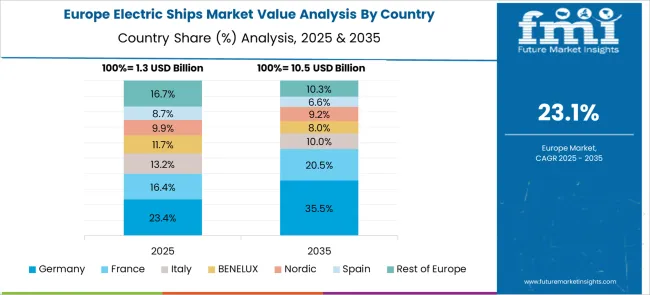
Electric Ships Market Europe Country Market Share Analysis, 2025 & 2035

Germany is forecasted to achieve a CAGR of 28.3% from 2025 to 2035, benefiting from advanced marine engineering capabilities and strong demand for sustainable coastal and river transport. German shipyards are integrating next-generation energy management systems to optimize battery usage and vessel range. Leading manufacturers like Siemens Energy Marine and Damen Shipyards’ German facilities are actively working on hybrid propulsion designs for both inland cargo barges and luxury river cruise ships. The country’s robust electrical engineering sector supports innovation in high-voltage marine charging stations, which is critical for operational efficiency. Federal programs are providing financial support to accelerate fleet upgrades, particularly in the Rhine and Elbe river systems, enhancing the market’s growth trajectory.

  • Hybrid cruise ship orders rose by 18% in 2024 within the Rhine route segment.
  • Ship-based energy storage capacity installations grew by 20 MWh compared to 2023.
  • Public funding covered up to 40% of electric propulsion retrofits for cargo barges.

Future Outlook for Electric Ships Market in the United Kingdom

The United Kingdom is anticipated to post a CAGR of 23.4% between 2025 and 2035 in the electric ships industry, driven by investments in coastal ferry electrification and port electrification programs. Maritime companies like Wight Shipyard Co and Artemis Technologies are pushing for advanced hydrofoil electric vessels to serve commuter and leisure travel segments. Government support through grants and clean marine funding is encouraging both newbuild and retrofit projects across Scotland, England, and Northern Ireland. The UK’s strategic location for cross-channel and island connectivity makes it a favorable environment for electric ship deployment, especially for short-haul passenger transport. With improved marine charging infrastructure, adoption rates are likely to accelerate over the forecast period.
  • Fully electric commuter ferry routes in Scotland increased by 15% in 2024.
  • Investment in hydrofoil electric vessel R&D rose by GBP 12 million in the past year.
  • Marine charging station installations grew by 26% in key coastal ports.

Electric Ships Market Growth Outlook in the United States

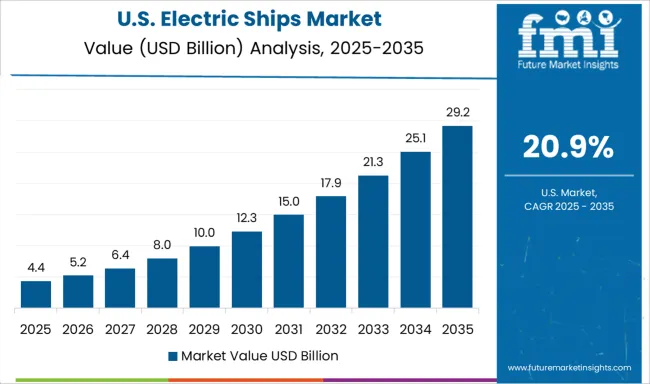
Electric Ships Market Country Value Analysis

The United States is projected to grow at a CAGR of 20.9% from 2025 to 2035 in the electric ships market, supported by both federal incentives and private sector investments in maritime decarbonization. American shipyards such as Vigor Industrial and Edison Chouest Offshore are incorporating battery-electric propulsion in workboats, ferries, and research vessels. Coastal states including Washington, California, and New York have initiated electrification programs for passenger ferries, supported by grants from the Department of Transportation’s Maritime Administration. The domestic battery manufacturing expansion, combined with partnerships between shipbuilders and technology firms, is expected to reduce costs and improve vessel range. Pilot projects on the Great Lakes are also setting operational benchmarks for cold-weather electric ship performance.
  • Funding of USD 150 million allocated to electric ferry projects in 2024.
  • Number of battery-electric workboats increased by 12% in USA ship registries.
  • Hybrid tugboat deployments expanded by 9% across major West Coast ports.

Competitive Landscape of Electric Ships Market

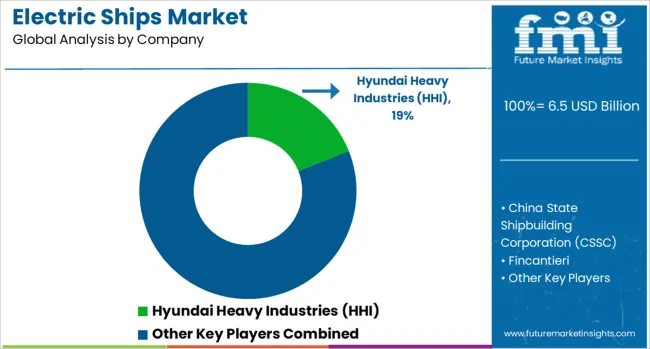
Electric Ships Market Analysis By Company

The electric ships market features prominent global shipbuilders and marine engineering companies expanding their presence through strategic projects, capacity upgrades, and targeted partnerships. Hyundai Heavy Industries (HHI) and Samsung Heavy Industries are leading South Korean players investing heavily in hybrid propulsion systems and large-scale electric vessel production, with

Key Developments in Electric Ships Market

China State Shipbuilding Corporation (CSSC) has emerged as a key force, leveraging government-backed programs to build battery-powered cargo ships and passenger vessels, alongside domestic R&D in high-capacity marine batteries. European companies such as Fincantieri and Damen Shipyards Group focus on the electrification of cruise ships, naval vessels, and commuter ferries, integrating advanced charging infrastructure and energy management systems. Japan’s Imabari Shipbuilding is advancing electric propulsion for coastal shipping fleets, supported by collaborations with battery manufacturers. BMT Group contributes as a design and consultancy leader, providing specialized naval architecture for electric and hybrid vessels across defense, commercial, and research sectors. These companies employ strategies including technology licensing, long-term supply contracts with marine battery makers, and joint ventures with port authorities to expand charging capabilities. Competitive advantage is often shaped by meeting strict emission standards, securing multi-year fleet electrification projects, and offering complete turnkey solutions from design to after-sales service. Entry into this market is restricted by high capital requirements, complex regulatory compliance, proven shipbuilding expertise, and the need for established supply networks for propulsion and battery systems.

Recent Development

  • In May 2025, Incat Tasmania launched Hull 096, the world’s largest fully electric ferry at 130 m, capable of carrying 2,100 passengers and 225 vehicles on a 40 MWh battery system with eight electric waterjets, built for Buquebus service between Argentina and Uruguay.
  • In May 2025, Artemis Technologies revealed the P‑12 electric hydrofoil ferry operating in Stockholm at 30 mph with 98% fewer emissions. Candela plans expansion to Lake Tahoe, Berlin, and Saudi Arabia’s Neom, signalling global scaling of high‑speed electric commuter ferries.

Scope of the Report

Item Value
Quantitative Units USD 6.5 Billion
Power Source Electric and Hybrid
System Power Generation, Energy Storage, Power Conversion, and Power Distribution
Operation Manned and Autonomous
Platform Commercial and Defense
End-use Line Fit and Retro Fit
Regions Covered North America, Europe, Asia-Pacific, Latin America, Middle East & Africa
Country Covered United States, Canada, Germany, France, United Kingdom, China, Japan, India, Brazil, South Africa
Key Companies Profiled Hyundai Heavy Industries (HHI), China State Shipbuilding Corporation (CSSC), Fincantieri, Samsung Heavy Industries, Imabari Shipbuilding, BMT Group, and Damen Shipyards Group

Electric Ships Market by Segments

Power Source:

  • Electric
  • Hybrid

System:

  • Power Generation
  • Energy Storage
  • Power Conversion
  • Power Distribution

Operation:

  • Manned
  • Autonomous

Platform:

  • Commercial
  • Defense

End-use:

  • Line Fit
  • Retro Fit

Region:

  • North America
    • USA
    • Canada
    • Mexico
  • Latin America
    • Brazil
    • Chile
    • Rest of Latin America
  • Western Europe
    • Germany
    • UK
    • Italy
    • Spain
    • France
    • Nordic
    • BENELUX
    • Rest of Western Europe
  • Eastern Europe
    • Russia
    • Poland
    • Hungary
    • Balkan & Baltic
    • Rest of Eastern Europe
  • East Asia
    • China
    • Japan
    • South Korea
  • South Asia and Pacific
    • India
    • ASEAN
    • Australia & New Zealand
    • Rest of South Asia and Pacific
  • Middle East & Africa
    • Kingdom of Saudi Arabia
    • Other GCC Countries
    • Turkiye
    • South Africa
    • Other African Union
    • Rest of Middle East & Africa

Table of Content

  1. Executive Summary
    • Global Market Outlook
    • Demand-side Trends
    • Supply-side Trends
    • Technology Roadmap Analysis
    • Analysis and Recommendations
  2. Market Overview
    • Market Coverage / Taxonomy
    • Market Definition / Scope / Limitations
  3. Market Background
    • Market Dynamics
      • Drivers
      • Restraints
      • Opportunity
      • Trends
    • Scenario Forecast
      • Demand in Optimistic Scenario
      • Demand in Likely Scenario
      • Demand in Conservative Scenario
    • Opportunity Map Analysis
    • Product Life Cycle Analysis
    • Supply Chain Analysis
    • Investment Feasibility Matrix
    • Value Chain Analysis
    • PESTLE and Porter’s Analysis
    • Regulatory Landscape
    • Regional Parent Market Outlook
    • Production and Consumption Statistics
    • Import and Export Statistics
  4. Global Electric Ships Market Analysis 2020-2024 and Forecast, 2025-2035
    • Historical Market Size Value (USD Mn) Analysis, 2020-2024
    • Current and Future Market Size Value (USD Mn) Projections, 2025-2035
      • Y-o-Y Growth Trend Analysis
      • Absolute $ Opportunity Analysis
  5. Global Electric Ships Market Pricing Analysis 2020-2024 and Forecast 2025-2035
  6. Global Electric Ships Market Analysis 2020-2024 and Forecast 2025-2035, By Power Source
    • Introduction / Key Findings
    • Historical Market Size Value (USD Mn) Analysis By Power Source , 2020-2024
    • Current and Future Market Size Value (USD Mn) Analysis and Forecast By Power Source , 2025-2035
      • Electric
      • Hybrid
    • Y-o-Y Growth Trend Analysis By Power Source , 2020-2024
    • Absolute $ Opportunity Analysis By Power Source , 2025-2035
  7. Global Electric Ships Market Analysis 2020-2024 and Forecast 2025-2035, By System
    • Introduction / Key Findings
    • Historical Market Size Value (USD Mn) Analysis By System, 2020-2024
    • Current and Future Market Size Value (USD Mn) Analysis and Forecast By System, 2025-2035
      • Power Generation
      • Energy Storage
      • Power Conversion
      • Power Distribution
    • Y-o-Y Growth Trend Analysis By System, 2020-2024
    • Absolute $ Opportunity Analysis By System, 2025-2035
  8. Global Electric Ships Market Analysis 2020-2024 and Forecast 2025-2035, By Operation
    • Introduction / Key Findings
    • Historical Market Size Value (USD Mn) Analysis By Operation, 2020-2024
    • Current and Future Market Size Value (USD Mn) Analysis and Forecast By Operation, 2025-2035
      • Manned
      • Autonomous
    • Y-o-Y Growth Trend Analysis By Operation, 2020-2024
    • Absolute $ Opportunity Analysis By Operation, 2025-2035
  9. Global Electric Ships Market Analysis 2020-2024 and Forecast 2025-2035, By Platform
    • Introduction / Key Findings
    • Historical Market Size Value (USD Mn) Analysis By Platform, 2020-2024
    • Current and Future Market Size Value (USD Mn) Analysis and Forecast By Platform, 2025-2035
      • Commercial
      • Defense
    • Y-o-Y Growth Trend Analysis By Platform, 2020-2024
    • Absolute $ Opportunity Analysis By Platform, 2025-2035
  10. Global Electric Ships Market Analysis 2020-2024 and Forecast 2025-2035, By End-use
    • Introduction / Key Findings
    • Historical Market Size Value (USD Mn) Analysis By End-use, 2020-2024
    • Current and Future Market Size Value (USD Mn) Analysis and Forecast By End-use, 2025-2035
      • Line Fit
      • Retro Fit
    • Y-o-Y Growth Trend Analysis By End-use, 2020-2024
    • Absolute $ Opportunity Analysis By End-use, 2025-2035
  11. Global Electric Ships Market Analysis 2020-2024 and Forecast 2025-2035, By Region
    • Introduction
    • Historical Market Size Value (USD Mn) Analysis By Region, 2020-2024
    • Current Market Size Value (USD Mn) Analysis and Forecast By Region, 2025-2035
      • North America
      • Latin America
      • Western Europe
      • Eastern Europe
      • East Asia
      • South Asia and Pacific
      • Middle East & Africa
    • Market Attractiveness Analysis By Region
  12. North America Electric Ships Market Analysis 2020-2024 and Forecast 2025-2035, By Country
    • Historical Market Size Value (USD Mn) Trend Analysis By Market Taxonomy, 2020-2024
    • Market Size Value (USD Mn) Forecast By Market Taxonomy, 2025-2035
      • By Country
        • USA
        • Canada
        • Mexico
      • By Power Source
      • By System
      • By Operation
      • By Platform
      • By End-use
    • Market Attractiveness Analysis
      • By Country
      • By Power Source
      • By System
      • By Operation
      • By Platform
      • By End-use
    • Key Takeaways
  13. Latin America Electric Ships Market Analysis 2020-2024 and Forecast 2025-2035, By Country
    • Historical Market Size Value (USD Mn) Trend Analysis By Market Taxonomy, 2020-2024
    • Market Size Value (USD Mn) Forecast By Market Taxonomy, 2025-2035
      • By Country
        • Brazil
        • Chile
        • Rest of Latin America
      • By Power Source
      • By System
      • By Operation
      • By Platform
      • By End-use
    • Market Attractiveness Analysis
      • By Country
      • By Power Source
      • By System
      • By Operation
      • By Platform
      • By End-use
    • Key Takeaways
  14. Western Europe Electric Ships Market Analysis 2020-2024 and Forecast 2025-2035, By Country
    • Historical Market Size Value (USD Mn) Trend Analysis By Market Taxonomy, 2020-2024
    • Market Size Value (USD Mn) Forecast By Market Taxonomy, 2025-2035
      • By Country
        • Germany
        • UK
        • Italy
        • Spain
        • France
        • Nordic
        • BENELUX
        • Rest of Western Europe
      • By Power Source
      • By System
      • By Operation
      • By Platform
      • By End-use
    • Market Attractiveness Analysis
      • By Country
      • By Power Source
      • By System
      • By Operation
      • By Platform
      • By End-use
    • Key Takeaways
  15. Eastern Europe Electric Ships Market Analysis 2020-2024 and Forecast 2025-2035, By Country
    • Historical Market Size Value (USD Mn) Trend Analysis By Market Taxonomy, 2020-2024
    • Market Size Value (USD Mn) Forecast By Market Taxonomy, 2025-2035
      • By Country
        • Russia
        • Poland
        • Hungary
        • Balkan & Baltic
        • Rest of Eastern Europe
      • By Power Source
      • By System
      • By Operation
      • By Platform
      • By End-use
    • Market Attractiveness Analysis
      • By Country
      • By Power Source
      • By System
      • By Operation
      • By Platform
      • By End-use
    • Key Takeaways
  16. East Asia Electric Ships Market Analysis 2020-2024 and Forecast 2025-2035, By Country
    • Historical Market Size Value (USD Mn) Trend Analysis By Market Taxonomy, 2020-2024
    • Market Size Value (USD Mn) Forecast By Market Taxonomy, 2025-2035
      • By Country
        • China
        • Japan
        • South Korea
      • By Power Source
      • By System
      • By Operation
      • By Platform
      • By End-use
    • Market Attractiveness Analysis
      • By Country
      • By Power Source
      • By System
      • By Operation
      • By Platform
      • By End-use
    • Key Takeaways
  17. South Asia and Pacific Electric Ships Market Analysis 2020-2024 and Forecast 2025-2035, By Country
    • Historical Market Size Value (USD Mn) Trend Analysis By Market Taxonomy, 2020-2024
    • Market Size Value (USD Mn) Forecast By Market Taxonomy, 2025-2035
      • By Country
        • India
        • ASEAN
        • Australia & New Zealand
        • Rest of South Asia and Pacific
      • By Power Source
      • By System
      • By Operation
      • By Platform
      • By End-use
    • Market Attractiveness Analysis
      • By Country
      • By Power Source
      • By System
      • By Operation
      • By Platform
      • By End-use
    • Key Takeaways
  18. Middle East & Africa Electric Ships Market Analysis 2020-2024 and Forecast 2025-2035, By Country
    • Historical Market Size Value (USD Mn) Trend Analysis By Market Taxonomy, 2020-2024
    • Market Size Value (USD Mn) Forecast By Market Taxonomy, 2025-2035
      • By Country
        • Kingdom of Saudi Arabia
        • Other GCC Countries
        • Turkiye
        • South Africa
        • Other African Union
        • Rest of Middle East & Africa
      • By Power Source
      • By System
      • By Operation
      • By Platform
      • By End-use
    • Market Attractiveness Analysis
      • By Country
      • By Power Source
      • By System
      • By Operation
      • By Platform
      • By End-use
    • Key Takeaways
  19. Key Countries Electric Ships Market Analysis
    • USA
      • Pricing Analysis
      • Market Share Analysis, 2024
        • By Power Source
        • By System
        • By Operation
        • By Platform
        • By End-use
    • Canada
      • Pricing Analysis
      • Market Share Analysis, 2024
        • By Power Source
        • By System
        • By Operation
        • By Platform
        • By End-use
    • Mexico
      • Pricing Analysis
      • Market Share Analysis, 2024
        • By Power Source
        • By System
        • By Operation
        • By Platform
        • By End-use
    • Brazil
      • Pricing Analysis
      • Market Share Analysis, 2024
        • By Power Source
        • By System
        • By Operation
        • By Platform
        • By End-use
    • Chile
      • Pricing Analysis
      • Market Share Analysis, 2024
        • By Power Source
        • By System
        • By Operation
        • By Platform
        • By End-use
    • Germany
      • Pricing Analysis
      • Market Share Analysis, 2024
        • By Power Source
        • By System
        • By Operation
        • By Platform
        • By End-use
    • UK
      • Pricing Analysis
      • Market Share Analysis, 2024
        • By Power Source
        • By System
        • By Operation
        • By Platform
        • By End-use
    • Italy
      • Pricing Analysis
      • Market Share Analysis, 2024
        • By Power Source
        • By System
        • By Operation
        • By Platform
        • By End-use
    • Spain
      • Pricing Analysis
      • Market Share Analysis, 2024
        • By Power Source
        • By System
        • By Operation
        • By Platform
        • By End-use
    • France
      • Pricing Analysis
      • Market Share Analysis, 2024
        • By Power Source
        • By System
        • By Operation
        • By Platform
        • By End-use
    • India
      • Pricing Analysis
      • Market Share Analysis, 2024
        • By Power Source
        • By System
        • By Operation
        • By Platform
        • By End-use
    • ASEAN
      • Pricing Analysis
      • Market Share Analysis, 2024
        • By Power Source
        • By System
        • By Operation
        • By Platform
        • By End-use
    • Australia & New Zealand
      • Pricing Analysis
      • Market Share Analysis, 2024
        • By Power Source
        • By System
        • By Operation
        • By Platform
        • By End-use
    • China
      • Pricing Analysis
      • Market Share Analysis, 2024
        • By Power Source
        • By System
        • By Operation
        • By Platform
        • By End-use
    • Japan
      • Pricing Analysis
      • Market Share Analysis, 2024
        • By Power Source
        • By System
        • By Operation
        • By Platform
        • By End-use
    • South Korea
      • Pricing Analysis
      • Market Share Analysis, 2024
        • By Power Source
        • By System
        • By Operation
        • By Platform
        • By End-use
    • Russia
      • Pricing Analysis
      • Market Share Analysis, 2024
        • By Power Source
        • By System
        • By Operation
        • By Platform
        • By End-use
    • Poland
      • Pricing Analysis
      • Market Share Analysis, 2024
        • By Power Source
        • By System
        • By Operation
        • By Platform
        • By End-use
    • Hungary
      • Pricing Analysis
      • Market Share Analysis, 2024
        • By Power Source
        • By System
        • By Operation
        • By Platform
        • By End-use
    • Kingdom of Saudi Arabia
      • Pricing Analysis
      • Market Share Analysis, 2024
        • By Power Source
        • By System
        • By Operation
        • By Platform
        • By End-use
    • Turkiye
      • Pricing Analysis
      • Market Share Analysis, 2024
        • By Power Source
        • By System
        • By Operation
        • By Platform
        • By End-use
    • South Africa
      • Pricing Analysis
      • Market Share Analysis, 2024
        • By Power Source
        • By System
        • By Operation
        • By Platform
        • By End-use
  20. Market Structure Analysis
    • Competition Dashboard
    • Competition Benchmarking
    • Market Share Analysis of Top Players
      • By Regional
      • By Power Source
      • By System
      • By Operation
      • By Platform
      • By End-use
  21. Competition Analysis
    • Competition Deep Dive
      • Hyundai Heavy Industries (HHI)
        • Overview
        • Product Portfolio
        • Profitability by Market Segments (Product/Age /Sales Channel/Region)
        • Sales Footprint
        • Strategy Overview
          • Marketing Strategy
          • Product Strategy
          • Channel Strategy
      • China State Shipbuilding Corporation (CSSC)
      • Fincantieri
      • Samsung Heavy Industries
      • Imabari Shipbuilding
      • BMT Group
      • Damen Shipyards Group
  22. Assumptions & Acronyms Used
  23. Research Methodology

List of Tables

  • Table 1: Global Electric Ships Market Value (USD Mn) Forecast by Region, 2020-2035
  • Table 2: Global Electric Ships Market Value (USD Mn) Forecast by Power Source , 2020-2035
  • Table 3: Global Electric Ships Market Value (USD Mn) Forecast by System, 2020-2035
  • Table 4: Global Electric Ships Market Value (USD Mn) Forecast by Operation, 2020-2035
  • Table 5: Global Electric Ships Market Value (USD Mn) Forecast by Platform, 2020-2035
  • Table 6: Global Electric Ships Market Value (USD Mn) Forecast by End-use, 2020-2035
  • Table 7: North America Electric Ships Market Value (USD Mn) Forecast by Country, 2020-2035
  • Table 8: North America Electric Ships Market Value (USD Mn) Forecast by Power Source , 2020-2035
  • Table 9: North America Electric Ships Market Value (USD Mn) Forecast by System, 2020-2035
  • Table 10: North America Electric Ships Market Value (USD Mn) Forecast by Operation, 2020-2035
  • Table 11: North America Electric Ships Market Value (USD Mn) Forecast by Platform, 2020-2035
  • Table 12: North America Electric Ships Market Value (USD Mn) Forecast by End-use, 2020-2035
  • Table 13: Latin America Electric Ships Market Value (USD Mn) Forecast by Country, 2020-2035
  • Table 14: Latin America Electric Ships Market Value (USD Mn) Forecast by Power Source , 2020-2035
  • Table 15: Latin America Electric Ships Market Value (USD Mn) Forecast by System, 2020-2035
  • Table 16: Latin America Electric Ships Market Value (USD Mn) Forecast by Operation, 2020-2035
  • Table 17: Latin America Electric Ships Market Value (USD Mn) Forecast by Platform, 2020-2035
  • Table 18: Latin America Electric Ships Market Value (USD Mn) Forecast by End-use, 2020-2035
  • Table 19: Western Europe Electric Ships Market Value (USD Mn) Forecast by Country, 2020-2035
  • Table 20: Western Europe Electric Ships Market Value (USD Mn) Forecast by Power Source , 2020-2035
  • Table 21: Western Europe Electric Ships Market Value (USD Mn) Forecast by System, 2020-2035
  • Table 22: Western Europe Electric Ships Market Value (USD Mn) Forecast by Operation, 2020-2035
  • Table 23: Western Europe Electric Ships Market Value (USD Mn) Forecast by Platform, 2020-2035
  • Table 24: Western Europe Electric Ships Market Value (USD Mn) Forecast by End-use, 2020-2035
  • Table 25: Eastern Europe Electric Ships Market Value (USD Mn) Forecast by Country, 2020-2035
  • Table 26: Eastern Europe Electric Ships Market Value (USD Mn) Forecast by Power Source , 2020-2035
  • Table 27: Eastern Europe Electric Ships Market Value (USD Mn) Forecast by System, 2020-2035
  • Table 28: Eastern Europe Electric Ships Market Value (USD Mn) Forecast by Operation, 2020-2035
  • Table 29: Eastern Europe Electric Ships Market Value (USD Mn) Forecast by Platform, 2020-2035
  • Table 30: Eastern Europe Electric Ships Market Value (USD Mn) Forecast by End-use, 2020-2035
  • Table 31: East Asia Electric Ships Market Value (USD Mn) Forecast by Country, 2020-2035
  • Table 32: East Asia Electric Ships Market Value (USD Mn) Forecast by Power Source , 2020-2035
  • Table 33: East Asia Electric Ships Market Value (USD Mn) Forecast by System, 2020-2035
  • Table 34: East Asia Electric Ships Market Value (USD Mn) Forecast by Operation, 2020-2035
  • Table 35: East Asia Electric Ships Market Value (USD Mn) Forecast by Platform, 2020-2035
  • Table 36: East Asia Electric Ships Market Value (USD Mn) Forecast by End-use, 2020-2035
  • Table 37: South Asia and Pacific Electric Ships Market Value (USD Mn) Forecast by Country, 2020-2035
  • Table 38: South Asia and Pacific Electric Ships Market Value (USD Mn) Forecast by Power Source , 2020-2035
  • Table 39: South Asia and Pacific Electric Ships Market Value (USD Mn) Forecast by System, 2020-2035
  • Table 40: South Asia and Pacific Electric Ships Market Value (USD Mn) Forecast by Operation, 2020-2035
  • Table 41: South Asia and Pacific Electric Ships Market Value (USD Mn) Forecast by Platform, 2020-2035
  • Table 42: South Asia and Pacific Electric Ships Market Value (USD Mn) Forecast by End-use, 2020-2035
  • Table 43: Middle East & Africa Electric Ships Market Value (USD Mn) Forecast by Country, 2020-2035
  • Table 44: Middle East & Africa Electric Ships Market Value (USD Mn) Forecast by Power Source , 2020-2035
  • Table 45: Middle East & Africa Electric Ships Market Value (USD Mn) Forecast by System, 2020-2035
  • Table 46: Middle East & Africa Electric Ships Market Value (USD Mn) Forecast by Operation, 2020-2035
  • Table 47: Middle East & Africa Electric Ships Market Value (USD Mn) Forecast by Platform, 2020-2035
  • Table 48: Middle East & Africa Electric Ships Market Value (USD Mn) Forecast by End-use, 2020-2035

List of Figures

  • Figure 1: Global Electric Ships Market Pricing Analysis
  • Figure 2: Global Electric Ships Market Value (USD Mn) Forecast 2020–2035
  • Figure 3: Global Electric Ships Market Value (USD Mn) Share and BPS Analysis by Region, 2025 and 2035
  • Figure 4: Global Electric Ships Market Y-o-Y Growth Comparison by Region, 2025–2035
  • Figure 5: Global Electric Ships Market Attractiveness Analysis by Region
  • Figure 6: North America Electric Ships Market Incremental Dollar Opportunity, 2025–2035
  • Figure 7: Latin America Electric Ships Market Incremental Dollar Opportunity, 2025–2035
  • Figure 8: Western Europe Electric Ships Market Incremental Dollar Opportunity, 2025–2035
  • Figure 9: Eastern Europe Electric Ships Market Incremental Dollar Opportunity, 2025–2035
  • Figure 10: East Asia Electric Ships Market Incremental Dollar Opportunity, 2025–2035
  • Figure 11: South Asia and Pacific Electric Ships Market Incremental Dollar Opportunity, 2025–2035
  • Figure 12: Middle East & Africa Electric Ships Market Incremental Dollar Opportunity, 2025–2035
  • Figure 13: North America Electric Ships Market Value Share and BPS Analysis by Country, 2025 and 2035
  • Figure 14: Latin America Electric Ships Market Value Share and BPS Analysis by Country, 2025 and 2035
  • Figure 15: Western Europe Electric Ships Market Value Share and BPS Analysis by Country, 2025 and 2035
  • Figure 16: Eastern Europe Electric Ships Market Value Share and BPS Analysis by Country, 2025 and 2035
  • Figure 17: East Asia Electric Ships Market Value Share and BPS Analysis by Country, 2025 and 2035
  • Figure 18: South Asia and Pacific Electric Ships Market Value Share and BPS Analysis by Country, 2025 and 2035
  • Figure 19: Middle East & Africa Electric Ships Market Value Share and BPS Analysis by Country, 2025 and 2035
  • Figure 20: Global Electric Ships Market – Tier Structure Analysis
  • Figure 21: Global Electric Ships Market – Company Share Analysis

Frequently Asked Questions

How big is the electric ships market in 2025?

The global electric ships market is estimated to be valued at USD 6.5 billion in 2025.

What will be the size of electric ships market in 2035?

The market size for the electric ships market is projected to reach USD 58.8 billion by 2035.

How much will be the electric ships market growth between 2025 and 2035?

The electric ships market is expected to grow at a 24.6% CAGR between 2025 and 2035.

What are the key product types in the electric ships market?

The key product types in electric ships market are electric and hybrid.

Which system segment to contribute significant share in the electric ships market in 2025?

In terms of system, power generation segment to command 34.0% share in the electric ships market in 2025.

Explore Similar Insights

Future Market Insights

Electric Ships Market