The global truck mounted cranes market is valued at USD 2,751.1 million in 2025 and is slated to reach USD 4,231.7 million by 2035, recording an absolute increase of USD 1,492.5 million over the forecast period. This translates into a total growth of 54.2%, with the market forecast to expand at a CAGR of 4.4% between 2025 and 2035. As per Future Market Insights, a globally recognized ESOMAR Corporate Member, the market size is expected to grow by nearly 1.5X during the same period, supported by increasing infrastructure development projects, rising construction activities, and growing demand for versatile lifting solutions across diverse industrial and commercial applications.
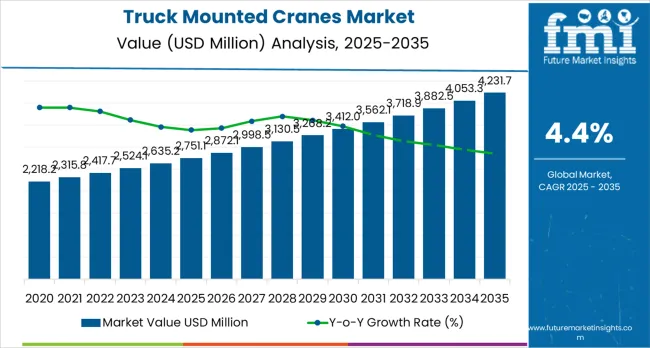
Between 2025 and 2030, the truck mounted cranes market is projected to expand from USD 2,751.1 million to USD 3,457.8 million, resulting in a value increase of USD 706.7 million, which represents 47.4% of the total forecast growth for the decade. This phase of development will be shaped by increasing infrastructure modernization programs, rising construction sector investments, and growing demand for efficient lifting equipment in industrial and commercial applications. Equipment manufacturers are expanding their production capabilities to address the growing demand for hydraulic systems and enhanced operational reliability.
| Metric | Value |
|---|---|
| Estimated Value in (2025E) | USD 2,751.1 million |
| Forecast Value in (2035F) | USD 4,231.7 million |
| Forecast CAGR (2025 to 2035) | 4.4% |
The construction equipment market is the largest contributor, accounting for 30-35% of the demand. Truck-mounted cranes are crucial for lifting heavy materials, providing mobility, and offering flexibility across both small- and large-scale construction projects. The industrial equipment market contributes about 20-25%, as truck-mounted cranes are integral to industries such as manufacturing, heavy machinery handling, and logistics, where they are essential for loading, unloading, and transporting equipment within industrial facilities. The transportation and logistics market also plays a significant role, contributing 18-22% by utilizing truck-mounted cranes for efficient loading and unloading of goods, especially in areas where stationary cranes are impractical.
The mining market contributes around 10-12% to the truck mounted cranes market, where they are used for material handling and equipment relocation on mining sites, ensuring high mobility and lifting capacity. The oil and gas industry also accounts for about 8-10%, with truck-mounted cranes being employed for site setup, equipment relocation, and maintenance tasks in both onshore and offshore operations. Together, these parent markets drive the demand for truck-mounted cranes, ensuring their essential role across industries requiring efficient, flexible, and mobile lifting and transportation solutions.
Market expansion is being supported by the increasing global infrastructure development and the corresponding need for efficient lifting equipment that can maintain operational reliability and performance standards while supporting diverse construction and industrial applications across various project environments. Modern construction companies and logistics operators are increasingly focused on implementing crane solutions that can reduce setup time, minimize operational complexity, and provide consistent performance in demanding lifting operations. Truck mounted cranes'proven ability to deliver enhanced operational efficiency, reliable lifting capabilities, and versatile application usage make them essential equipment for contemporary construction operations and material handling solutions.
The growing emphasis on operational efficiency and project productivity is driving demand for truck mounted cranes that can support large-scale construction projects, reduce operational costs, and enable efficient material handling across varying project requirements. Construction users'preference for equipment that combines mobility with precision control and cost-effectiveness is creating opportunities for innovative crane implementations. The rising influence of automation technologies and smart control systems is also contributing to increased adoption of truck mounted cranes that can provide advanced operational control without compromising performance or safety standards.
The truck mounted cranes market is poised for robust growth and transformation. As construction companies and industrial operations across both developed and emerging markets seek lifting equipment that is efficient, reliable, versatile, and technologically advanced, truck mounted crane systems are gaining prominence not just as mechanical equipment but as strategic infrastructure for operational efficiency, project productivity, material handling optimization, and competitive advantage.
Rising construction activities and infrastructure development in North America, Europe, and Asia Pacific amplify demand, while manufacturers are picking up on innovations in hydraulic technologies and smart control systems.
Pathways like hydraulic system optimization, smart technology integration, and electric/hybrid solutions promise strong margin uplift, especially in developed markets. Geographic expansion and application diversification will capture volume, particularly where construction and industrial infrastructure require modernization. Industry pressures around operational efficiency, safety enhancement, emission reduction, and automation advancement give structural support.
The market is segmented by product type, drive system, lifting capacity, end use, and region. By product type, the market is divided into stiff boom cranes and knuckle boom cranes. By drive system, it covers electrical, mechanical, and hydraulic systems. By lifting capacity, it includes below 15 ton, 15 to 30 ton, 30 to 50 ton, and above 50 ton. By end use, it is segmented into industrial, commercial, infrastructure, and others. Regionally, the market is divided into North America, Latin America, Western Europe, Eastern Europe, East Asia, South Asia Pacific, and Middle East &Africa.
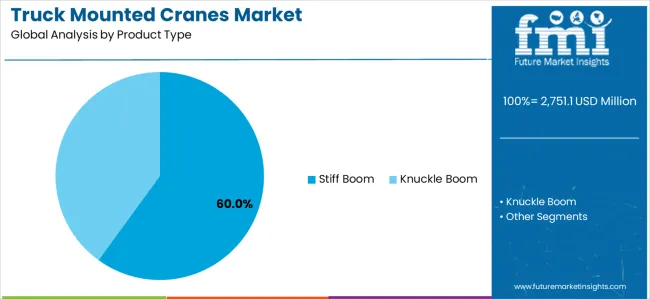
The stiff boom cranes segment is projected to account for 60% of the truck mounted cranes market in 2025, reaffirming its position as the leading product category. Construction companies and industrial operators increasingly utilize stiff boom cranes for their proven reliability, established durability, and superior performance in heavy-duty lifting operations across construction, mining, and manufacturing applications. Stiff boom crane technology's established operational procedures and robust design directly address the industrial requirements for reliable material handling and operational efficiency in demanding work environments.
This product segment forms the foundation of current construction and industrial operations, as it represents the technology with the greatest lifting capacity and established maintenance infrastructure across multiple applications and lifting scenarios. Operator investments in enhanced stiff boom systems and performance optimization continue to strengthen adoption among construction contractors and industrial facilities. With operators prioritizing operational reliability and lifting capacity, stiff boom cranes align with both performance objectives and cost management requirements, making them the central component of comprehensive lifting strategies.
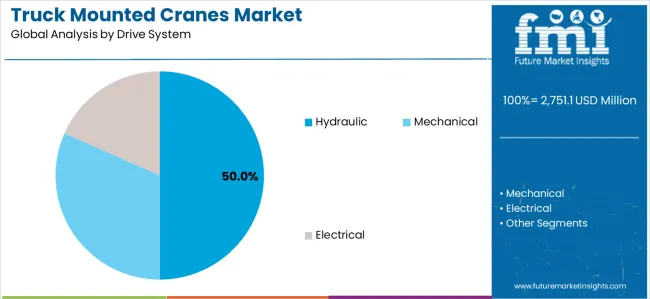
Hydraulic drive systems are projected to account for 50% of truck mounted crane demand in 2025, underscoring their critical role as the primary drive technology for construction and industrial lifting operations. Construction operators prefer hydraulic systems for their efficiency, reliability, and ability to handle demanding lifting requirements while supporting precision control and operational flexibility. Positioned as versatile technology for modern crane applications, hydraulic systems offer both operational advantages and performance benefits.
The segment is supported by continuous innovation in hydraulic technology expansion and the growing availability of specialized system configurations that enable efficient operation with enhanced power delivery capabilities. Construction companies are investing in hydraulic system optimization to support large-scale operations and lifting efficiency delivery. As construction automation becomes more prevalent and operational efficiency requirements increase, hydraulic drive systems will continue to dominate the drive technology market while supporting advanced crane utilization and operational strategies.
The truck mounted cranes market is advancing steadily due to increasing infrastructure development projects and growing adoption of advanced lifting technologies that provide enhanced operational efficiency and performance reliability across diverse construction and industrial applications. The market faces challenges, including high initial investment costs for advanced systems, specialized operator training requirements, and varying regulatory standards across different operational environments. Innovation in hydraulic technologies and smart control systems continues to influence crane development and market expansion patterns.
The growing expansion of infrastructure projects and construction development is enabling crane manufacturers to develop truck mounted crane systems that provide superior lifting efficiency, enhanced operational capabilities, and reliable performance in demanding construction environments. Advanced truck mounted crane systems provide improved operational capacity while allowing more effective material handling and consistent performance delivery across various applications and project requirements. Manufacturers are increasingly recognizing the competitive advantages of modern crane capabilities for operational efficiency and construction productivity positioning.
Modern truck mounted crane manufacturers are incorporating advanced hydraulic systems and smart control technologies to enhance operational precision, reduce setup time, and ensure consistent performance delivery to construction and industrial operators. These technologies improve operational flexibility while enabling new applications, including remote operation and automated load management solutions. Advanced technology integration also allows manufacturers to support premium crane positioning and performance optimization beyond traditional mechanical crane supply.
| Country | CAGR (2025-2035) |
|---|---|
| USA | 4.2% |
| Germany | 4.0% |
| Japan | 4.6% |
| United Kingdom | 4.8% |
| China | 5.2% |
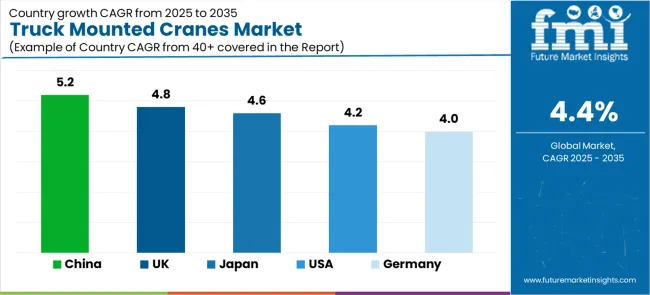
The truck mounted cranes market is experiencing steady growth globally, with China leading at a 5.2% CAGR through 2035, driven by large-scale infrastructure projects, urbanization, and industrial development, further boosted by the country’s continuous adoption of advanced crane technologies. The United Kingdom follows at 4.8%, driven by infrastructure modernization programs, construction sector recovery, and significant adoption of advanced lifting technologies supported by government investment initiatives and operational efficiency requirements. Japan shows growth at 4.6%, supported by urban redevelopment projects, disaster resilience infrastructure, and growing adoption of automated crane technologies. The USA records a 4.2% CAGR, emphasizing infrastructure modernization and construction sector expansion. Germany demonstrates 4.0% growth, supported by construction technology advancement and industrial modernization.
The report covers an in-depth analysis of 40+ countries, with top-performing countries are highlighted below.
Revenue from truck mounted cranes in the USA is projected to exhibit growth with a CAGR of 4.2% through 2035, driven by extensive infrastructure modernization programs and construction sector expansion supported by government investment initiatives and operational efficiency requirements. The country's comprehensive infrastructure strategy and increasing investment in construction technologies are creating substantial demand for advanced crane solutions. Major construction companies and contractors are establishing extensive equipment fleets to address the growing demand for efficient lifting systems and project productivity.
Revenue from truck mounted cranes in the United Kingdom is expanding at a CAGR of 4.8%, supported by the country's infrastructure investment programs, construction sector recovery, and increasing adoption of advanced lifting technologies. The nation's comprehensive construction modernization and emphasis on operational efficiency are driving sophisticated crane capabilities. Construction companies and infrastructure developers are establishing extensive equipment operations to address the growing demand for efficient material handling and project completion.
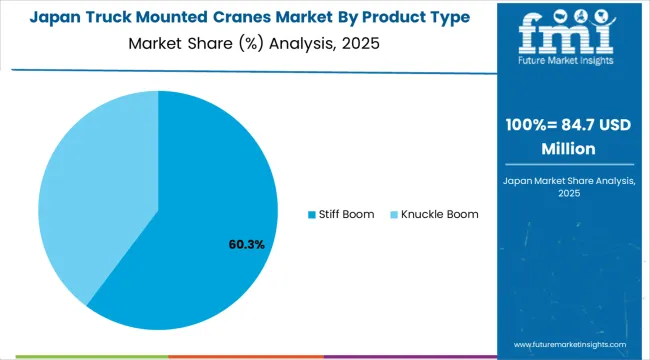
Revenue from truck mounted cranes in Japan is expanding at a CAGR of 4.6%, supported by the country's urban redevelopment programs, disaster resilience infrastructure development, and strategic investment in construction modernization. Japan's established construction sector and emphasis on technological advancement are driving demand for high-performance crane technologies across major construction markets. Construction companies and infrastructure operators are establishing equipment partnerships to serve both domestic development needs and technological innovation requirements.
Revenue from truck mounted cranes in Germany is expanding at a CAGR of 4.0%, supported by the country's construction technology leadership, comprehensive industrial development programs, and strategic investment in operational efficiency improvement. Germany's established construction industry and emphasis on technology integration are driving demand for specialized crane technologies focusing on operational precision and performance optimization. Construction operators are investing in comprehensive equipment modernization to serve both domestic construction requirements and technology development initiatives.
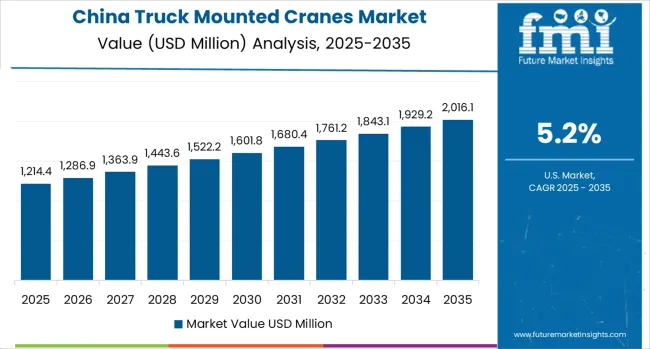
Revenue from truck-mounted cranes in China is expanding at a robust CAGR of 5.2%, driven by the country’s massive infrastructure expansion, urbanization initiatives, and rapid industrial growth. As one of the largest construction and infrastructure markets globally, China’s demand for advanced lifting technologies is supported by large-scale infrastructure projects such as high-speed rail networks, urban redevelopment, and energy infrastructure. The construction and manufacturing sectors in China are increasingly adopting modern crane technologies to enhance operational efficiency, safety, and productivity.
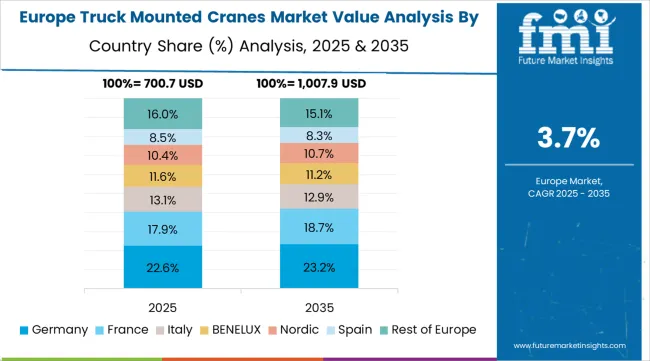
The truck mounted cranes market in Europe is projected to grow from USD 824.1 million in 2025 to USD 1,246.8 million by 2035, registering a CAGR of 4.2% over the forecast period. Germany is expected to maintain its leadership position with a 28.7% market share in 2025, increasing to 29.3% by 2035, supported by its advanced construction technology capabilities, comprehensive industrial infrastructure, and major infrastructure projects serving European and international markets.
United Kingdom follows with a 24.1% share in 2025, projected to reach 24.8% by 2035, driven by infrastructure investment programs, construction sector recovery, and established technology capabilities, supported by government modernization initiatives. France holds a 16.8% share in 2025, expected to reach 17.1% by 2035, supported by construction modernization and infrastructure development initiatives. Italy commands a 13.2% share in 2025, projected to reach 13.4% by 2035, while Spain accounts for 9.7% in 2025, expected to reach 9.8% by 2035. The Rest of Europe region, including Nordic countries, Eastern European markets, Netherlands, Belgium, and other European countries, is anticipated to maintain momentum, with its collective share stable from 7.5% to 5.6% by 2035, attributed to steady construction development across Nordic countries and consistent infrastructure modernization across various European markets implementing development upgrade programs.
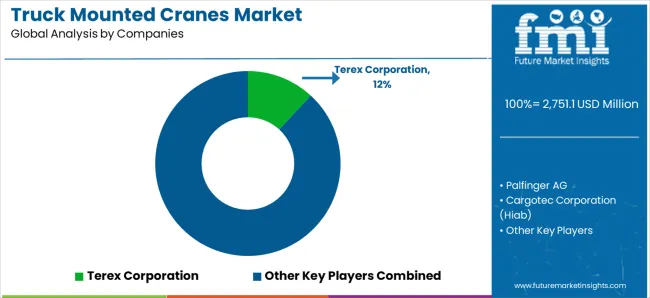
The truck mounted cranes market is characterized by competition among established construction equipment manufacturers, specialized crane technology providers, and integrated lifting solution companies. Companies are investing in advanced hydraulic system research, smart control technology development, performance optimization, and comprehensive crane portfolios to deliver efficient, reliable, and technologically advanced truck mounted crane solutions. Innovation in hydraulic systems, automated control technologies, and IoT integration capabilities is central to strengthening market position and competitive advantage.
Terex Corporation leads the market with a strong presence, offering comprehensive crane portfolios and advanced lifting systems with a focus on reliability and innovation for construction applications. Palfinger AG provides specialized truck mounted cranes with an emphasis on hydraulic technology, operational efficiency, and global market coverage. Cargotec Corporation (Hiab) delivers advanced crane technologies and integrated systems with a focus on commercial and industrial applications. XCMG Group specializes in heavy-duty crane solutions with emphasis on construction and infrastructure applications. Liebherr Group focuses on high-performance cranes with advanced engineering and comprehensive support capabilities. Manitex International offers diverse crane solutions with specialized applications and operational optimization.
| Items | Values |
|---|---|
| Quantitative Units (2025) | USD 2,751.1 million |
| Product Type | Stiff Boom, Knuckle Boom |
| Drive System | Electrical, Mechanical, Hydraulic |
| Lifting Capacity | Below 15 Ton, 15 to 30 Ton, 30 to 50 Ton, Above 50 Ton |
| End Use | Industrial, Commercial, Infrastructure, Others |
| Regions Covered | North America, Latin America, Western Europe, Eastern Europe, East Asia, South Asia Pacific, Middle East &Africa |
| Countries Covered | United States, Canada, Germany, United Kingdom, France, China, Japan, Brazil, India and 40+ countries |
| Key Companies Profiled | Terex Corporation, Palfinger AG, Cargotec Corporation (Hiab), XCMG Group, Liebherr Group, and Manitex International |
| Additional Attributes | Crane sales by product type and drive system, regional demand trends, competitive landscape, technological advancements in hydraulic systems, smart control development, automation innovation, and operational efficiency optimization |
The global truck mounted cranes market is estimated to be valued at USD 2,751.1 million in 2025.
The market size for the truck mounted cranes market is projected to reach USD 4,231.7 million by 2035.
The truck mounted cranes market is expected to grow at a 4.4% CAGR between 2025 and 2035.
The key product types in truck mounted cranes market are stiff boom and knuckle boom.
In terms of drive system, hydraulic segment to command 50.0% share in the truck mounted cranes market in 2025.


Full Research Suite comprises of:
Market outlook & trends analysis
Interviews & case studies
Strategic recommendations
Vendor profiles & capabilities analysis
5-year forecasts
8 regions and 60+ country-level data splits
Market segment data splits
12 months of continuous data updates
DELIVERED AS:
PDF EXCEL ONLINE
Truck Mounted Knuckle Boom Cranes Market – Growth & Demand 2025 to 2035
Trucks Market Size and Share Forecast Outlook 2025 to 2035
Truck Loader Crane Market Size and Share Forecast Outlook 2025 to 2035
Truck Market Analysis - Size, Share, and Forecast Outlook 2025 to 2035
Truck Racks Market Size and Share Forecast Outlook 2025 to 2035
Truck Bedliners Market Outlook- Trends & Forecast 2025 to 2035
Truck Platooning Market
Truck Mounted Concrete Mixer Market
Semi-Truck Market Size and Share Forecast Outlook 2025 to 2035
Hand Trucks And Dollies Market Size and Share Forecast Outlook 2025 to 2035
Food Truck Market Analysis - Size, Share, and Forecast Outlook 2025 to 2035
Dump Trucks Market Size and Share Forecast Outlook 2025 to 2035
Fire Truck Market Growth - Trends & Forecast 2025 to 2035
Heavy-Truck Composite Component Market Size and Share Forecast Outlook 2025 to 2035
Crane Trucks Market Size and Share Forecast Outlook 2025 to 2035
Mining Trucks Market Size and Share Forecast Outlook 2025 to 2035
Tanker Truck Market Size and Share Forecast Outlook 2025 to 2035
Bucket Trucks Market Analysis - Size, Share, and Forecast Outlook 2025 to 2035
Vacuum Truck Market Size and Share Forecast Outlook 2025 to 2035
Pallet Truck Market Growth - Trends & Forecast 2025 to 2035

Thank you!
You will receive an email from our Business Development Manager. Please be sure to check your SPAM/JUNK folder too.
Chat With
MaRIA