Reports

- Global Locations -

Headquarters

Future Market Insights, Inc.

Christiana Corporate, 200
Continental Drive, Suite 401,
Newark, Delaware - 19713,
United States

T: +1-845-579-5705

Americas

Future Market Insights, Inc.

616 Corporate Way, Suite 2-9018,
Valley Cottage, NY 10989, United States

T: +1-347-918-3531

MEA

Future Market Insights

1602-6 Jumeirah Bay X2 Tower, Plot No: JLT-PH2-X2A,
Jumeirah Lakes Towers, Dubai,
United Arab Emirates

Europe

Future Market Insights

3rd Floor, 207 Regent Street,
W1B 3HH London
United Kingdom

T: + 44 (0) 20 8123 9659
D: +44 (0) 20 3287 4268

Asia Pacific

Future Market Insights

IndiaLand Global Tech Park, Unit UG-1, Behind Grand HighStreet, Phase 1, Hinjawadi, MH, Pune – 411057, India

Truck Bedliners Market Snapshot (2022 to 2032)

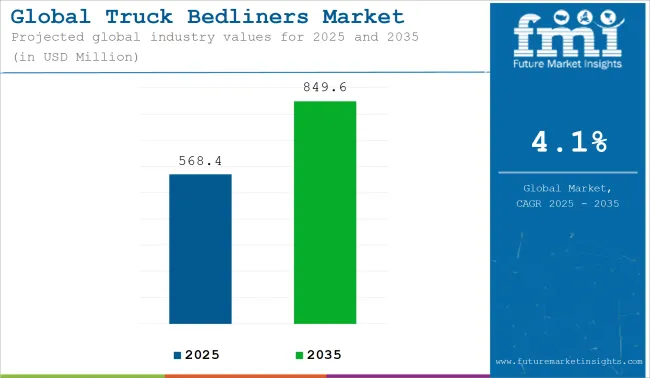
The global truck bedliners market is likely to secure a market value of US$ 500.80 Million in 2022 and is expected to accumulate a market value of US$ 777.73 Million by registering a CAGR of 4.5% in the forecast period from 2022 to 2032. The growth of the truck bedliner market can be attributed to increases in the transportation and logistics industry across the globe. The market for truck bedliner registered a CAGR of 3.5% in the historical period 2016 to 2021

The safety of bulk cargo is paramount for personal and commercial use. Thus, protection regulations have led manufacturers to incorporate safety devices and components into their vehicles. The development of the automotive industry across the globe is creating lucrative opportunities for truck bedliners. Thus, the Truck Bedliners market has witnessed several developments throughout the years and expects multiple variations in the near future.

Truck bedliners protect the interior of a truck bed and provide a nonslip surface. The demand for truck covers is increasing in the automotive industry due to the surge in the production of medium and heavy-duty trucks. In particular, Asia Pacific, North America, and Europe remain important target markets for truck bed suppliers.

Furthermore, rising disposable income and increasing urban population drive the global truck bedliners market. Also, the increasing concerns about comfort and safety, rising demand for luxury, and adoption of advanced technologies in the automotive industry are fueling market growth.

Report Attribute Details
Expected Market Value (2022) US$ 500.80 Million
Anticipated Forecast Value (2032) US$ 777.73 Million
Projected Growth Rate (2022 to 2032) 4.5% CAGR

Don't pay for what you don't need

Customize your report by selecting specific countries or regions and save 30%!

2017 to 2021 Truck Bedliner Market Demand Analysis vs. Forecast 2022 to 2032

According to market research and competitive intelligence provider Future Market Insights- the market for truck bedliner reflected a value CAGR of 3.5% during the historical period, 2017 to 2021.

Although the COVID-19 pandemic affected the demand for truck bedliners in the initial quarter, the urgent requirement for the transportation of medical equipment positively impacted the demand for truck bedliners. As most end-user industries are functioning smoothly post-pandemic, the demand for truck bedliner is expected to increase in the forecast period. Thus, the market for truck bedliner is expected to register a CAGR of 4.5% in the forecast period 2022 to 2032.

Which are Some Prominent Drivers of Truck Bedliner Market?

Multi-purpose application of truck bedliners spurring the growth of the market

Truck Bedliners provide protection to the inside of a truck bed from damage while also providing an antiskid layer to keep the cargo in place. The increasing application of these products in other applications apart from coating truck beds is expected to spur sales throughout the forecast period.

Spray-on Bedliners are long-lasting and reliable, and thus they can be utilized to protect additional sections of the fender or rear bumper. These bedliners are an attractive alternative for truck enthusiasts because of their customizable design and implementation capabilities, which have contributed to their rising use.

Prevention of exterior coating increasing adoption of Truck Bedliners

The exterior coating is designed to provide improved protection and prevent damage while driving through extreme weather conditions. The increasing demand for exterior coating has encouraged market players to provide these services.

The drop-in bedliner has been witnessing advancements as manufacturers are focusing on improving product quality by providing several variants in an attempt to increase their market share. Apart from this, the increasing pickup truck sales and the rising usage of polyurea in spray-on bedliners are expected to propel the growth of the market. These changing market dynamics are anticipated to spur sales in the coming years.

Nikhil Kaitwade
Nikhil Kaitwade

Principal Consultant

Talk to Analyst

Find your sweet spots for generating winning opportunities in this market.

What are the Challenges Faced by the Truck Bedliner Market?

Lack of Knowledge affecting the application and usage of truck bedliners

Although the nature of the truck bedliner is user-friendly, the do-it-yourself (DIY) method does not serve the purpose always. Lack of knowledge of using spray-on can damage the same and immediate investment is required.

Moreover, depending on the nature of the product, truck bedliners peel off or get damaged in shorter periods. All these factors are hampering the growth of the truck bedliner market.

Region-Wise Insights

Increasing Sales of Utility Vehicles Propelling Growth of Truck Bedliners Market in North America?

Truck Accessories easing Transportation Process in North America

In North America, automobile sales are dominated by utility vehicles such as pickup trucks, crossovers, and sport-utility vehicles (SUVs). This is due to the increased versatility of these vehicles, which allows them to be used for both personal and commercial purposes.

Owing to the growing demand for these trucks, truck accessories are becoming more prominent. As a result, the market for truck bedliners in the region will expand in tandem with the growth of pick-up truck sales.

In addition, the growth of the transport and logistics market is another factor increasing the sales of vehicles. This, in turn, is increasing the demand for truck bedliners. Thus, North America is expected to possess a 40% market share of the truck bedliners market.

Increase in Transportation Activities Creating Lucrative Opportunities for Truck Bedliners in Europe?

Trade of Essential Commodities leading to growth in demand for Truck Bedliners in Europe

The increased requirements of safety equipment like PPE kits and medicines have led to a rise in the usage of trucks for the delivery of important cargo. In addition, as the situation has improved in many European countries, the trade of essential commodities has increased providing an impetus for the growth of the truck bedliners market in the region.

Many countries in Europe were severely impacted by the COVID-19 crisis, which has led to declining in economic activities. The onset of COVID-19 led to disruptions in supply chain operations, the shutting down of manufacturing facilities, and huge economic losses caused by lockdowns. However, post-pandemic, the situation of the market has improved as manufacturers of automotive vehicles are investing more in designing the carrier space effectively. Thus, Europe is expected to possess a 35% market share of the truck bedliners market in 2022.

Get the data you need at a Fraction of the cost

Personalize your report by choosing insights you need
and save 40%!

Country-Wise Insights

USA and Canada’s Industrial Base Favoring Growth of Truck Bedliners Market?

Presence of End User Industries shaping the landscape for the truck bedliner market

Major countries in North America, such as the USA and Canada, have a huge industrial base and favorable government policies to boost innovation, and they highly adopt industrial automation solutions. The USA is a prominent market for cybersecurity solutions in several industries.

The country consists of the maximum number of truck bedliners platform developers. Hence, any negative impact on the region's economy or industry growth hinders the businesses of companies operating in the region. In Q1 2020, due to the COVID-19 pandemic, the slump in industrial/manufacturing activities and new projects across the USA, Canada, and Mexico negatively impacted the growth of the truck bedliners market in respective countries.

Mexico is the seventh-largest passenger vehicle manufacturer and the fifth-largest auto parts producer worldwide. Expansion of the regional aftermarket is anticipated to boost the truck bedliners market growth in the region. Thus, the USA is expected to register a CAGR of 4% for truck bedliners in the forecast period 2022 to 2032.

Development of Automobile Industry in Germany Influencing Truck Bedliners Market Growth?

Heat dissipation capability enhancing the growth of truck bedliners in Germany

Germany is expected to be a significant region in the bedliners market during the forecast period, owing to the rapidly rising automobile production and sales across the region. Manufacturing companies in this region focus on developing better bedliners by reducing bedliner size and enhancing heat dissipation capability.

Due to the increasing demand for trucks, the requirement for truck accessories is rising. As a result, the bed truck market in the region will grow together with the growth in pickup truck sales. Thus, Germany is expected to register a 4.5% CAGR for truck bedliners in the assessment period 2022 to 2032.

Category-Wise Insights

Easy Installation of Drop-in Truck Bedliners Making Them Popular?

Inexpensive nature bolstering demand for drop-in truck bedliners

Drop-in bedliners are the most prevalent and commonly found forms. Drop-ins can generally be mounted quickly without any major modifications to the truck's bed other than drilling a few holes in specific points to keep it in place.

These bedliners are less expensive than their counterparts and also allow ease of operation as they can be easily removed for the purpose of cleaning or otherwise. The main factor driving the sales of these products is their rigid structure and ease of installation. Thus, drop-in bedliners are expected to possess a 45% market share for truck bedliners in 2022.

Appealing finish attracting consumers to invest in Spray-Our Bedliners

Spray-on Bedliners consist of various types. Their application varies based on the selection of formulation or the type of coating. The aromatic coating is typically applied to dark colors like black. On the other hand, Aliphatic coating offers a variety of colors including a metallic finish.

Customers prefer these bedliners as they can be applied in a way that matches their vehicle’s color thereby delivering an appealing finish. Regardless of the formulation and type, these spray-on bedliners provide protection to the inside of the truck bed from harsh weather conditions while at the same time providing an aesthetic look to the vehicle. Thus, spray-on bedliners are usually preferred by truck enthusiasts. Thus, spray-out bedliners are expected to possess a 35% market share for truck bedliners in 2022.

Market Competition

Many leading manufacturers and suppliers are focusing on expanding their business through collaborations and acquisitions. Manufacturers are investing in product development in order to bolster demand and improve sales. Key players in the truck bedliners market are Aeroklas, Rhino Linings, Toff Liner, Panda Corporation, LINE-X, Homestead Products, Ultimate Linings, Industrial Polymers, Scorpion, Rugged Liner, and Dual Liner

  • Toff Liner, a key player in the truck bedliner market is focusing on developing bedliners that easily resist staining from harsh chemicals. Through this, the company is planning to offer weather-friendly truck bedliners.
  • Aeroklas, another key player in the truck bedliner market is focusing on manufacturing truck bedliners that prevent rust, corrosion, and leaks. Moreover, the absorption impact of the truck bedliner makes them durable and long-lasting.

Report Scope

Report Attribute Details
Market Value in 2022 US$ 500.80 Million
Market Value in 2032 US$ 777.73 Million
Growth Rate CAGR of 4.5% from 2022 to 2032
Base Year for Estimation 2021
Historical Data 2017 to 2021
Forecast Period 2022 to 2032
Quantitative Units Revenue in USD Million and CAGR from 2022 to 2032
Report Coverage Revenue Forecast, Volume Forecast, Company Ranking, Competitive Landscape, Growth Factors, Trends, and Pricing Analysis
Segments Covered
  • Product Type
  • Application
  • Region
Regions Covered
  • North America
  • Latin America
  • Europe
  • South Asia
  • East Asia
  • Oceania
  • Middle East and Africa
Key Countries Profiled
  • USA
  • Canada
  • Brazil
  • Mexico
  • Germany
  • United Kingdom
  • France
  • Spain
  • Italy
  • India
  • Malaysia
  • Singapore
  • Thailand
  • China
  • Japan
  • South Korea
  • Australia
  • New Zealand
  • GCC Countries
  • South Africa
  • Israel
Key Companies Profiled
  • Aeroklas
  • Rhino Linings
  • Toff Liner
  • Panda Corporation
  • LINE-X
  • Homestead Products
  • Ultimate Linings
  • Industrial Polymers LLC
  • Rugged Liner
  • DualLiner
Customization Available Upon Request

Key Segments Profiled in the Truck Bedliner Industry Survey

By Product:

  • Drop-in Bedliners
  • Spray-out Bedliners

By Material:

  • Polyurethanes
  • Aluminium Carpet
  • Other

By Region:

  • North America
  • Latin America
  • Europe
  • South Asia:
  • East Asia
  • Oceania
  • Middle East & Africa

Frequently Asked Questions

At what rate did the truck bedliner market flourish from 2017 to 2021?

From 2017 to 2021, the truck bedliner market grew at a CAGR of 3.5%

What will be the growth rate of the global truck bedliner market during the forecast period?

The global truck bedliner market is expected to grow with a 4.5% CAGR from 2022 to 2032

What will be the projected market size of the truck bedliner market by 2032?

As of 2032, the truck bedliner market is expected to reach US$ 777.73 Million

Which product segment is expected to dominate the global truck bedliner market during 2022?

Drop-in bedliners are expected to possess a 45% market share for truck bedliners in 2022.

How much market share are spray-out bedliners expected to possess in 2022?

Spray-out bedliners are expected to possess a 35% market share for truck bedliners in 2022.

How is the North America ruck bedliner market projected to grow in 2022?

North America is expected to possess a 40% market share for the truck bedliners market.

How is the Europe truck bedliner market projected to grow in 2022?

Europe is expected to possess a 35% market share for the truck bedliners market in 2022.

Table of Content

1. Executive Summary | Truck Bedliners Market

    1.1. Global Market Outlook

    1.2. Demand-side Trends

    1.3. Supply-side Trends

    1.4. Technology Roadmap Analysis

    1.5. Analysis and Recommendations

2. Market Overview

    2.1. Market Coverage / Taxonomy

    2.2. Market Definition / Scope / Limitations

3. Market Background

    3.1. Market Dynamics

        3.1.1. Drivers

        3.1.2. Restraints

        3.1.3. Opportunity 

        3.1.4. Trends

    3.2. Scenario Forecast

        3.2.1. Demand in Optimistic Scenario

        3.2.2. Demand in Likely Scenario

        3.2.3. Demand in Conservative Scenario

    3.3. Opportunity Map Analysis

    3.4. Investment Feasibility Matrix

    3.5. PESTLE and Porter’s Analysis

    3.6. Regulatory Landscape

        3.6.1. By Key Regions

        3.6.2. By Key Countries

    3.7. Regional Parent Market Outlook

4. Global Market Analysis 2017 to 2021 and Forecast, 2022 to 2032

    4.1. Historical Market Size Value (US$ Million) Analysis, 2017 to 2021

    4.2. Current and Future Market Size Value (US$ Million) Projections, 2022 to 2032

        4.2.1. Y-o-Y Growth Trend Analysis

        4.2.2. Absolute $ Opportunity Analysis

5. Global Market Analysis 2017 to 2021 and Forecast 2022 to 2032, By Type

    5.1. Introduction / Key Findings

    5.2. Historical Market Size Value (US$ Million) Analysis By Type, 2017 to 2021

    5.3. Current and Future Market Size Value (US$ Million) Analysis and Forecast By Type, 2022 to 2032

        5.3.1. Drop-in Bedliners

        5.3.2. Spray-on Bedliners

    5.4. Y-o-Y Growth Trend Analysis By Type, 2017 to 2021

    5.5. Absolute $ Opportunity Analysis By Type, 2022 to 2032

6. Global Market Analysis 2017 to 2021 and Forecast 2022 to 2032, By Material

    6.1. Introduction / Key Findings

    6.2. Historical Market Size Value (US$ Million) Analysis By Material, 2017 to 2021

    6.3. Current and Future Market Size Value (US$ Million) Analysis and Forecast By Material, 2022 to 2032

        6.3.1. Polyurethanes

        6.3.2. Aluminium Carpet

        6.3.3. Other

    6.4. Y-o-Y Growth Trend Analysis By Material, 2017 to 2021

    6.5. Absolute $ Opportunity Analysis By Material, 2022 to 2032

7. Global Market Analysis 2017 to 2021 and Forecast 2022 to 2032, By Region

    7.1. Introduction

    7.2. Historical Market Size Value (US$ Million) Analysis By Region, 2017 to 2021

    7.3. Current Market Size Value (US$ Million) Analysis and Forecast By Region, 2022 to 2032

        7.3.1. North America

        7.3.2. Latin America

        7.3.3. Europe

        7.3.4. South Asia

        7.3.5. East Asia

        7.3.6. Oceania

        7.3.7. Middle East and Africa(MEA)

    7.4. Market Attractiveness Analysis By Region

8. North America Market Analysis 2017 to 2021 and Forecast 2022 to 2032, By Country

    8.1. Historical Market Size Value (US$ Million) Trend Analysis By Market Taxonomy, 2017 to 2021

    8.2. Market Size Value (US$ Million) Forecast By Market Taxonomy, 2022 to 2032

        8.2.1. By Country

            8.2.1.1. USA

            8.2.1.2. Canada

        8.2.2. By Type

        8.2.3. By Material

    8.3. Market Attractiveness Analysis

        8.3.1. By Country

        8.3.2. By Type

        8.3.3. By Material

    8.4. Key Takeaways

9. Latin America Market Analysis 2017 to 2021 and Forecast 2022 to 2032, By Country

    9.1. Historical Market Size Value (US$ Million) Trend Analysis By Market Taxonomy, 2017 to 2021

    9.2. Market Size Value (US$ Million) Forecast By Market Taxonomy, 2022 to 2032

        9.2.1. By Country

            9.2.1.1. Brazil

            9.2.1.2. Mexico

            9.2.1.3. Rest of Latin America

        9.2.2. By Type

        9.2.3. By Material

    9.3. Market Attractiveness Analysis

        9.3.1. By Country

        9.3.2. By Type

        9.3.3. By Material

    9.4. Key Takeaways

10. Europe Market Analysis 2017 to 2021 and Forecast 2022 to 2032, By Country

    10.1. Historical Market Size Value (US$ Million) Trend Analysis By Market Taxonomy, 2017 to 2021

    10.2. Market Size Value (US$ Million) Forecast By Market Taxonomy, 2022 to 2032

        10.2.1. By Country

            10.2.1.1. Germany

            10.2.1.2. United Kingdom

            10.2.1.3. France

            10.2.1.4. Spain

            10.2.1.5. Italy

            10.2.1.6. Rest of Europe

        10.2.2. By Type

        10.2.3. By Material

    10.3. Market Attractiveness Analysis

        10.3.1. By Country

        10.3.2. By Type

        10.3.3. By Material

    10.4. Key Takeaways

11. South Asia Market Analysis 2017 to 2021 and Forecast 2022 to 2032, By Country

    11.1. Historical Market Size Value (US$ Million) Trend Analysis By Market Taxonomy, 2017 to 2021

    11.2. Market Size Value (US$ Million) Forecast By Market Taxonomy, 2022 to 2032

        11.2.1. By Country

            11.2.1.1. India

            11.2.1.2. Malaysia

            11.2.1.3. Singapore

            11.2.1.4. Thailand

            11.2.1.5. Rest of South Asia

        11.2.2. By Type

        11.2.3. By Material

    11.3. Market Attractiveness Analysis

        11.3.1. By Country

        11.3.2. By Type

        11.3.3. By Material

    11.4. Key Takeaways

12. East Asia Market Analysis 2017 to 2021 and Forecast 2022 to 2032, By Country

    12.1. Historical Market Size Value (US$ Million) Trend Analysis By Market Taxonomy, 2017 to 2021

    12.2. Market Size Value (US$ Million) Forecast By Market Taxonomy, 2022 to 2032

        12.2.1. By Country

            12.2.1.1. China

            12.2.1.2. Japan

            12.2.1.3. South Korea

        12.2.2. By Type

        12.2.3. By Material

    12.3. Market Attractiveness Analysis

        12.3.1. By Country

        12.3.2. By Type

        12.3.3. By Material

    12.4. Key Takeaways

13. Oceania Market Analysis 2017 to 2021 and Forecast 2022 to 2032, By Country

    13.1. Historical Market Size Value (US$ Million) Trend Analysis By Market Taxonomy, 2017 to 2021

    13.2. Market Size Value (US$ Million) Forecast By Market Taxonomy, 2022 to 2032

        13.2.1. By Country

            13.2.1.1. Australia

            13.2.1.2. New Zealand

        13.2.2. By Type

        13.2.3. By Material

    13.3. Market Attractiveness Analysis

        13.3.1. By Country

        13.3.2. By Type

        13.3.3. By Material

    13.4. Key Takeaways

14. MEA Market Analysis 2017 to 2021 and Forecast 2022 to 2032, By Country

    14.1. Historical Market Size Value (US$ Million) Trend Analysis By Market Taxonomy, 2017 to 2021

    14.2. Market Size Value (US$ Million) Forecast By Market Taxonomy, 2022 to 2032

        14.2.1. By Country

            14.2.1.1. GCC Countries

            14.2.1.2. South Africa

            14.2.1.3. Israel

            14.2.1.4. Rest of Middle East and Africa(MEA)

        14.2.2. By Type

        14.2.3. By Material

    14.3. Market Attractiveness Analysis

        14.3.1. By Country

        14.3.2. By Type

        14.3.3. By Material

    14.4. Key Takeaways

15. Key Countries Market Analysis

    15.1. USA

        15.1.1. Pricing Analysis

        15.1.2. Market Share Analysis, 2021

            15.1.2.1. By Type

            15.1.2.2. By Material

    15.2. Canada

        15.2.1. Pricing Analysis

        15.2.2. Market Share Analysis, 2021

            15.2.2.1. By Type

            15.2.2.2. By Material

    15.3. Brazil

        15.3.1. Pricing Analysis

        15.3.2. Market Share Analysis, 2021

            15.3.2.1. By Type

            15.3.2.2. By Material

    15.4. Mexico

        15.4.1. Pricing Analysis

        15.4.2. Market Share Analysis, 2021

            15.4.2.1. By Type

            15.4.2.2. By Material

    15.5. Germany

        15.5.1. Pricing Analysis

        15.5.2. Market Share Analysis, 2021

            15.5.2.1. By Type

            15.5.2.2. By Material

    15.6. United Kingdom

        15.6.1. Pricing Analysis

        15.6.2. Market Share Analysis, 2021

            15.6.2.1. By Type

            15.6.2.2. By Material

    15.7. France

        15.7.1. Pricing Analysis

        15.7.2. Market Share Analysis, 2021

            15.7.2.1. By Type

            15.7.2.2. By Material

    15.8. Spain

        15.8.1. Pricing Analysis

        15.8.2. Market Share Analysis, 2021

            15.8.2.1. By Type

            15.8.2.2. By Material

    15.9. Italy

        15.9.1. Pricing Analysis

        15.9.2. Market Share Analysis, 2021

            15.9.2.1. By Type

            15.9.2.2. By Material

    15.10. India

        15.10.1. Pricing Analysis

        15.10.2. Market Share Analysis, 2021

            15.10.2.1. By Type

            15.10.2.2. By Material

    15.11. Malaysia

        15.11.1. Pricing Analysis

        15.11.2. Market Share Analysis, 2021

            15.11.2.1. By Type

            15.11.2.2. By Material

    15.12. Singapore

        15.12.1. Pricing Analysis

        15.12.2. Market Share Analysis, 2021

            15.12.2.1. By Type

            15.12.2.2. By Material

    15.13. Thailand

        15.13.1. Pricing Analysis

        15.13.2. Market Share Analysis, 2021

            15.13.2.1. By Type

            15.13.2.2. By Material

    15.14. China

        15.14.1. Pricing Analysis

        15.14.2. Market Share Analysis, 2021

            15.14.2.1. By Type

            15.14.2.2. By Material

    15.15. Japan

        15.15.1. Pricing Analysis

        15.15.2. Market Share Analysis, 2021

            15.15.2.1. By Type

            15.15.2.2. By Material

    15.16. South Korea

        15.16.1. Pricing Analysis

        15.16.2. Market Share Analysis, 2021

            15.16.2.1. By Type

            15.16.2.2. By Material

    15.17. Australia

        15.17.1. Pricing Analysis

        15.17.2. Market Share Analysis, 2021

            15.17.2.1. By Type

            15.17.2.2. By Material

    15.18. New Zealand

        15.18.1. Pricing Analysis

        15.18.2. Market Share Analysis, 2021

            15.18.2.1. By Type

            15.18.2.2. By Material

    15.19. GCC Countries

        15.19.1. Pricing Analysis

        15.19.2. Market Share Analysis, 2021

            15.19.2.1. By Type

            15.19.2.2. By Material

    15.20. South Africa

        15.20.1. Pricing Analysis

        15.20.2. Market Share Analysis, 2021

            15.20.2.1. By Type

            15.20.2.2. By Material

    15.21. Israel

        15.21.1. Pricing Analysis

        15.21.2. Market Share Analysis, 2021

            15.21.2.1. By Type

            15.21.2.2. By Material

16. Market Structure Analysis

    16.1. Competition Dashboard

    16.2. Competition Benchmarking

    16.3. Market Share Analysis of Top Players

        16.3.1. By Regional

        16.3.2. By Type

        16.3.3. By Material

17. Competition Analysis

    17.1. Competition Deep Dive

        17.1.1. Aeroklas

            17.1.1.1. Overview

            17.1.1.2. Product Portfolio

            17.1.1.3. Profitability by Market Segments

            17.1.1.4. Sales Footprint

            17.1.1.5. Strategy Overview

                17.1.1.5.1. Marketing Strategy

        17.1.2. Rhino Linings

            17.1.2.1. Overview

            17.1.2.2. Product Portfolio

            17.1.2.3. Profitability by Market Segments

            17.1.2.4. Sales Footprint

            17.1.2.5. Strategy Overview

                17.1.2.5.1. Marketing Strategy

        17.1.3. Toff Liner

            17.1.3.1. Overview

            17.1.3.2. Product Portfolio

            17.1.3.3. Profitability by Market Segments

            17.1.3.4. Sales Footprint

            17.1.3.5. Strategy Overview

                17.1.3.5.1. Marketing Strategy

        17.1.4. Panda Corporation

            17.1.4.1. Overview

            17.1.4.2. Product Portfolio

            17.1.4.3. Profitability by Market Segments

            17.1.4.4. Sales Footprint

            17.1.4.5. Strategy Overview

                17.1.4.5.1. Marketing Strategy

        17.1.5. LINE-X

            17.1.5.1. Overview

            17.1.5.2. Product Portfolio

            17.1.5.3. Profitability by Market Segments

            17.1.5.4. Sales Footprint

            17.1.5.5. Strategy Overview

                17.1.5.5.1. Marketing Strategy

        17.1.6. Homestead Products

            17.1.6.1. Overview

            17.1.6.2. Product Portfolio

            17.1.6.3. Profitability by Market Segments

            17.1.6.4. Sales Footprint

            17.1.6.5. Strategy Overview

                17.1.6.5.1. Marketing Strategy

        17.1.7. Ultimate Linings

            17.1.7.1. Overview

            17.1.7.2. Product Portfolio

            17.1.7.3. Profitability by Market Segments

            17.1.7.4. Sales Footprint

            17.1.7.5. Strategy Overview

                17.1.7.5.1. Marketing Strategy

        17.1.8. Industrial Polymers LLC

            17.1.8.1. Overview

            17.1.8.2. Product Portfolio

            17.1.8.3. Profitability by Market Segments

            17.1.8.4. Sales Footprint

            17.1.8.5. Strategy Overview

                17.1.8.5.1. Marketing Strategy

        17.1.9. Rugged Liner

            17.1.9.1. Overview

            17.1.9.2. Product Portfolio

            17.1.9.3. Profitability by Market Segments

            17.1.9.4. Sales Footprint

            17.1.9.5. Strategy Overview

                17.1.9.5.1. Marketing Strategy

        17.1.10. DualLiner

            17.1.10.1. Overview

            17.1.10.2. Product Portfolio

            17.1.10.3. Profitability by Market Segments

            17.1.10.4. Sales Footprint

            17.1.10.5. Strategy Overview

                17.1.10.5.1. Marketing Strategy

18. Assumptions & Acronyms Used

19. Research Methodology

Don't pay for what you don't need

Customize your report by selecting specific countries or regions and save 30%!

List of Tables

Table 1: Global Market Value (US$ Million) Forecast by Region, 2017 to 2032

Table 2: Global Market Value (US$ Million) Forecast by Type, 2017 to 2032

Table 3: Global Market Value (US$ Million) Forecast by Material, 2017 to 2032

Table 4: North America Market Value (US$ Million) Forecast by Country, 2017 to 2032

Table 5: North America Market Value (US$ Million) Forecast by Type, 2017 to 2032

Table 6: North America Market Value (US$ Million) Forecast by Material, 2017 to 2032

Table 7: Latin America Market Value (US$ Million) Forecast by Country, 2017 to 2032

Table 8: Latin America Market Value (US$ Million) Forecast by Type, 2017 to 2032

Table 9: Latin America Market Value (US$ Million) Forecast by Material, 2017 to 2032

Table 10: Europe Market Value (US$ Million) Forecast by Country, 2017 to 2032

Table 11: Europe Market Value (US$ Million) Forecast by Type, 2017 to 2032

Table 12: Europe Market Value (US$ Million) Forecast by Material, 2017 to 2032

Table 13: South Asia Market Value (US$ Million) Forecast by Country, 2017 to 2032

Table 14: South Asia Market Value (US$ Million) Forecast by Type, 2017 to 2032

Table 15: South Asia Market Value (US$ Million) Forecast by Material, 2017 to 2032

Table 16: East Asia Market Value (US$ Million) Forecast by Country, 2017 to 2032

Table 17: East Asia Market Value (US$ Million) Forecast by Type, 2017 to 2032

Table 18: East Asia Market Value (US$ Million) Forecast by Material, 2017 to 2032

Table 19: Oceania Market Value (US$ Million) Forecast by Country, 2017 to 2032

Table 20: Oceania Market Value (US$ Million) Forecast by Type, 2017 to 2032

Table 21: Oceania Market Value (US$ Million) Forecast by Material, 2017 to 2032

Table 22: MEA Market Value (US$ Million) Forecast by Country, 2017 to 2032

Table 23: MEA Market Value (US$ Million) Forecast by Type, 2017 to 2032

Table 24: MEA Market Value (US$ Million) Forecast by Material, 2017 to 2032
Nikhil Kaitwade
Nikhil Kaitwade

Principal Consultant

Talk to Analyst

Find your sweet spots for generating winning opportunities in this market.

List of Charts

Figure 1: Global Market Value (US$ Million) by Type, 2022 to 2032

Figure 2: Global Market Value (US$ Million) by Material, 2022 to 2032

Figure 3: Global Market Value (US$ Million) by Region, 2022 to 2032

Figure 4: Global Market Value (US$ Million) Analysis by Region, 2017 to 2032

Figure 5: Global Market Value Share (%) and BPS Analysis by Region, 2022 to 2032

Figure 6: Global Market Y-o-Y Growth (%) Projections by Region, 2022 to 2032

Figure 7: Global Market Value (US$ Million) Analysis by Type, 2017 to 2032

Figure 8: Global Market Value Share (%) and BPS Analysis by Type, 2022 to 2032

Figure 9: Global Market Y-o-Y Growth (%) Projections by Type, 2022 to 2032

Figure 10: Global Market Value (US$ Million) Analysis by Material, 2017 to 2032

Figure 11: Global Market Value Share (%) and BPS Analysis by Material, 2022 to 2032

Figure 12: Global Market Y-o-Y Growth (%) Projections by Material, 2022 to 2032

Figure 13: Global Market Attractiveness by Type, 2022 to 2032

Figure 14: Global Market Attractiveness by Material, 2022 to 2032

Figure 15: Global Market Attractiveness by Region, 2022 to 2032

Figure 16: North America Market Value (US$ Million) by Type, 2022 to 2032

Figure 17: North America Market Value (US$ Million) by Material, 2022 to 2032

Figure 18: North America Market Value (US$ Million) by Country, 2022 to 2032

Figure 19: North America Market Value (US$ Million) Analysis by Country, 2017 to 2032

Figure 20: North America Market Value Share (%) and BPS Analysis by Country, 2022 to 2032

Figure 21: North America Market Y-o-Y Growth (%) Projections by Country, 2022 to 2032

Figure 22: North America Market Value (US$ Million) Analysis by Type, 2017 to 2032

Figure 23: North America Market Value Share (%) and BPS Analysis by Type, 2022 to 2032

Figure 24: North America Market Y-o-Y Growth (%) Projections by Type, 2022 to 2032

Figure 25: North America Market Value (US$ Million) Analysis by Material, 2017 to 2032

Figure 26: North America Market Value Share (%) and BPS Analysis by Material, 2022 to 2032

Figure 27: North America Market Y-o-Y Growth (%) Projections by Material, 2022 to 2032

Figure 28: North America Market Attractiveness by Type, 2022 to 2032

Figure 29: North America Market Attractiveness by Material, 2022 to 2032

Figure 30: North America Market Attractiveness by Country, 2022 to 2032

Figure 31: Latin America Market Value (US$ Million) by Type, 2022 to 2032

Figure 32: Latin America Market Value (US$ Million) by Material, 2022 to 2032

Figure 33: Latin America Market Value (US$ Million) by Country, 2022 to 2032

Figure 34: Latin America Market Value (US$ Million) Analysis by Country, 2017 to 2032

Figure 35: Latin America Market Value Share (%) and BPS Analysis by Country, 2022 to 2032

Figure 36: Latin America Market Y-o-Y Growth (%) Projections by Country, 2022 to 2032

Figure 37: Latin America Market Value (US$ Million) Analysis by Type, 2017 to 2032

Figure 38: Latin America Market Value Share (%) and BPS Analysis by Type, 2022 to 2032

Figure 39: Latin America Market Y-o-Y Growth (%) Projections by Type, 2022 to 2032

Figure 40: Latin America Market Value (US$ Million) Analysis by Material, 2017 to 2032

Figure 41: Latin America Market Value Share (%) and BPS Analysis by Material, 2022 to 2032

Figure 42: Latin America Market Y-o-Y Growth (%) Projections by Material, 2022 to 2032

Figure 43: Latin America Market Attractiveness by Type, 2022 to 2032

Figure 44: Latin America Market Attractiveness by Material, 2022 to 2032

Figure 45: Latin America Market Attractiveness by Country, 2022 to 2032

Figure 46: Europe Market Value (US$ Million) by Type, 2022 to 2032

Figure 47: Europe Market Value (US$ Million) by Material, 2022 to 2032

Figure 48: Europe Market Value (US$ Million) by Country, 2022 to 2032

Figure 49: Europe Market Value (US$ Million) Analysis by Country, 2017 to 2032

Figure 50: Europe Market Value Share (%) and BPS Analysis by Country, 2022 to 2032

Figure 51: Europe Market Y-o-Y Growth (%) Projections by Country, 2022 to 2032

Figure 52: Europe Market Value (US$ Million) Analysis by Type, 2017 to 2032

Figure 53: Europe Market Value Share (%) and BPS Analysis by Type, 2022 to 2032

Figure 54: Europe Market Y-o-Y Growth (%) Projections by Type, 2022 to 2032

Figure 55: Europe Market Value (US$ Million) Analysis by Material, 2017 to 2032

Figure 56: Europe Market Value Share (%) and BPS Analysis by Material, 2022 to 2032

Figure 57: Europe Market Y-o-Y Growth (%) Projections by Material, 2022 to 2032

Figure 58: Europe Market Attractiveness by Type, 2022 to 2032

Figure 59: Europe Market Attractiveness by Material, 2022 to 2032

Figure 60: Europe Market Attractiveness by Country, 2022 to 2032

Figure 61: South Asia Market Value (US$ Million) by Type, 2022 to 2032

Figure 62: South Asia Market Value (US$ Million) by Material, 2022 to 2032

Figure 63: South Asia Market Value (US$ Million) by Country, 2022 to 2032

Figure 64: South Asia Market Value (US$ Million) Analysis by Country, 2017 to 2032

Figure 65: South Asia Market Value Share (%) and BPS Analysis by Country, 2022 to 2032

Figure 66: South Asia Market Y-o-Y Growth (%) Projections by Country, 2022 to 2032

Figure 67: South Asia Market Value (US$ Million) Analysis by Type, 2017 to 2032

Figure 68: South Asia Market Value Share (%) and BPS Analysis by Type, 2022 to 2032

Figure 69: South Asia Market Y-o-Y Growth (%) Projections by Type, 2022 to 2032

Figure 70: South Asia Market Value (US$ Million) Analysis by Material, 2017 to 2032

Figure 71: South Asia Market Value Share (%) and BPS Analysis by Material, 2022 to 2032

Figure 72: South Asia Market Y-o-Y Growth (%) Projections by Material, 2022 to 2032

Figure 73: South Asia Market Attractiveness by Type, 2022 to 2032

Figure 74: South Asia Market Attractiveness by Material, 2022 to 2032

Figure 75: South Asia Market Attractiveness by Country, 2022 to 2032

Figure 76: East Asia Market Value (US$ Million) by Type, 2022 to 2032

Figure 77: East Asia Market Value (US$ Million) by Material, 2022 to 2032

Figure 78: East Asia Market Value (US$ Million) by Country, 2022 to 2032

Figure 79: East Asia Market Value (US$ Million) Analysis by Country, 2017 to 2032

Figure 80: East Asia Market Value Share (%) and BPS Analysis by Country, 2022 to 2032

Figure 81: East Asia Market Y-o-Y Growth (%) Projections by Country, 2022 to 2032

Figure 82: East Asia Market Value (US$ Million) Analysis by Type, 2017 to 2032

Figure 83: East Asia Market Value Share (%) and BPS Analysis by Type, 2022 to 2032

Figure 84: East Asia Market Y-o-Y Growth (%) Projections by Type, 2022 to 2032

Figure 85: East Asia Market Value (US$ Million) Analysis by Material, 2017 to 2032

Figure 86: East Asia Market Value Share (%) and BPS Analysis by Material, 2022 to 2032

Figure 87: East Asia Market Y-o-Y Growth (%) Projections by Material, 2022 to 2032

Figure 88: East Asia Market Attractiveness by Type, 2022 to 2032

Figure 89: East Asia Market Attractiveness by Material, 2022 to 2032

Figure 90: East Asia Market Attractiveness by Country, 2022 to 2032

Figure 91: Oceania Market Value (US$ Million) by Type, 2022 to 2032

Figure 92: Oceania Market Value (US$ Million) by Material, 2022 to 2032

Figure 93: Oceania Market Value (US$ Million) by Country, 2022 to 2032

Figure 94: Oceania Market Value (US$ Million) Analysis by Country, 2017 to 2032

Figure 95: Oceania Market Value Share (%) and BPS Analysis by Country, 2022 to 2032

Figure 96: Oceania Market Y-o-Y Growth (%) Projections by Country, 2022 to 2032

Figure 97: Oceania Market Value (US$ Million) Analysis by Type, 2017 to 2032

Figure 98: Oceania Market Value Share (%) and BPS Analysis by Type, 2022 to 2032

Figure 99: Oceania Market Y-o-Y Growth (%) Projections by Type, 2022 to 2032

Figure 100: Oceania Market Value (US$ Million) Analysis by Material, 2017 to 2032

Figure 101: Oceania Market Value Share (%) and BPS Analysis by Material, 2022 to 2032

Figure 102: Oceania Market Y-o-Y Growth (%) Projections by Material, 2022 to 2032

Figure 103: Oceania Market Attractiveness by Type, 2022 to 2032

Figure 104: Oceania Market Attractiveness by Material, 2022 to 2032

Figure 105: Oceania Market Attractiveness by Country, 2022 to 2032

Figure 106: MEA Market Value (US$ Million) by Type, 2022 to 2032

Figure 107: MEA Market Value (US$ Million) by Material, 2022 to 2032

Figure 108: MEA Market Value (US$ Million) by Country, 2022 to 2032

Figure 109: MEA Market Value (US$ Million) Analysis by Country, 2017 to 2032

Figure 110: MEA Market Value Share (%) and BPS Analysis by Country, 2022 to 2032

Figure 111: MEA Market Y-o-Y Growth (%) Projections by Country, 2022 to 2032

Figure 112: MEA Market Value (US$ Million) Analysis by Type, 2017 to 2032

Figure 113: MEA Market Value Share (%) and BPS Analysis by Type, 2022 to 2032

Figure 114: MEA Market Y-o-Y Growth (%) Projections by Type, 2022 to 2032

Figure 115: MEA Market Value (US$ Million) Analysis by Material, 2017 to 2032

Figure 116: MEA Market Value Share (%) and BPS Analysis by Material, 2022 to 2032

Figure 117: MEA Market Y-o-Y Growth (%) Projections by Material, 2022 to 2032

Figure 118: MEA Market Attractiveness by Type, 2022 to 2032

Figure 119: MEA Market Attractiveness by Material, 2022 to 2032

Figure 120: MEA Market Attractiveness by Country, 2022 to 2032

Recommendations

Automotive

Fire Truck Market

Published : October 2023

Automotive

Wireline Trucks Market

Published : February 2023

Automotive

Truck Mounted Knuckle Boom Cranes Market

Published : November 2022

Explore Automotive Insights

View Reports