
- Market Size (2026)
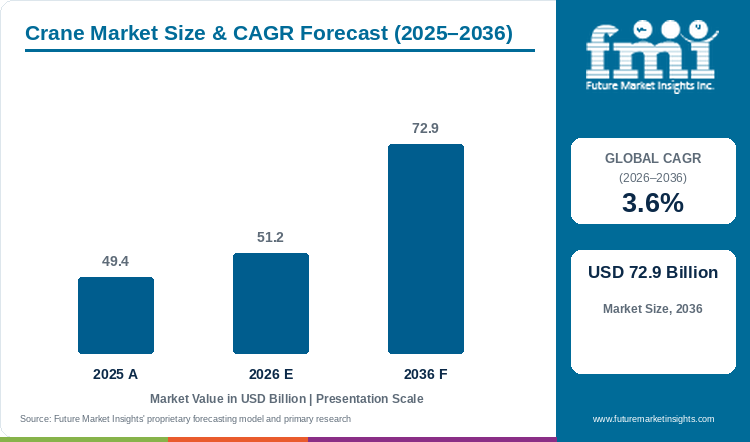
- USD 51.2 Bn
- Forecast (2036)
- USD 72.9 Bn
- CAGR (2026 to 2036)
- 3.6%
How big is the crane market in 2026?
The crane market is estimated at USD 51.2 billion in 2026, compared with USD 49.4 billion in 2025. Sales are forecast to reach USD 72.9 billion in 2036, growing at a 3.6% CAGR from 2026 to 2036.
Crane selection starts with the load and the conditions under which it must move, because rated capacity changes with reach and machine configuration. A construction site requiring a long working radius creates a different specification from a shipyard moving loads along established rails, even where the headline lifting capacities appear similar. Inspection and maintenance remain continuing ownership commitments as ropes and structural components deteriorate, requiring fleet owners to allow for periods when equipment is unavailable. Tower cranes and construction lead their respective 2026 classifications, alongside mobile and industrial systems with distinct operating patterns. Individual delivery records help identify projects, although wider programme budgets may cover several assets. Through 2036, the purchasing case will depend on the suitability of the lifting arrangement and support throughout its working life, with visibility, communication, testing and acceptance forming part of the route into regular service.
Key Market Trends & Insights
- The Tower Cranes segment is projected to account for 47.3% of type demand in 2026.
- The Construction segment is projected to account for 52.0% of application demand in 2026.
- 50 to 250 MT is projected to account for 34.0% of capacity demand in 2026.
- Stiff Boom is projected to account for 57.0% of design demand in 2026.
Regional Highlights
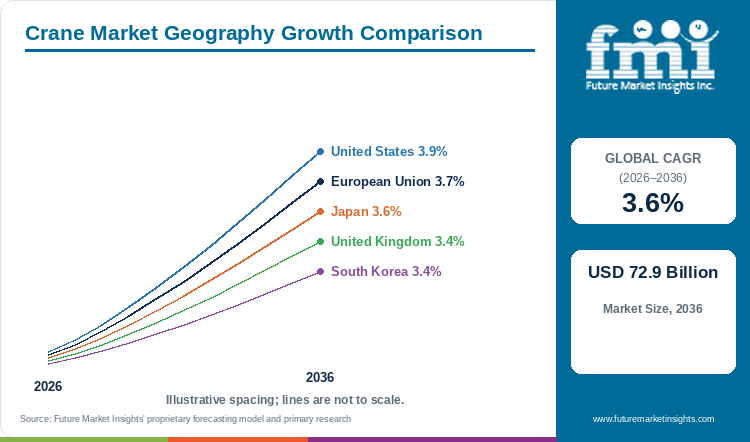
- United States records the highest profiled forecast at 3.9% CAGR from 2026 to 2036.
- United Kingdom is forecast at 3.4% CAGR over the same period. Country and combined-market rates are analyst estimates.
Market Size & Forecast
Table 1: Market Size and Forecast for Crane Market, 2026 to 2036
| Metric | Value |
|---|---|
| 2025 market value | USD 49.4 billion |
| 2026 market estimate | USD 51.2 billion |
| 2036 market forecast | USD 72.9 billion |
| CAGR, 2026 to 2036 | 3.6% |
Purchasing Evidence and Operating Requirements
Table 2: Purchasing Evidence and Operating Requirements
| Source | Date | Evidence | Coverage |
|---|---|---|---|
| Pearl Harbor Naval Shipyard and Intermediate Maintenance Facility, U.S. Navy / DVIDS | 2026-09-29 | Government equipment delivery report | Delivery 2 September 2026; acceptance planned December 2026. |
| Canadian Centre for Occupational Health and Safety | 2025-06-23 | Official technical guidance | Guidance revision June 2025. |
| UK Rail Accident Investigation Branch | 2026-03-24 | Official accident investigation | Incident 15 March 2025; report March 2026. |
| U.S. Department of Transportation, Maritime Administration | 2025-07-21 | Government grant awards | Fiscal year 2025 grant awards. |
Analyst Perspective
Working radius and site configuration determine how much of a crane's capacity the project can use, while testing and operational acceptance determine when that capacity becomes available. Service access and the installation sequence therefore belong alongside lifting performance in the assessment of a proposed purchase.
- Nikhil Kaitwade, Principal Analyst at Future Market Insights
How is the crane market segmented?
By type, the categories are Rough Terrain Cranes (RTCs), All Terrain Cranes (ATCs), Truck Cranes, Mobile Harbors, Off-shore Ship Cranes, Loader Cranes, Railroad Cranes, Crawler Cranes, Tower Cranes, Others. By application, the categories are Aerospace and Defense, Automotive & Railways, Heavy Engineering, General Engineering, Mining, Construction, Marine, Shipping & Material Handling, Energy (Power & Gas). By capacity, the categories are Up to 5 MT, 5 to 50 MT, 50 to 250 MT, 250 to 500 MT, 500 to 1,500 MT, 1,500 to 3,000 MT. By design, the categories are Stiff Boom, Knuckle Boom/Telescopic Boom.
Why does the Tower Cranes segment account for 47.3% of type demand in 2026?
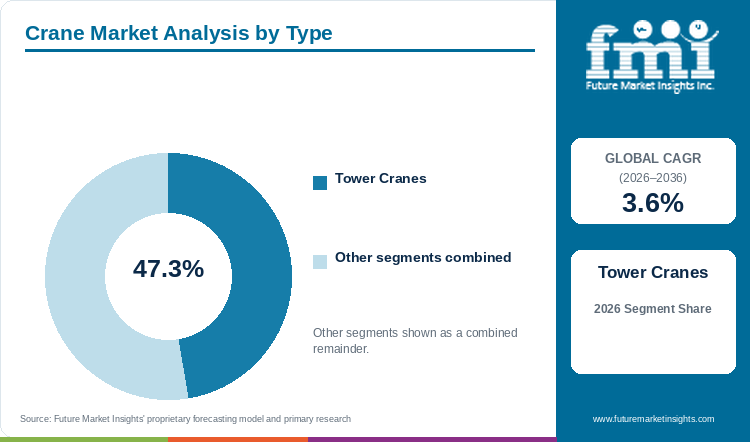
Tower Cranes hold 47.3% of type demand in 2026, serving repeated lifts over a construction area whose height and working radius determine the required configuration.
Table 3: Type Share for Crane Market, 2026
| Type | Share (2026) |
|---|---|
| Tower Cranes | 47.3% |
| Other type segments | 52.7% |
| Total | 100.0% |
A tower crane's useful reach must be available at the positions where materials will actually be lifted, with working height and radius determining the mast and jib arrangement. Foundation design and erection access then establish whether that configuration can be installed within the project site. This sequence explains why the category's large share carries a substantial planning requirement; the dedicated tower crane market covers the equipment class in more detail, while the wider lifting market also contains machines designed for different operating patterns.
- The Tower Cranes segment accounts for 47.3% of type demand in 2026.
- Site radius and foundation requirements guide tower-crane selection.
Why does the Construction segment account for 52.0% of application demand in 2026?
Construction represents 52.0% of application demand in 2026, with the sequencing of structural work and material deliveries governing how effectively crane time can be used.
Table 4: Application Share for Crane Market, 2026
| Application | Share (2026) |
|---|---|
| Construction | 52.0% |
| Other application segments | 48.0% |
| Total | 100.0% |
Several trades can need the same crane during different stages of construction, leaving the lifting schedule with a direct influence on the capacity a project can actually use. A machine may reach every planned location and still spend time waiting for deliveries or access, so procurement has to connect the operating period with erection and dismantling windows. These requirements support an application share that includes equipment availability, coordination and service, with the configuration selected for the project's progression as well as its heaviest individual lift.
- The Construction segment accounts for 52.0% of application demand in 2026.
- Construction lifting needs coordination with the delivery schedule.
What are the drivers, restraints, and opportunities in the crane market?
Driver: Specialized facilities require fit-for-purpose lifting assets
Pearl Harbor's September 2026 delivery of a 175-ton portal crane included an adjustable rail base suited to the site's track layouts, with testing still required before acceptance. The configuration shows how existing interfaces shape replacement, while temporary storage buildings can also affect the material access and weather protection needed around site logistics.
Restraint: Inspection and communication affect usable availability
CCOHS guidance identifies manufacturer-specific inspection and maintenance logbooks as operating controls, while RAIB's 2026 rail-crane report describes visibility and communication problems in a particular incident. These sources help identify procedures to review when workplace safety systems are specified for the actual lifting hazards and the work taking place around the machine.
Opportunity: Documented equipment funding creates targeted opportunities
MARAD's 2025 small-shipyard announcement identified grants contributing to two rough-terrain crane purchases, providing named equipment needs within wider funded work. Site surveys and lift planning help define the appropriate configuration, while a crane rental arrangement may serve temporary requirements when the expected workload does not justify ownership.
Which country and market growth rates are profiled?
Table 5: Country CAGR Comparison for Crane Market, 2026 to 2036
| Country | CAGR |
|---|---|
| United States | 3.9% |
| United Kingdom | 3.4% |
| European Union | 3.7% |
| Japan | 3.6% |
| South Korea | 3.4% |
Growth rates in the table are FMI analyst forecasts.
Country-wise Analysis
United States
Pearl Harbor's portal crane arrived before the inspection and testing required for planned acceptance, showing the stages that remain after physical delivery in a specialised United States project. Shipyard grants identify further equipment needs, but a funding contribution has to be read within the asset scope it supports. The 3.9% CAGR forecast for 2026 to 2036 includes such installations alongside other lifting duties, with suppliers needing to plan the route from delivery through commissioning before the customer can use the new capacity.
United Kingdom
RAIB's 2026 investigation of a March 2025 incident draws attention to visibility and communication during United Kingdom rail lifting work. Those procedures have to fit the job, even when a crane has sufficient physical capacity, and they form part of the operating assessment surrounding equipment use. Demand is projected at 3.4% CAGR during 2026 to 2036 across rail engineering and construction applications, where planning a lift requires an agreed method and clear responsibilities as well as a suitable load chart.
European Union
A crane moving loads through an industrial installation and one serving a changing construction site require different interfaces and working envelopes. That variety is present within the European Union's combined-market forecast of 3.7% CAGR over 2026 to 2036, so a shared nominal capacity provides only a starting point for comparison. Buyers need to establish the actual reach and local servicing requirements for each duty, allowing suppliers to define an equipment and support scope that can remain usable after installation.
Japan
Japanese projects with restricted setup areas may have few workable positions from which a crane can reach the intended loads. Resolving that layout before procurement also gives the owner a chance to preserve inspection and maintenance access, which can otherwise become difficult once adjacent work progresses. The country's 3.6% CAGR forecast for 2026 to 2036 includes these installation constraints, making the usable operating area and servicing route meaningful elements of a proposal rather than details to settle after the machine arrives.
South Korea
Fixed interfaces in a South Korean shipyard or plant can make crane replacement a specialised commissioning project, with more defined travel and connection requirements than a construction-lifting assignment. The owner needs an agreed operating envelope and a clear allocation of service work to prepare for equipment arrival and limit the interruption to existing operations. South Korea's demand is forecast at 3.4% CAGR from 2026 to 2036, with the commercial scope varying according to the installation that the machine will serve.
Who are the notable companies in the crane market?
Liebherr Group; Manitowoc Company, Inc.; Tadano Ltd.; Konecranes Plc; Terex Corporation
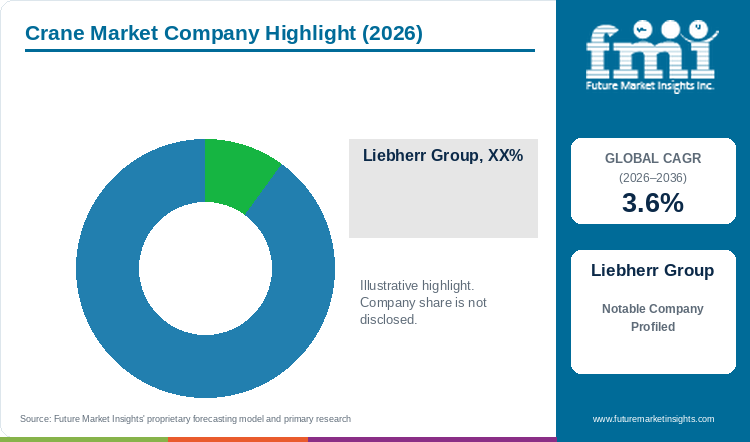
The lifting task shapes the relevant supplier group: Liebherr and Manitowoc have construction-crane portfolios, Tadano serves mobile lifting, and Konecranes provides industrial and port-handling equipment. Terex participates in selected lifting categories, with the required configuration and operating range determining which portfolios offer a suitable comparison for the project.
Competitive Benchmarking: Crane Market
Table 6: Competitive Benchmarking
| Participant | Relevant portfolio | Purchasing comparison |
|---|---|---|
| Liebherr Group | Construction and industrial cranes | Configuration and lifecycle support |
| Manitowoc Company, Inc. | Tower and mobile cranes | Lift envelope and setup requirements |
| Tadano Ltd. | Mobile lifting equipment | Capacity by reach and transport |
| Konecranes Plc | Industrial and port cranes | Installation and maintenance integration |
| Terex Corporation | Lifting equipment categories | Relevant range and service channel |
Key Developments in the Crane Market
- Pearl Harbor received its P-82 portal crane in September 2026. Delivery was followed by an inspection and testing phase ahead of planned acceptance.
- MARAD identified support for rough-terrain cranes at two named shipyards in July 2025. The grants do not establish delivery or the full purchase cost.
Key Players in the Crane Market
- Liebherr Group: Construction and industrial cranes.
- Manitowoc Company, Inc.: Tower and mobile cranes.
- Tadano Ltd.: Mobile lifting equipment.
- Konecranes Plc: Industrial and port cranes.
- Terex Corporation: Lifting equipment categories.
Crane Market - Report Scope
Table 7: Report Scope for Crane Market
| Coverage field | Report scope |
|---|---|
| Market definition | Mobile, rail-mounted and heavy-lift portal cranes, with procurement, operation and maintenance evidence kept distinct. |
| Historical reference year | 2025 |
| Market breakdown | type, application, capacity, design |
| Quantitative Units | USD Billion |
| Regions covered | North America; Latin America; Western Europe; Eastern Europe; East Asia; South Asia and Pacific; Middle East and Africa |
| Countries profiled | United States; United Kingdom; European Union; Japan; South Korea |
| Forecast period | 2026 to 2036 |
| Key companies profiled | Liebherr Group; Manitowoc Company, Inc.; Tadano Ltd.; Konecranes Plc; Terex Corporation |
Crane Market - Research Methodology
Table 8: Research Methodology
| Method | Approach |
|---|---|
| Quantitative analysis | Market values, category shares and country forecasts are presented as FMI analyst estimates. |
| Desk research | Government records, public procurement and technical research establish application conditions and documented activity. |
| Evidence assessment | Awards are distinguished from tenders. Laboratory and modeled results retain their stated operating limits. |
| Segmentation framework | Shares use the stated segment axis as their denominator; country rates use the stated forecast period. |
Crane Market by Segments
Type
- Rough Terrain Cranes (RTCs)
- All Terrain Cranes (ATCs)
- Truck Cranes
- Mobile Harbors
- Off-shore Ship Cranes
- Loader Cranes
- Railroad Cranes
- Crawler Cranes
- Tower Cranes
- Others
Application
- Aerospace and Defense
- Automotive & Railways
- Heavy Engineering
- General Engineering
- Mining
- Construction
- Marine
- Shipping & Material Handling
- Energy (Power & Gas)
Capacity
- Up to 5 MT
- 5 to 50 MT
- 50 to 250 MT
- 250 to 500 MT
- 500 to 1,500 MT
- 1,500 to 3,000 MT
Design
- Stiff Boom
- Knuckle Boom/Telescopic Boom
Crane Market by Region
- North America
- United States
- Canada
- Latin America
- Brazil
- Mexico
- Argentina
- Chile
- Western Europe
- Germany
- France
- United Kingdom
- Italy
- Spain
- Benelux
- Nordics
- Eastern Europe
- Poland
- Czech Republic
- Romania
- Hungary
- East Asia
- China
- Japan
- South Korea
- South Asia and Pacific
- India
- ASEAN
- Australia and New Zealand
- Middle East and Africa
- GCC Countries
- South Africa
- Türkiye
- Israel
Research Sources and Bibliography
- [1] Pearl Harbor Naval Shipyard and Intermediate Maintenance Facility, U.S. Navy / DVIDS. (2026-09-29). First in Decades: PHNSY & IMF Welcomes a New Heavy-Lift Crane to Bolster Submarine Readiness
- [2] Canadian Centre for Occupational Health and Safety. (2025-06-23). Materials Handling - Crane Maintenance
- [3] UK Rail Accident Investigation Branch. (2026-03-24). Report 03/2026: Two track workers struck by a wagon being propelled by a rail crane at Port Glasgow
- [4] U.S. Department of Transportation, Maritime Administration. (2025-07-21). President Trump's Transportation Secretary Sean P. Duffy Announces $8.75 Million in Grants to Revitalize U.S. Shipyards, Support Maritime Dominance
- Future Market Insights. (2026). Crane Market: Global industry analysis and opportunity assessment 2036.
This Report Answers
- How large is the crane market in 2026?
- What market value is forecast for 2036?
- Which type category leads in 2026?
- Why does Construction lead its category?
- Which profiled market has the highest forecast growth?
- Which companies participate in the crane market?
Table of Content
- Key Takeaways
- Market Size and CAGR
- Top Growth Driver
- Fastest Growing Segment
- Leading Region
- Key Companies
- Emerging Opportunities
- Executive Summary
- Global Market Outlook
- Demand-side Trends
- Supply-side Trends
- Technology Roadmap Analysis
- Analysis and Recommendations
- Analyst Perspective (What is happening? Why now? What should investors know?)
- Key Questions Answered
- How large is the market?
- What is the CAGR?
- What are key trends?
- Which region dominates?
- Who are the leaders?
Read More...
- Market Overview
- Market Coverage / Taxonomy
- Market Definition / Scope / Limitations
- Research Methodology
- Chapter Orientation
- Analytical Lens and Working Hypotheses
- Market Structure, Signals, and Trend Drivers
- Benchmarking and Cross-market Comparability
- Market Sizing, Forecasting, and Opportunity Mapping
- Research Design and Evidence Framework
- Desk Research Programme (Secondary Evidence)
- Expert Input and Fieldwork (Primary Evidence)
- Tooling, Models, and Reference Databases
- Data Engineering and Model Build
- Quality Assurance and Audit Trail
- Market Background
- Market Dynamics (Drivers, Restraints, Opportunity, Trends)
- Scenario Forecast (Optimistic, Likely, Conservative)
- Impact Analysis
- AI Impact
- Sustainability Impact
- Regulatory Impact
- Technology Impact
- Consumer / Buyer Analysis
- Purchase Drivers
- Adoption Barriers
- Buyer Journey
- Opportunity Map Analysis
- Product Life Cycle Analysis
- Supply Chain Analysis
- Investment Feasibility Matrix
- Value Chain Analysis
- PESTLE and Porter's Analysis
- Regulatory Landscape
- Regional Parent Market Outlook
- Production and Consumption Statistics
- Import and Export Statistics
- Global Market Analysis and Forecast, 2021 to 2036
- Historical Market Size Value (USD Billion) Analysis, 2021 to 2025
- Current and Future Market Size Value (USD Billion) Projections, 2026 to 2036
- Y-o-Y Growth Trend Analysis
- Absolute $ Opportunity Analysis
- Global Market Pricing Analysis, 2021 to 2036
- Global Market Analysis and Forecast, By Type, 2021 to 2036
- Introduction / Key Findings
- Historical Market Size Value (USD Billion) Analysis By Type, 2021 to 2025
- Current and Future Market Size Value (USD Billion) Analysis and Forecast By Type, 2026 to 2036
- Rough Terrain Cranes (RTCs)
- All Terrain Cranes (ATCs)
- Truck Cranes
- Mobile Harbors
- Off-shore Ship Cranes
- Loader Cranes
- Railroad Cranes
- Crawler Cranes
- Tower Cranes
- Others
- Y-o-Y Growth Trend Analysis By Type, 2021 to 2025
- Absolute $ Opportunity Analysis By Type, 2026 to 2036
- Global Market Analysis and Forecast, By Application, 2021 to 2036
- Introduction / Key Findings
- Historical Market Size Value (USD Billion) Analysis By Application, 2021 to 2025
- Current and Future Market Size Value (USD Billion) Analysis and Forecast By Application, 2026 to 2036
- Aerospace and Defense
- Automotive & Railways
- Heavy Engineering
- General Engineering
- Mining
- Construction
- Marine
- Shipping & Material Handling
- Energy (Power & Gas)
- Y-o-Y Growth Trend Analysis By Application, 2021 to 2025
- Absolute $ Opportunity Analysis By Application, 2026 to 2036
- Global Market Analysis and Forecast, By Capacity, 2021 to 2036
- Introduction / Key Findings
- Historical Market Size Value (USD Billion) Analysis By Capacity, 2021 to 2025
- Current and Future Market Size Value (USD Billion) Analysis and Forecast By Capacity, 2026 to 2036
- Up to 5 MT
- 5 to 50 MT
- 50 to 250 MT
- 250 to 500 MT
- 500 to 1,500 MT
- 1,500 to 3,000 MT
- Y-o-Y Growth Trend Analysis By Capacity, 2021 to 2025
- Absolute $ Opportunity Analysis By Capacity, 2026 to 2036
- Global Market Analysis and Forecast, By Design, 2021 to 2036
- Introduction / Key Findings
- Historical Market Size Value (USD Billion) Analysis By Design, 2021 to 2025
- Current and Future Market Size Value (USD Billion) Analysis and Forecast By Design, 2026 to 2036
- Stiff Boom
- Knuckle Boom/Telescopic Boom
- Y-o-Y Growth Trend Analysis By Design, 2021 to 2025
- Absolute $ Opportunity Analysis By Design, 2026 to 2036
- Global Market Analysis and Forecast, By Region, 2021 to 2036
- Introduction
- Historical Market Size Value (USD Billion) Analysis By Region, 2021 to 2025
- Current Market Size Value (USD Billion) Analysis and Forecast By Region, 2026 to 2036
- North America
- Latin America
- Western Europe
- Eastern Europe
- East Asia
- South Asia and Pacific
- Middle East and Africa
- Market Attractiveness Analysis By Region
- North America Market Analysis and Forecast, By Country, 2021 to 2036
- Historical Market Size Value (USD Billion) Trend Analysis By Market Taxonomy, 2021 to 2025
- Market Size Value (USD Billion) Forecast By Market Taxonomy, 2026 to 2036
- By Country
- United States
- Canada
- By Type
- By Application
- By Capacity
- By Design
- By Country
- Market Attractiveness Analysis
- By Country
- By Type
- By Application
- By Capacity
- By Design
- Key Takeaways
- Latin America Market Analysis and Forecast, By Country
- Historical Market Size Value (USD Billion) Trend Analysis By Market Taxonomy, 2021 to 2025
- Market Size Value (USD Billion) Forecast By Market Taxonomy, 2026 to 2036
- By Country
- Brazil
- Mexico
- Argentina
- Chile
- By Type
- By Application
- By Capacity
- By Design
- By Country
- Market Attractiveness Analysis
- By Country
- By Type
- By Application
- By Capacity
- By Design
- Key Takeaways
- Western Europe Market Analysis and Forecast, By Country
- Historical Market Size Value (USD Billion) Trend Analysis By Market Taxonomy, 2021 to 2025
- Market Size Value (USD Billion) Forecast By Market Taxonomy, 2026 to 2036
- By Country
- Germany
- France
- United Kingdom
- Italy
- Spain
- Benelux
- Nordics
- By Type
- By Application
- By Capacity
- By Design
- By Country
- Market Attractiveness Analysis
- By Country
- By Type
- By Application
- By Capacity
- By Design
- Key Takeaways
- Eastern Europe Market Analysis and Forecast, By Country
- Historical Market Size Value (USD Billion) Trend Analysis By Market Taxonomy, 2021 to 2025
- Market Size Value (USD Billion) Forecast By Market Taxonomy, 2026 to 2036
- By Country
- Poland
- Czech Republic
- Romania
- Hungary
- By Type
- By Application
- By Capacity
- By Design
- By Country
- Market Attractiveness Analysis
- By Country
- By Type
- By Application
- By Capacity
- By Design
- Key Takeaways
- East Asia Market Analysis and Forecast, By Country
- Historical Market Size Value (USD Billion) Trend Analysis By Market Taxonomy, 2021 to 2025
- Market Size Value (USD Billion) Forecast By Market Taxonomy, 2026 to 2036
- By Country
- China
- Japan
- South Korea
- By Type
- By Application
- By Capacity
- By Design
- By Country
- Market Attractiveness Analysis
- By Country
- By Type
- By Application
- By Capacity
- By Design
- Key Takeaways
- South Asia and Pacific Market Analysis and Forecast, By Country
- Historical Market Size Value (USD Billion) Trend Analysis By Market Taxonomy, 2021 to 2025
- Market Size Value (USD Billion) Forecast By Market Taxonomy, 2026 to 2036
- By Country
- India
- ASEAN
- Australia and New Zealand
- By Type
- By Application
- By Capacity
- By Design
- By Country
- Market Attractiveness Analysis
- By Country
- By Type
- By Application
- By Capacity
- By Design
- Key Takeaways
- Middle East and Africa Market Analysis and Forecast, By Country
- Historical Market Size Value (USD Billion) Trend Analysis By Market Taxonomy, 2021 to 2025
- Market Size Value (USD Billion) Forecast By Market Taxonomy, 2026 to 2036
- By Country
- GCC Countries
- South Africa
- Türkiye
- Israel
- By Type
- By Application
- By Capacity
- By Design
- By Country
- Market Attractiveness Analysis
- By Country
- By Type
- By Application
- By Capacity
- By Design
- Key Takeaways
- Key Countries Market Analysis
- United States
- Pricing Analysis
- Market Share Analysis, 2025
- By Type
- By Application
- By Capacity
- By Design
- Canada
- Pricing Analysis
- Market Share Analysis, 2025
- By Type
- By Application
- By Capacity
- By Design
- Mexico
- Pricing Analysis
- Market Share Analysis, 2025
- By Type
- By Application
- By Capacity
- By Design
- Brazil
- Pricing Analysis
- Market Share Analysis, 2025
- By Type
- By Application
- By Capacity
- By Design
- Chile
- Pricing Analysis
- Market Share Analysis, 2025
- By Type
- By Application
- By Capacity
- By Design
- Germany
- Pricing Analysis
- Market Share Analysis, 2025
- By Type
- By Application
- By Capacity
- By Design
- United Kingdom
- Pricing Analysis
- Market Share Analysis, 2025
- By Type
- By Application
- By Capacity
- By Design
- Italy
- Pricing Analysis
- Market Share Analysis, 2025
- By Type
- By Application
- By Capacity
- By Design
- Spain
- Pricing Analysis
- Market Share Analysis, 2025
- By Type
- By Application
- By Capacity
- By Design
- France
- Pricing Analysis
- Market Share Analysis, 2025
- By Type
- By Application
- By Capacity
- By Design
- India
- Pricing Analysis
- Market Share Analysis, 2025
- By Type
- By Application
- By Capacity
- By Design
- ASEAN
- Pricing Analysis
- Market Share Analysis, 2025
- By Type
- By Application
- By Capacity
- By Design
- Australia and New Zealand
- Pricing Analysis
- Market Share Analysis, 2025
- By Type
- By Application
- By Capacity
- By Design
- China
- Pricing Analysis
- Market Share Analysis, 2025
- By Type
- By Application
- By Capacity
- By Design
- Japan
- Pricing Analysis
- Market Share Analysis, 2025
- By Type
- By Application
- By Capacity
- By Design
- South Korea
- Pricing Analysis
- Market Share Analysis, 2025
- By Type
- By Application
- By Capacity
- By Design
- Poland
- Pricing Analysis
- Market Share Analysis, 2025
- By Type
- By Application
- By Capacity
- By Design
- Hungary
- Pricing Analysis
- Market Share Analysis, 2025
- By Type
- By Application
- By Capacity
- By Design
- Türkiye
- Pricing Analysis
- Market Share Analysis, 2025
- By Type
- By Application
- By Capacity
- By Design
- South Africa
- Pricing Analysis
- Market Share Analysis, 2025
- By Type
- By Application
- By Capacity
- By Design
- European Union
- Pricing Analysis
- Market Share Analysis, 2025
- By Type
- By Application
- By Capacity
- By Design
- United States
- Market Structure Analysis
- Competition Dashboard
- Competition Benchmarking
- Market Share Analysis of Top Players
- By Regional
- By Type
- By Application
- By Capacity
- By Design
- Emerging Startups
- Innovation Benchmarking
- Competition Analysis
- Competition Deep Dive
- Liebherr Group
- Overview
- Product Portfolio
- Profitability by Market Segments
- Sales Footprint
- Strategy Overview
- Marketing Strategy
- Product Strategy
- Channel Strategy
- Manitowoc Company, Inc.
- Tadano Ltd.
- Konecranes Plc
- Terex Corporation
- Liebherr Group: Construction and industrial cranes.
- Manitowoc Company, Inc.: Tower and mobile cranes.
- Tadano Ltd.: Mobile lifting equipment.
- Konecranes Plc: Industrial and port cranes.
- Terex Corporation: Lifting equipment categories.
- Liebherr Group
- Case Studies
- Success Stories
- Recent Developments
- Competition Deep Dive
- Assumptions & Acronyms Used
List of Tables
- Table 1: Global Market Value (USD Billion) Forecast by Region, 2021 to 2036
- Table 2: Global Market Value (USD Billion) Forecast by Type, 2021 to 2036
- Table 3: Global Market Value (USD Billion) Forecast by Application, 2021 to 2036
- Table 4: Global Market Value (USD Billion) Forecast by Capacity, 2021 to 2036
- Table 5: Global Market Value (USD Billion) Forecast by Design, 2021 to 2036
- Table 6: North America Market Value (USD Billion) Forecast by Country, 2021 to 2036
- Table 7: North America Market Value (USD Billion) Forecast by Type, 2021 to 2036
- Table 8: North America Market Value (USD Billion) Forecast by Application, 2021 to 2036
- Table 9: North America Market Value (USD Billion) Forecast by Capacity, 2021 to 2036
- Table 10: North America Market Value (USD Billion) Forecast by Design, 2021 to 2036
- Table 11: Latin America Market Value (USD Billion) Forecast by Country, 2021 to 2036
- Table 12: Latin America Market Value (USD Billion) Forecast by Type, 2021 to 2036
- Table 13: Latin America Market Value (USD Billion) Forecast by Application, 2021 to 2036
- Table 14: Latin America Market Value (USD Billion) Forecast by Capacity, 2021 to 2036
- Table 15: Latin America Market Value (USD Billion) Forecast by Design, 2021 to 2036
- Table 16: Western Europe Market Value (USD Billion) Forecast by Country, 2021 to 2036
- Table 17: Western Europe Market Value (USD Billion) Forecast by Type, 2021 to 2036
- Table 18: Western Europe Market Value (USD Billion) Forecast by Application, 2021 to 2036
- Table 19: Western Europe Market Value (USD Billion) Forecast by Capacity, 2021 to 2036
- Table 20: Western Europe Market Value (USD Billion) Forecast by Design, 2021 to 2036
- Table 21: Eastern Europe Market Value (USD Billion) Forecast by Country, 2021 to 2036
- Table 22: Eastern Europe Market Value (USD Billion) Forecast by Type, 2021 to 2036
- Table 23: Eastern Europe Market Value (USD Billion) Forecast by Application, 2021 to 2036
- Table 24: Eastern Europe Market Value (USD Billion) Forecast by Capacity, 2021 to 2036
- Table 25: Eastern Europe Market Value (USD Billion) Forecast by Design, 2021 to 2036
- Table 26: East Asia Market Value (USD Billion) Forecast by Country, 2021 to 2036
- Table 27: East Asia Market Value (USD Billion) Forecast by Type, 2021 to 2036
- Table 28: East Asia Market Value (USD Billion) Forecast by Application, 2021 to 2036
- Table 29: East Asia Market Value (USD Billion) Forecast by Capacity, 2021 to 2036
- Table 30: East Asia Market Value (USD Billion) Forecast by Design, 2021 to 2036
- Table 31: South Asia and Pacific Market Value (USD Billion) Forecast by Country, 2021 to 2036
- Table 32: South Asia and Pacific Market Value (USD Billion) Forecast by Type, 2021 to 2036
- Table 33: South Asia and Pacific Market Value (USD Billion) Forecast by Application, 2021 to 2036
- Table 34: South Asia and Pacific Market Value (USD Billion) Forecast by Capacity, 2021 to 2036
- Table 35: South Asia and Pacific Market Value (USD Billion) Forecast by Design, 2021 to 2036
- Table 36: Middle East and Africa Market Value (USD Billion) Forecast by Country, 2021 to 2036
- Table 37: Middle East and Africa Market Value (USD Billion) Forecast by Type, 2021 to 2036
- Table 38: Middle East and Africa Market Value (USD Billion) Forecast by Application, 2021 to 2036
- Table 39: Middle East and Africa Market Value (USD Billion) Forecast by Capacity, 2021 to 2036
- Table 40: Middle East and Africa Market Value (USD Billion) Forecast by Design, 2021 to 2036
List of Figures
- Figure 1: Global Market Pricing Analysis
- Figure 2: Global Market Value (USD Billion) Forecast 2021-2036
- Figure 3: Global Market Value Share and BPS Analysis by Type, 2026 and 2036
- Figure 4: Global Market Y-o-Y Growth Comparison by Type, 2026-2036
- Figure 5: Global Market Attractiveness Analysis by Type
- Figure 6: Global Market Value Share and BPS Analysis by Application, 2026 and 2036
- Figure 7: Global Market Y-o-Y Growth Comparison by Application, 2026-2036
- Figure 8: Global Market Attractiveness Analysis by Application
- Figure 9: Global Market Value Share and BPS Analysis by Capacity, 2026 and 2036
- Figure 10: Global Market Y-o-Y Growth Comparison by Capacity, 2026-2036
- Figure 11: Global Market Attractiveness Analysis by Capacity
- Figure 12: Global Market Value Share and BPS Analysis by Design, 2026 and 2036
- Figure 13: Global Market Y-o-Y Growth Comparison by Design, 2026-2036
- Figure 14: Global Market Attractiveness Analysis by Design
- Figure 15: Global Market Value (USD Billion) Share and BPS Analysis by Region, 2026 and 2036
- Figure 16: Global Market Y-o-Y Growth Comparison by Region, 2026-2036
- Figure 17: Global Market Attractiveness Analysis by Region
- Figure 18: North America Market Incremental Dollar Opportunity, 2026-2036
- Figure 19: Latin America Market Incremental Dollar Opportunity, 2026-2036
- Figure 20: Western Europe Market Incremental Dollar Opportunity, 2026-2036
- Figure 21: Eastern Europe Market Incremental Dollar Opportunity, 2026-2036
- Figure 22: East Asia Market Incremental Dollar Opportunity, 2026-2036
- Figure 23: South Asia and Pacific Market Incremental Dollar Opportunity, 2026-2036
- Figure 24: Middle East and Africa Market Incremental Dollar Opportunity, 2026-2036
- Figure 25: North America Market Value Share and BPS Analysis by Country, 2026 and 2036
- Figure 26: North America Market Value Share and BPS Analysis by Type, 2026 and 2036
- Figure 27: North America Market Y-o-Y Growth Comparison by Type, 2026-2036
- Figure 28: North America Market Attractiveness Analysis by Type
- Figure 29: North America Market Value Share and BPS Analysis by Application, 2026 and 2036
- Figure 30: North America Market Y-o-Y Growth Comparison by Application, 2026-2036
- Figure 31: North America Market Attractiveness Analysis by Application
- Figure 32: North America Market Value Share and BPS Analysis by Capacity, 2026 and 2036
- Figure 33: North America Market Y-o-Y Growth Comparison by Capacity, 2026-2036
- Figure 34: North America Market Attractiveness Analysis by Capacity
- Figure 35: North America Market Value Share and BPS Analysis by Design, 2026 and 2036
- Figure 36: North America Market Y-o-Y Growth Comparison by Design, 2026-2036
- Figure 37: North America Market Attractiveness Analysis by Design
- Figure 38: Latin America Market Value Share and BPS Analysis by Country, 2026 and 2036
- Figure 39: Latin America Market Value Share and BPS Analysis by Type, 2026 and 2036
- Figure 40: Latin America Market Y-o-Y Growth Comparison by Type, 2026-2036
- Figure 41: Latin America Market Attractiveness Analysis by Type
- Figure 42: Latin America Market Value Share and BPS Analysis by Application, 2026 and 2036
- Figure 43: Latin America Market Y-o-Y Growth Comparison by Application, 2026-2036
- Figure 44: Latin America Market Attractiveness Analysis by Application
- Figure 45: Latin America Market Value Share and BPS Analysis by Capacity, 2026 and 2036
- Figure 46: Latin America Market Y-o-Y Growth Comparison by Capacity, 2026-2036
- Figure 47: Latin America Market Attractiveness Analysis by Capacity
- Figure 48: Latin America Market Value Share and BPS Analysis by Design, 2026 and 2036
- Figure 49: Latin America Market Y-o-Y Growth Comparison by Design, 2026-2036
- Figure 50: Latin America Market Attractiveness Analysis by Design
- Figure 51: Western Europe Market Value Share and BPS Analysis by Country, 2026 and 2036
- Figure 52: Western Europe Market Value Share and BPS Analysis by Type, 2026 and 2036
- Figure 53: Western Europe Market Y-o-Y Growth Comparison by Type, 2026-2036
- Figure 54: Western Europe Market Attractiveness Analysis by Type
- Figure 55: Western Europe Market Value Share and BPS Analysis by Application, 2026 and 2036
- Figure 56: Western Europe Market Y-o-Y Growth Comparison by Application, 2026-2036
- Figure 57: Western Europe Market Attractiveness Analysis by Application
- Figure 58: Western Europe Market Value Share and BPS Analysis by Capacity, 2026 and 2036
- Figure 59: Western Europe Market Y-o-Y Growth Comparison by Capacity, 2026-2036
- Figure 60: Western Europe Market Attractiveness Analysis by Capacity
- Figure 61: Western Europe Market Value Share and BPS Analysis by Design, 2026 and 2036
- Figure 62: Western Europe Market Y-o-Y Growth Comparison by Design, 2026-2036
- Figure 63: Western Europe Market Attractiveness Analysis by Design
- Figure 64: Eastern Europe Market Value Share and BPS Analysis by Country, 2026 and 2036
- Figure 65: Eastern Europe Market Value Share and BPS Analysis by Type, 2026 and 2036
- Figure 66: Eastern Europe Market Y-o-Y Growth Comparison by Type, 2026-2036
- Figure 67: Eastern Europe Market Attractiveness Analysis by Type
- Figure 68: Eastern Europe Market Value Share and BPS Analysis by Application, 2026 and 2036
- Figure 69: Eastern Europe Market Y-o-Y Growth Comparison by Application, 2026-2036
- Figure 70: Eastern Europe Market Attractiveness Analysis by Application
- Figure 71: Eastern Europe Market Value Share and BPS Analysis by Capacity, 2026 and 2036
- Figure 72: Eastern Europe Market Y-o-Y Growth Comparison by Capacity, 2026-2036
- Figure 73: Eastern Europe Market Attractiveness Analysis by Capacity
- Figure 74: Eastern Europe Market Value Share and BPS Analysis by Design, 2026 and 2036
- Figure 75: Eastern Europe Market Y-o-Y Growth Comparison by Design, 2026-2036
- Figure 76: Eastern Europe Market Attractiveness Analysis by Design
- Figure 77: East Asia Market Value Share and BPS Analysis by Country, 2026 and 2036
- Figure 78: East Asia Market Value Share and BPS Analysis by Type, 2026 and 2036
- Figure 79: East Asia Market Y-o-Y Growth Comparison by Type, 2026-2036
- Figure 80: East Asia Market Attractiveness Analysis by Type
- Figure 81: East Asia Market Value Share and BPS Analysis by Application, 2026 and 2036
- Figure 82: East Asia Market Y-o-Y Growth Comparison by Application, 2026-2036
- Figure 83: East Asia Market Attractiveness Analysis by Application
- Figure 84: East Asia Market Value Share and BPS Analysis by Capacity, 2026 and 2036
- Figure 85: East Asia Market Y-o-Y Growth Comparison by Capacity, 2026-2036
- Figure 86: East Asia Market Attractiveness Analysis by Capacity
- Figure 87: East Asia Market Value Share and BPS Analysis by Design, 2026 and 2036
- Figure 88: East Asia Market Y-o-Y Growth Comparison by Design, 2026-2036
- Figure 89: East Asia Market Attractiveness Analysis by Design
- Figure 90: South Asia and Pacific Market Value Share and BPS Analysis by Country, 2026 and 2036
- Figure 91: South Asia and Pacific Market Value Share and BPS Analysis by Type, 2026 and 2036
- Figure 92: South Asia and Pacific Market Y-o-Y Growth Comparison by Type, 2026-2036
- Figure 93: South Asia and Pacific Market Attractiveness Analysis by Type
- Figure 94: South Asia and Pacific Market Value Share and BPS Analysis by Application, 2026 and 2036
- Figure 95: South Asia and Pacific Market Y-o-Y Growth Comparison by Application, 2026-2036
- Figure 96: South Asia and Pacific Market Attractiveness Analysis by Application
- Figure 97: South Asia and Pacific Market Value Share and BPS Analysis by Capacity, 2026 and 2036
- Figure 98: South Asia and Pacific Market Y-o-Y Growth Comparison by Capacity, 2026-2036
- Figure 99: South Asia and Pacific Market Attractiveness Analysis by Capacity
- Figure 100: South Asia and Pacific Market Value Share and BPS Analysis by Design, 2026 and 2036
- Figure 101: South Asia and Pacific Market Y-o-Y Growth Comparison by Design, 2026-2036
- Figure 102: South Asia and Pacific Market Attractiveness Analysis by Design
- Figure 103: Middle East and Africa Market Value Share and BPS Analysis by Country, 2026 and 2036
- Figure 104: Middle East and Africa Market Value Share and BPS Analysis by Type, 2026 and 2036
- Figure 105: Middle East and Africa Market Y-o-Y Growth Comparison by Type, 2026-2036
- Figure 106: Middle East and Africa Market Attractiveness Analysis by Type
- Figure 107: Middle East and Africa Market Value Share and BPS Analysis by Application, 2026 and 2036
- Figure 108: Middle East and Africa Market Y-o-Y Growth Comparison by Application, 2026-2036
- Figure 109: Middle East and Africa Market Attractiveness Analysis by Application
- Figure 110: Middle East and Africa Market Value Share and BPS Analysis by Capacity, 2026 and 2036
- Figure 111: Middle East and Africa Market Y-o-Y Growth Comparison by Capacity, 2026-2036
- Figure 112: Middle East and Africa Market Attractiveness Analysis by Capacity
- Figure 113: Middle East and Africa Market Value Share and BPS Analysis by Design, 2026 and 2036
- Figure 114: Middle East and Africa Market Y-o-Y Growth Comparison by Design, 2026-2036
- Figure 115: Middle East and Africa Market Attractiveness Analysis by Design
- Figure 116: Global Market - Tier Structure Analysis
- Figure 117: Global Market - Company Share Analysis
Frequently Asked Questions
How large is the crane market in 2026?
The market is estimated at USD 51.2 billion in 2026, compared with USD 49.4 billion in 2025.
What market value is forecast for 2036?
The forecast is USD 72.9 billion in 2036 at a 3.6% CAGR from 2026 to 2036.
Which type category leads in 2026?
The Tower Cranes segment is projected to account for 47.3% of type demand in 2026.
Why does Construction lead its category?
Construction applications involve changing work fronts and competing demands on the lifting schedule.
Which profiled market has the highest forecast growth?
United States has the highest profiled rate at 3.9% CAGR during 2026 to 2036.
Which companies participate in the crane market?
Liebherr Group; Manitowoc Company, Inc.; Tadano Ltd.; Konecranes Plc; Terex Corporation.
Preview the report firsthand - request a free sample
Get SampleGet the brochure for pricing and purchase details.
Get PDF
