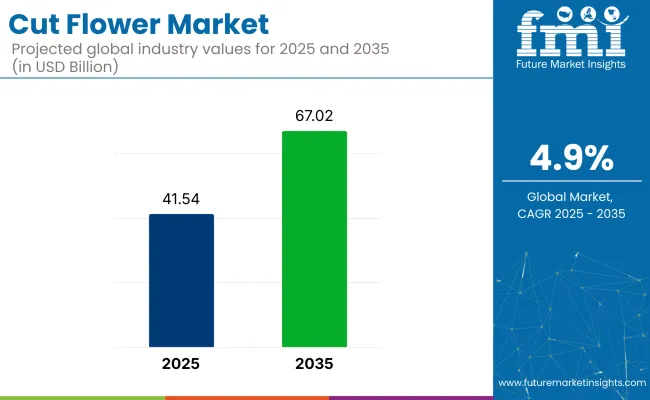
The global cut flower market is forecasted to rise from USD 41.54 billion in 2025 to USD 67.02 billion by 2035, with a CAGR of 4.9% during the forecast period.

| Attributes | Value |
|---|---|
| Industry Value (2025) | USD 41.54 billion |
| Industry Value (2035) | USD 67.02 billion |
| CAGR (2025-2035) | 4.9% |
Growth is being supported by expanding consumer demand for fresh flowers across weddings, retail gifting, and corporate event décor. Cultural and emotional relevance continues to anchor flower purchases, especially for occasions like Valentine's Day, Mother's Day, and festive celebrations.
Higher disposable incomes and wider access to designer floral arrangements have boosted home décor usage and seasonal purchases in both developed and emerging economies.
Cold-chain expansion and real-time supply tracking have allowed cut flowers to reach distant retail destinations more efficiently. As environmental concerns grow, interest in eco-conscious flower farming has increased. Practices such as organic cultivation, water-efficient irrigation, and reduced chemical inputs are being adopted by growers to align with changing buyer values.
A 2025 press release by Ball Horticultural Company, as cited in HortiDaily (March 3, 2025), featured Jim Kennedy, USA Sales Director, stating that “flowers are universal in the way that smiles are universal. It translates into every language.” The statement highlighted the emotional resonance of flowers across cultures and languages, reinforcing their enduring industry appeal.
The industry accounts for approximately 55-60% of the global floriculture industry, making it the dominant subsegment. Within the broader horticulture industry, its share is estimated at around 8-10%, given the inclusion of fruits, vegetables, and landscape plants. In the ornamental plants industry, cut flowers contribute 35-40%, with the remainder driven by potted and bedding plants.
For the global decorative items industry, cut flowers represent about 6-8%, reflecting their use in home décor and gifting. In the event and wedding services industry, cut flowers account for 18-22% of spend, mainly tied to floral arrangements and venue styling. These shares reflect the commercial value of cut flowers in aesthetics-driven industries with cyclical and occasion-based demand patterns.
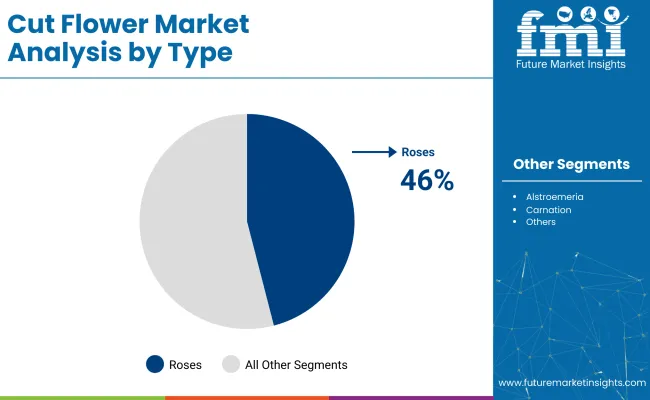
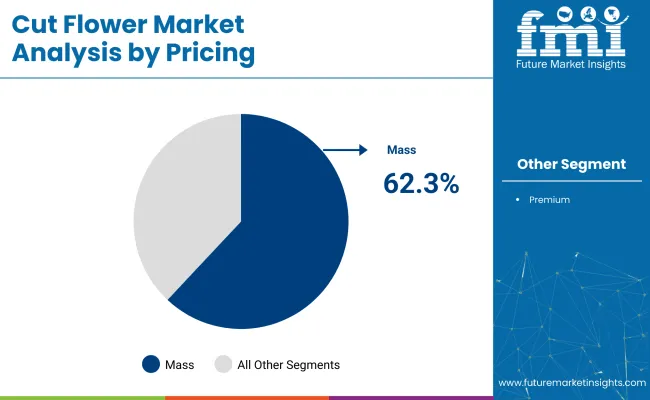
The industry was valued in 2025 and was expected to experience steady expansion through the decade. Sales were structured around four segments flower type, price positioning, application, and distribution channel. Segment-wise shares were recorded at 46% for roses, 62.3% for mass-priced flowers, 27.3% for weddings and cultural events and 27.5% for floriculture store sales.
Rosesare expected to capture a 46% share of total sales in 2025. Sourcing was conducted by major growers, including Floricultura Ecuador, Afriflora Sher, and Black Tulip Group, which managed post-harvest treatments and standardized packaging to meet volume-driven exports.
Retailers such as 1-800-Flowers.com and Interflorafavored roses for seasonal gifting, supported by predictable blooming cycles and high availability. Spray, garden, and preserved rose formats were incorporated into subscription boxes and premium digital assortments by DTC players operating in North America and Europe.

The mass-priced segment accounted for 62.3% of overall cut flower sales in 2025. Budget bouquet lines were supported by global platforms like FloraHolland, Marginpar, and Dümmen Orange, which streamlined grower access to supermarkets and hypermarkets.
Large-scale buyers such as Tesco, Costco, and Aldi structured annual purchase commitments centered on bulk-priced mixed stems. Sourcing favored regions with low-cost labor and climate-stable growing environments, ensuring uninterrupted weekly replenishment at competitive rates. Carton efficiency, stem uniformity, and limited post-harvest touchpoints enabled profitability within this price band.

Wedding and megacultureevent applications were assigned a 27.3% share of total demand in 2025. Floral decorators and service brands such as Fern N Petals, Teleflora, and A Better Florist coordinated volume procurement to serve religious functions, weddings, and public events.
Long-stemmed assortments and regionally symbolic flowerssuch as roses, marigolds, and peonies were pre-booked to ensure delivery alignment with fixed-event timelines. Event-focused floristry continued to influence demand in South and Southeast Asia, as well as select high-value destinations.
Floriculture stores were responsible for 27.5% of total sales in 2025. Companies such as The Bouqs Company, ProFlowers, and Bloomin’ Brands operated brick-and-mortar locations offering customized floral arrangements, event-focused bouquets, and gifting solutions.
Standalone stores served as floral experience hubs where florists managed inventory rotation and theme-based displays. High-margin offerings were built through client-specific consultation, packaging upgrades, and seasonal design sets. Orders for weddings, corporate functions, and holiday gifting were fulfilled through these locations using a mix of imported stems and domestic stock.
Post-harvest losses, freight-linked margin compression, and evolving retail formats were observed as primary forces shaping cut flower supply chains in 2025. Efficiency gains were achieved through investment in cold-chain upgrades, while demand was stabilized through subscription-based models.
Strategic adaptations were undertaken across production, distribution, and retail to address perishability, volatility, and shifting purchase behavior.
Cold Chain Efficiency Was Strengthened to Minimize Stem Spoilage
Spoilage rates were reduced through the adoption of vacuum pre-cooling systems, hydration wraps, and cold storage integration at origin points. Handling improvements were implemented by exporters in Colombia and Kenya, while automated sorting was installed across EU floral auction centers to reduce bundle variance.
Inventory cycles were shortened by Japanese and Dutch importers through timestamped hydration monitoring and pre-conditioned packaging.
Subscription Models Were Used to Drive Consistent Retail Volume
Routine floral purchases were enabled through the expansion of branded subscription services by direct-to-consumer florists. Tiered packages and fixed-date delivery windows were introduced by companies such as The Bouqs Company and Bloom & Wild. Weekday sales were supported through trial placements in wellness aisles at major pharmacy chains.
Inventory variability was reduced as demand was distributed more evenly across calendar weeks.

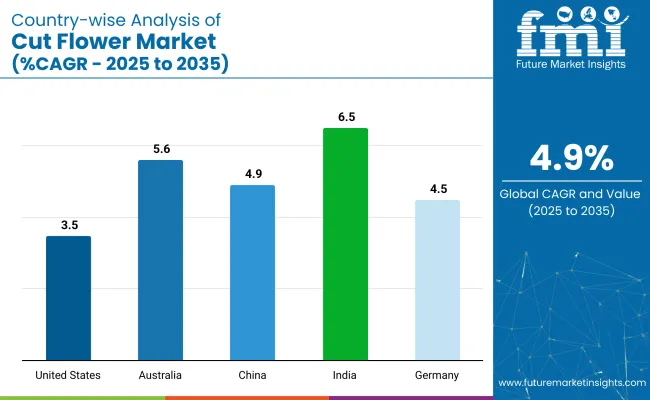
The report covers detailed analysis of 40+ countries, and the top five countries have been shared as a reference.
| Countries | CAGR (2025-2035) |
|---|---|
| United States | 3.5 % |
| Australia | 5.6 % |
| China | 4.9 % |
| India | 6.5 % |
| Germany | 4.5 % |
The global cut flower market is projected to grow at a CAGR of 4.9% from 2025 to 2035. India leads with 6.5%, followed by Australia (5.6%) and China (4.9%), while Germany (4.5%) and the United States (3.5%) post below-average growth. These figures translate to a growth premium of +33% for India and +14% for Australia over the global baseline, with China at parity.
Germany lags by -8%, and the United States trails by -29%. BRICS countries, particularly India and China, are driven by ceremonial demand and protected cultivation. OECD markets like Germany and the USA rely more on floral imports and florist-distributor retail models, while Australia balances native production with scheduled import volumes.
Demand for cut flowers in the United States is set to rise at a 3.5 % CAGR through 2035. More than three-quarters of stems are sourced through imports from Colombia and Ecuador, while domestic production in California and Florida has continued to decline due to labor and input constraints.
Retail demand in the industry is fulfilled through shelf-ready bouquets placed in grocery and pharmacy stores, catering to steady weekday sales. Compared to the industry in India, which is structured around religious events and weddings, the U.S. market remains shaped by compliance costs, freight variability, and limited greenhouse resilience.
Cut flower sales in Australia are expected to increase at a CAGR of 5.6% through 2035. Native and tropical varieties are cultivated under contract farming, while seasonal gaps are filled through air imports from Kenya, Ecuador, and the Netherlands.
Cold-chain capacity at Melbourne and Brisbane airports extends shelf life, offering an edge over the cut flower industry in India, where mandi-based networks remain dominant. Biosecurity screening protocols have filtered non-compliant floral imports, shaping SKU selection differently than China’s domestic supply model.
The cut flower demand in China is forecast to grow at a 4.9 % CAGR through 2035. Yunnan province continues to supply more than 60 % of domestic stems, supported by logistics hubs in Shanghai and Shenzhen. Subscription-based floral demand has been structured through digital platforms in cities.
The market in China differs from the U.S. and German industries by emphasizing bundled volume and limited import dependency. Institutional gifting, décor, and corporate programs have supported baseline volume outside national holidays.
India is expected to post the highest flower uptake, growing at a 6.5% CAGR through 2035,leading all other profiled countries. Polyhouse cultivation has expanded in Karnataka, Tamil Nadu, and West Bengal, driven by government incentives.
Domestic demand for the floral cuttings market is anchored in religious and ceremonial use, distinguishing it from the export-reliant floral cuttings market in Germany. APEDA-certified export units in Andhra Pradesh and Maharashtra have handled outbound volumes of roses and marigolds, while intra-state demand is met via mandis and short-haul refrigerated trucks.
The requirement for cut flowers in Germany is anticipated to increase at a 4.5 % CAGR through 2035. Imports routed via Dutch auctions account for over 70 % of domestic availability. Retail sourcing in the floral cuttings market relies on traceability, pesticide thresholds, and low-energy handling, setting it apart from the volume-oriented floral cuttings market in China.
Domestic greenhouse output has remained concentrated in North Rhine-Westphalia for specialty florists and institutional contracts. Compliance with EU labeling standards shapes rotation and product flow more than price elasticity.
The industry is structured through region-based cultivation, centralized auction systems, and diversified retail access. Competitive positioning is determined by freshness retention, stem durability, and logistics compliance. Over 500 hectares of rose farms have been operated in Ethiopia by Afriflora Sher, with volumes exported to EU auctions. floral cuttings genetics have been supplied to more than 70 countries through Dümmen Orange, headquartered in the Netherlands. Long-stem roses have been shipped from Ecuador by Floricultura to buyers in Europe and North America.
Altitude-grown stems have been sourced by Marginpar Group from Kenya and Ethiopia. In the retail segment, U.S. home delivery has been managed by The Bouqs Company, while global florist coordination has been overseen by Interflora.
Recent Industry News
| Report Attributes | Details |
|---|---|
| Industry Size (2025) | USD 41.54 billion |
| Projected Industry Size (2035) | USD 67.02 billion |
| CAGR (2025 to 2035) | 4.9% |
| Base Year for Estimation | 2024 |
| Historical Period | 2020 to 2024 |
| Projections Period | 2025 to 2035 |
| Quantitative Units | USD billion for value and billion stems for volume |
| Types Analyzed (Segment 1) | Alstroemeria, Roses, Bird of Paradise, Carnation, Lavender, Lilies, Sunflower, Others |
| Pricing Models Analyzed (Segment 2) | Mass Pricing, Premium Pricing |
| Applications Analyzed (Segment 3) | Personal Use, Parties & Special Days, Wedding & Mega Cultural Events, Welcoming & Greeting, Conference & Activities, Others |
| Distribution Channels Analyzed (Segment 4) | Direct Sales, Retail Stores (Floriculture Stores, Specialty Stores, Others) |
| Regions Covered | North America, Latin America, Western Europe, Eastern Europe, South Asia & Pacific, East Asia, Middle East & Africa |
| Countries Covered | United States, Canada, Mexico, Brazil, Germany, United Kingdom, France, Italy, Spain, Netherlands, China, India, Japan, South Korea, Australia, South Africa, Kenya, UAE, Saudi Arabia |
| Key Players | Ball Horticultural Company, Carzan Flowers K Ltd., Karen Roses, Karuturi Global Limited, Oserian Development Company Limited, Rosebud Ltd., Syngenta Flowers Inc., The Kariki Group, The Queen's Flowers, Washington Bulb Co., Inc. |
| Additional Attributes | Dollar sales, share by flower type and application, growing demand for roses in premium pricing tiers, expansion of online floriculture channels, seasonal trends in wedding and cultural event-based purchasing |
The segmentation includes alstroemeria, roses, bird of paradise, carnation, lavender, lilies, sunflower, and others.
The segmentation includes mass pricing and premium pricing.
The segmentation includes personal use, parties and special days, wedding and mega cultural events, welcoming and greeting, conference and activities, and others.
The segmentation includes direct sales and retail stores; retail stores are further segmented into floriculture stores, specialty stores, and others.
The segmentation includes North America, Latin America, Western Europe, Eastern Europe, South Asia and Pacific, East Asia, and Middle East and Africa.
The industry is valued at USD 41.54 billion in 2025.
Roses dominate the industry in 2025, capturing 46% of total sales.
The industry is projected to grow at a CAGR of 4.9% from 2025 to 2035.
India is the fastest-growing country with a CAGR of 6.5%.
Wedding and mega cultural events are projected to lead the industry with 27.3% share.


Our Research Products

The "Full Research Suite" delivers actionable market intel, deep dives on markets or technologies, so clients act faster, cut risk, and unlock growth.

The Leaderboard benchmarks and ranks top vendors, classifying them as Established Leaders, Leading Challengers, or Disruptors & Challengers.

Locates where complements amplify value and substitutes erode it, forecasting net impact by horizon

We deliver granular, decision-grade intel: market sizing, 5-year forecasts, pricing, adoption, usage, revenue, and operational KPIs—plus competitor tracking, regulation, and value chains—across 60 countries broadly.

Spot the shifts before they hit your P&L. We track inflection points, adoption curves, pricing moves, and ecosystem plays to show where demand is heading, why it is changing, and what to do next across high-growth markets and disruptive tech

Real-time reads of user behavior. We track shifting priorities, perceptions of today’s and next-gen services, and provider experience, then pace how fast tech moves from trial to adoption, blending buyer, consumer, and channel inputs with social signals (#WhySwitch, #UX).

Partner with our analyst team to build a custom report designed around your business priorities. From analysing market trends to assessing competitors or crafting bespoke datasets, we tailor insights to your needs.
Supplier Intelligence
Discovery & Profiling
Capacity & Footprint
Performance & Risk
Compliance & Governance
Commercial Readiness
Who Supplies Whom
Scorecards & Shortlists
Playbooks & Docs
Category Intelligence
Definition & Scope
Demand & Use Cases
Cost Drivers
Market Structure
Supply Chain Map
Trade & Policy
Operating Norms
Deliverables
Buyer Intelligence
Account Basics
Spend & Scope
Procurement Model
Vendor Requirements
Terms & Policies
Entry Strategy
Pain Points & Triggers
Outputs
Pricing Analysis
Benchmarks
Trends
Should-Cost
Indexation
Landed Cost
Commercial Terms
Deliverables
Brand Analysis
Positioning & Value Prop
Share & Presence
Customer Evidence
Go-to-Market
Digital & Reputation
Compliance & Trust
KPIs & Gaps
Outputs
Full Research Suite comprises of:
Market outlook & trends analysis
Interviews & case studies
Strategic recommendations
Vendor profiles & capabilities analysis
5-year forecasts
8 regions and 60+ country-level data splits
Market segment data splits
12 months of continuous data updates
DELIVERED AS:
PDF EXCEL ONLINE
Industry Share Analysis for Cut Flower Companies
Flower Box Market Size and Share Forecast Outlook 2025 to 2035
Cutting Tool Packaging Market Size and Share Forecast Outlook 2025 to 2035
Cutting Boards Market Size and Share Forecast Outlook 2025 to 2035
Cut And Stack Labels Market Size and Share Forecast Outlook 2025 to 2035
Cutting and Bending Machine Market Size and Share Forecast Outlook 2025 to 2035
Cutting Balloons Market Insights – Growth, Demand & Forecast 2025 to 2035
Flower Extract Market Analysis by Type, Application and Form Through 2035
Cutting Fluid Market Growth – Trends & Forecast 2025-2035
Cutter Box Films Market Growth – Demand & Trends Forecast 2025-2035
Cutlery Market Growth – Trends & Demand Forecast 2025-2035
Market Share Distribution Among Cut and Stack Labels Providers
Cutaneous T-cell Lymphoma (CTLC) Market
Cutter-Box Packaging Market
Cutaneous Radiation Injury Treatment Market
Acute Kidney Injury Treatment Market Growth - Trends & Forecast 2025 to 2035
Acute Migraine Treatment Market Trends – Analysis & Forecast 2024-2034
Executive Coaching Certification Market Size and Share Forecast Outlook 2025 to 2035
Subcutaneous Implantable Defibrillator System Market Size and Share Forecast Outlook 2025 to 2035
Sunflower Seed Market Size and Share Forecast Outlook 2025 to 2035

Thank you!
You will receive an email from our Business Development Manager. Please be sure to check your SPAM/JUNK folder too.
Chat With
MaRIA