The global dewatering box market records a size of USD 123.9 million in 2025 and reaches USD 188.7 million by 2035, reflecting a CAGR of 4.3%. Growth momentum is shaped by the increasing use of dewatering solutions across wastewater treatment, construction, and food processing industries. In the early phase of expansion between 2025 and 2029, momentum is driven by rising infrastructure investments, stricter regulations on sludge management, and the demand for efficient, mobile solutions. Manufacturers introducing reinforced designs with higher load-bearing capacity and easy maintenance options gain competitive strength, contributing to an upward trajectory. This period reflects the acceleration stage where new installations and replacements in industrial facilities provide strong contributions.
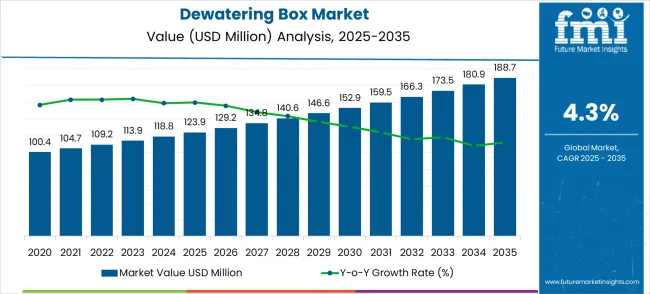
From 2030 to 2035, momentum transitions into a steadier phase as adoption broadens across both developed and developing regions. Market players focusing on modular construction, customizable features, and environmentally efficient handling systems maintain steady growth levels while reducing risks of share erosion. Incremental improvements in cost-effectiveness and operational safety allow suppliers to strengthen their foothold. By 2035, the market secures an absolute increase of USD 64.8 million, demonstrating long-term stability. The analysis of growth momentum highlights how early acceleration through regulatory compliance and infrastructure expansion evolves into steady demand supported by technological advancement, ensuring continuous value creation for the dewatering box market across the decade.
| Metric | Value |
|---|---|
| Estimated Value in (2025E) | USD 123.9 million |
| Forecast Value in (2035F) | USD 188.7 million |
| Forecast CAGR (2025 to 2035) | 4.3% |
Trends in the dewatering box market include design innovations for higher capacity, faster drainage, and reduced operational downtime. Manufacturers are incorporating reinforced steel structures and advanced liner systems to extend service life. Integration of IoT-enabled monitoring tools is improving oversight of water recovery, sludge levels, and maintenance schedules. The dewatering box market is divided into municipal wastewater treatment at 35%, construction and excavation at 28%, oil and gas operations at 16%, industrial manufacturing at 12%, and food processing waste management at 9%. Municipal facilities drive the largest share as dewatering boxes are widely used to handle sludge and comply with discharge regulations.
Construction projects rely on them for efficient removal of groundwater and slurry during excavation. Oil and gas operations adopt boxes to separate drilling mud and recover usable fluids. Industrial plants use them for by-product handling and water recycling, while food processors employ dewatering boxes for waste reduction and improved efficiency. Expansion into oil and gas, food processing, and large-scale municipal projects is widening demand. Rental services for dewatering boxes are also gaining traction among contractors seeking cost-effective solutions. Strategic partnerships between equipment providers and environmental service companies are supporting tailored designs. Rising focus on efficient water removal, waste minimization, and compliance with environmental standards is accelerating adoption worldwide.
The dewatering box market presents a compelling growth story driven by escalating industrial water treatment demands, stringent environmental regulations, and infrastructure modernization across developed and emerging economies. With the global market expanding from USD 123.9 million in 2025 to USD 188.7 million by 2035 at a 4.3% CAGR, strategic opportunities emerge across technology innovation, geographic expansion, and application diversification. The convergence of eco mandates, operational efficiency requirements, and smart automation adoption creates multiple pathways for value creation in this essential industrial equipment sector.
Municipal wastewater treatment's dominant 46.9% market share, coupled with rapid growth in Asia-Pacific markets (China at 5.8% CAGR, India at 5.4%), signals robust demand for reliable, cost-effective solid-liquid separation solutions. The transition from traditional gravity systems toward automated, energy-efficient technologies opens premium positioning opportunities, while expanding applications in mining, pharmaceuticals, and food processing diversify revenue streams beyond core municipal markets.
Market expansion is being supported by the increasing global demand for efficient water management solutions and the corresponding need for reliable dewatering systems that can handle diverse waste streams while maintaining consistent performance across various industrial applications. Modern industrial facilities are increasingly focused on implementing water treatment solutions that can reduce waste disposal costs, minimize environmental impact, and provide consistent quality in processed water discharge. Dewatering boxes' proven ability to deliver efficient solid-liquid separation, reduced waste volume, and versatile operational capabilities make them essential equipment for contemporary industrial water management and waste processing solutions.
The growing attention on environmental compliance and green manufacturing practices is driving demand for dewatering boxes that can support regulatory requirements, reduce waste disposal costs, and enable efficient resource recovery from industrial waste streams. Industrial processors' preference for equipment that combines operational efficiency with environmental benefits and cost-effectiveness is creating opportunities for innovative dewatering implementations. The rising influence of circular economy principles and resource recovery demands is also contributing to increased adoption of dewatering boxes that can provide efficient separation solutions without excessive energy consumption or maintenance requirements.
The dewatering box market is witnessing steady growth, driven by the demand for efficient liquid-solid separation systems across industrial and municipal sectors. Gravity sedimentation type technology leads the segment with a 39% market share, while mechanical filter press and other technologies account for the remaining share. In terms of application, wastewater treatment and municipal engineering dominate with a 46.9% share, followed by mining and metallurgy, food and pharmaceuticals, and other industries. These segments represent the primary areas for investment, reflecting widespread adoption and consistent demand for reliable dewatering solutions that enhance operational efficiency and environmental compliance.
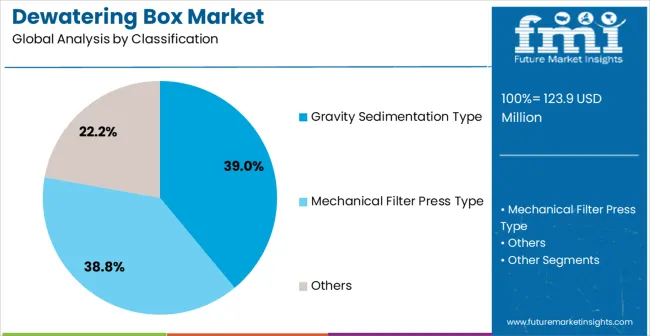
Gravity sedimentation type dewatering boxes, holding a 39% share of the technology segment, are preferred for their simplicity, cost-effectiveness, and low maintenance requirements. They are widely used in municipal wastewater treatment, low-to-medium solids separation, and industrial effluent management. Key manufacturers include Alfa Laval, Veolia, ANDRITZ, and GEA Group. Gravity sedimentation boxes offer low energy consumption and ease of operation, making them suitable for long-term use in municipal and industrial applications. Their reliability and proven performance continue to drive adoption in facilities seeking efficient, low-cost dewatering solutions.
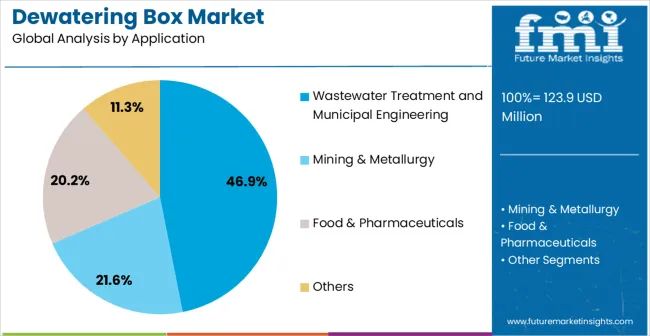
Wastewater treatment and municipal engineering applications hold a 46.9% share of the market, making it the largest segment. Dewatering boxes in this sector are essential for processing municipal sludge, industrial effluent, and other liquid-solid waste, enhancing operational efficiency and compliance with environmental standards. Leading suppliers such as Alfa Laval, Veolia, ANDRITZ, and GEA Group offer solutions optimized for high reliability and integration into existing treatment plants. Expansion of municipal infrastructure, stricter regulations, and increasing demand for efficient waste handling are driving the segment’s growth, establishing it as the focal point for market investment.
The dewatering box market is expanding as industries adopt practical equipment for separating liquid from solid waste. These boxes are widely used in wastewater treatment, construction, and mining to manage sludge and reduce disposal volume. Their portability and high holding capacity make them valuable in both large-scale projects and smaller operations. Rising waste generation and tighter rules on waste handling are reinforcing demand. While purchase and rental costs remain a challenge, innovation in design and materials is supporting broader acceptance across diverse industrial settings.
The rise in waste production from construction, mining, and wastewater treatment plants is fueling demand for dewatering boxes. These units reduce water content in sludge, lowering transport and disposal costs while improving efficiency. Their mobility enables use across multiple job sites, offering flexibility to contractors and service providers. Stricter compliance requirements for liquid waste handling are also boosting adoption. Infrastructure development in both developed and developing economies further supports growth, as projects generate significant wastewater that must be processed effectively. Manufacturers are improving durability with corrosion-resistant designs, larger capacities, and better sealing systems. Together, these factors highlight the growing importance of dewatering boxes as reliable, flexible tools for managing liquid and solid waste efficiently across industries.
Despite increasing demand, the dewatering box market faces barriers related to cost and operation. The price of new units can be prohibitive for smaller businesses, leading many to consider rentals rather than purchases. Maintenance adds to expenses, as liners, seals, and screens require periodic replacement. Space requirements also create issues in urban or restricted areas where large equipment is difficult to position. The type of waste being processed can affect performance, sometimes requiring tailored solutions that raise costs further. Limited awareness and operator training in certain regions slow down adoption as well. To address these challenges, manufacturers and service providers are offering modular designs, portable options, and flexible rental models to encourage use among a broader customer base.
Current trends in the dewatering box market focus efficiency, portability, and environmental responsibility. More service providers are introducing boxes with improved liners and drainage systems to speed up liquid separation. Demand for portable and modular designs is growing, particularly in projects where space or mobility is important. The market is also seeing interest in automation and monitoring tools that allow operators to track performance and reduce manual oversight. Durability improvements, such as corrosion-resistant finishes and reinforced frames, are extending product life and lowering long-term costs. Rental services are expanding, meeting short-term needs for contractors and municipalities. These developments point toward a market increasingly shaped by flexible designs, smarter operation, and solutions that align with evolving waste management practices across industries.
| Country | CAGR (2025-2035) |
|---|---|
| China | 5.8% |
| India | 5.4% |
| Germany | 4.9% |
| Brazil | 4.5% |
| USA | 4.1% |
| UK | 3.7% |
| Japan | 3.2% |
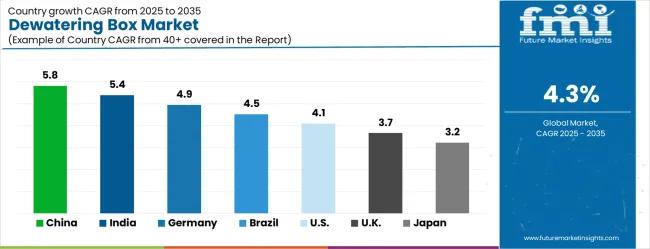
The global dewatering box industry is advancing at a CAGR of 4.3%, equal to a multiplication factor of 1.43 over the forecast period. China leads at 5.8% (1.76x), 1.5 points above the global average, driven by industrial expansion and large-scale waste treatment projects. India follows at 5.4% (1.71x), 1.1 points above the global rate, supported by urban development and stronger waste management systems, both part of the BRICS group along with Brazil, which records 4.5% (1.56x), slightly above global growth due to expanding environmental infrastructure. Germany grows at 4.9% (1.65x), 0.6 points above the global average, reflecting advanced European waste processing practices. The USA shows 4.1% (1.52x), slightly below global growth, while the UK at 3.7% (1.44x) and Japan at 3.2% (1.38x) lag behind. ASEAN and Oceania countries adopt these systems at 4-5% (1.44-1.56x), influenced by rising urban waste handling and environmental regulations.
The report covers an in-depth analysis of 40+ countries, top-performing countries are highlighted below.
China leads the Dewatering Box market with a projected CAGR of 5.8%, surpassing the global rate of 4.3%. Industrial wastewater, mining, and municipal waste management are the main growth drivers. Provinces such as Guangdong, Jiangsu, and Shandong dominate installations due to their concentration of manufacturing units and construction projects. International manufacturers like Veolia and GEA Group continue to strengthen their presence by working with local partners to introduce automated, high-capacity dewatering solutions. Modular box systems are increasingly favored for their portability and efficiency. Strong regulatory push on wastewater control is expected to enhance market penetration across both municipal and industrial sectors.
India accounts for 5.4% CAGR in the Dewatering Box market, positioning it among the fastest-growing regions. Adoption is fueled by demand from textile, food, and chemical industries along with municipal wastewater treatment facilities. Cities including Delhi, Mumbai, and Chennai lead installations due to higher industrial concentration. Veolia and local suppliers are delivering mobile and automated dewatering solutions tailored to varied industries. Compact designs are preferred in urban plants, while larger box systems are utilized in industrial clusters. Regulatory efforts for wastewater recycling continue to support adoption across both urban and semi-urban regions.
Germany records a CAGR of 4.9% in the Dewatering Box market, supported by strict EU environmental regulations and established industrial activity. States such as Bavaria and North Rhine-Westphalia are the key adoption hubs, accounting for over half of demand. Leading providers like GEA Group and Veolia are integrating automated systems into municipal and industrial facilities. Demand is particularly strong in food, beverage, and chemical sectors where compliance with wastewater guidelines is crucial. Compact, high-capacity boxes are increasingly used in recycling plants, providing enhanced efficiency and reducing labor intensity.
Brazil maintains a CAGR of 4.5% in the Dewatering Box market, with demand led by municipal treatment plants, agriculture, and food processing industries. São Paulo and Rio de Janeiro account for the highest adoption levels due to urban density and industrial growth. International suppliers are entering partnerships with domestic firms to introduce modular and automated systems. Growing investments in bioenergy and recycling initiatives are contributing to the demand. Compact and mobile boxes are especially preferred by smaller facilities aiming to optimize waste handling.
The United States records a CAGR of 4.1% in the Dewatering Box market, largely supported by industrial wastewater facilities, construction projects, and municipal treatment plants. States such as California, Texas, and New York dominate installations with strong demand from construction and infrastructure projects. Companies like Veolia are enhancing automated dewatering box technology to provide cost-effective solutions. Modular designs are being widely adopted to optimize limited space in urban plants. Recycling operations and energy recovery projects are expected to keep demand steady through the forecast period.
The United Kingdom posts a CAGR of 3.7% in the Dewatering Box market, driven by industrial and municipal applications. London, Manchester, and Birmingham remain the primary hubs for adoption due to manufacturing activity and high-density populations. Veolia and GEA Group supply compact, automated systems suited for smaller treatment centers and industrial plants. Food and paper industries account for significant adoption, where wastewater compliance is mandatory. Mobile and modular designs are increasingly preferred as facilities seek faster deployment and reduced operational downtime.
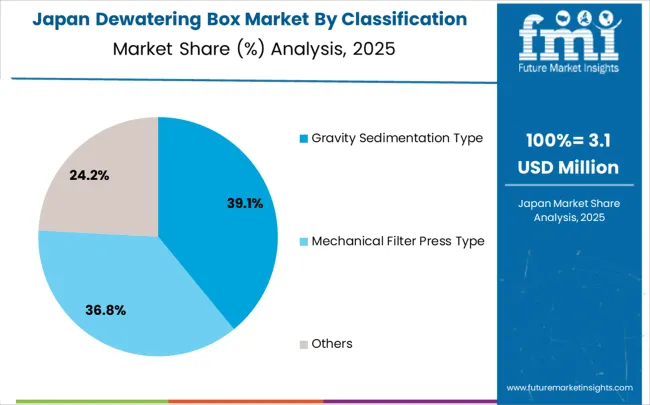
Japan maintains a CAGR of 3.2% in the Dewatering Box market, below the global average. Tokyo, Osaka, and Nagoya are the strongest markets, accounting for nearly half of installations. Growing adoption is seen in municipal treatment plants and industrial sites where compact, automated boxes are replacing traditional systems. Global suppliers are tailoring solutions for space-constrained facilities in dense cities. Recycling and chemical industries are emerging as important application areas. Demand for compact and mobile boxes continues to rise due to the need for flexible, space-saving designs.
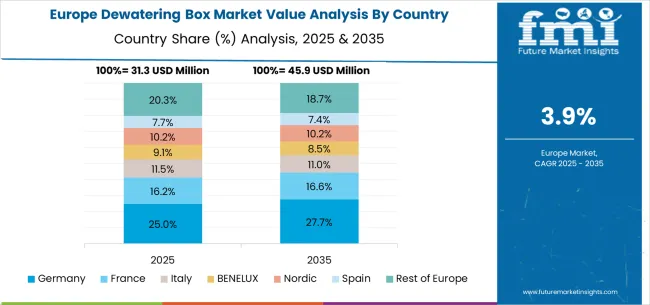
The dewatering box market in Europe is projected to grow from USD 31.3 million in 2025 to USD 45.9 million by 2035, registering a CAGR of 3.9% over the forecast period. Germany is expected to remain the largest national market with 25.0% share in 2025, rising to 27.7% by 2035, supported by its strong industrial base, advanced water treatment infrastructure, and comprehensive environmental compliance requirements. The United Kingdom follows with 16.2% in 2025, edging up to 16.6% by 2035 as industrial modernization and waste management practices expand. France accounts for 11.5% in 2025, softening to 10.6% by 2035, reflecting steady adoption across environmental and industrial applications.
Italy holds 10.2% in 2025, easing to 9.5% by 2035, while Spain represents 11.0% in 2025, moderating slightly to 10.6% by 2035, supported by industrial water treatment facility upgrades. BENELUX countries contribute 9.8% in 2025, dipping to 9.2% by 2035, while the Nordic region accounts for 7.7% in 2025, remaining near 7.4% by 2035, reflecting maturity in sustainable water management adoption. The rest of Europe (Eastern Europe and other emerging markets) collectively accounts for 20.3% in 2025, easing to 18.7% by 2035, supported by growing adoption of advanced dewatering solutions in emerging industrial hubs.
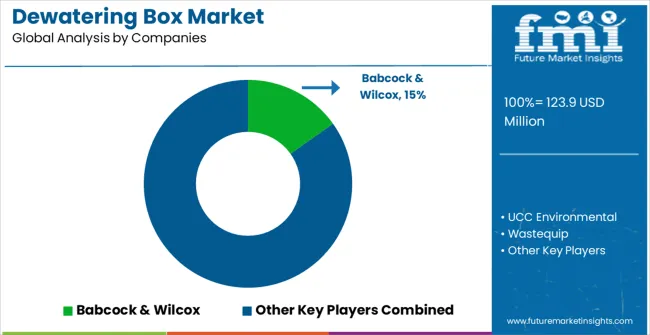
The dewatering box market is shaped by performance, durability, and operational efficiency. Leading companies include Babcock & Wilcox, UCC Environmental, Wastequip, Ironclad Environmental, ParkUSA under ParkProcess, Con-Fab, Spectrum Water Technology, DumpsterLiners, Morrow Water Technologies, and E-Pak Manufacturing. Competition focuses on structural strength, drainage efficiency, and ease of maintenance. Buyers prioritize units that handle high solids, resist leakage, and maintain consistent operation under heavy use. Longevity and low downtime define product value.
UCC Environmental designs boxes with center dewatering elements, wear-resistant plates, and fast-discharge gates. Wastequip features perforated walls, gasketed doors, and modular liners for various waste streams. Spectrum Water Technology prioritize transport-ready units with high solids retention and minimal handling requirements. Babcock & Wilcox produces heavy-duty boxes for industrial applications. ParkProcess provides skid-mounted systems for flexible deployment. Con-Fab and E-Pak Manufacturing focus on strong fabrication and custom sizing. DumpsterLiners and Morrow Water Technologies deliver accessories and service solutions to simplify on-site operations. Products are positioned to improve workflow efficiency while meeting site regulations.
Brochures highlight capacity in cubic yards, steel gauge, gate mechanisms, drainage design, and corrosion resistance. Safety features, liner compatibility, and unloading procedures are detailed. Product performance is prioritized alongside maintenance simplicity and operational reliability. Competitive advantage is achieved through engineering design, reinforced structures, and ease of handling. Support services, fast delivery, and availability of replacement components are stressed. Market differentiation relies on quality, adaptability, and functional versatility rather than pricing.
| Items | Values |
|---|---|
| Quantitative Units (2025) | USD 123.9 million |
| Technology Type | Gravity Sedimentation Type, Mechanical Filter Press Type, Others |
| Application | Wastewater Treatment and Municipal Engineering, Mining & Metallurgy, Food & Pharmaceuticals, Others |
| Regions Covered | North America, Europe, East Asia, South Asia & Pacific, Latin America, Middle East & Africa |
| Countries Covered | United States, Canada, United Kingdom, Germany, France, China, Japan, South Korea, India, Brazil, Australia and 40+ countries |
| Key Companies Profiled | Babcock & Wilcox, UCC Environmental, Wastequip, Ironclad Environmental, ParkUSA (ParkProcess), Con-Fab, Spectrum Water Technology, DumpsterLiners, Morrow Water Technologies (ParkProcess), and E-Pak Manufacturing |
| Additional Attributes | Dollar sales by technology type and application category, regional demand trends, competitive landscape, technological advancements in dewatering systems, automation innovation, energy efficiency development, and operational optimization |
The global dewatering box market is estimated to be valued at USD 123.9 million in 2025.
The market size for the dewatering box market is projected to reach USD 188.7 million by 2035.
The dewatering box market is expected to grow at a 4.3% CAGR between 2025 and 2035.
The key product types in dewatering box market are gravity sedimentation type, mechanical filter press type and others.
In terms of application, wastewater treatment and municipal engineering segment to command 46.9% share in the dewatering box market in 2025.


Our Research Products

The "Full Research Suite" delivers actionable market intel, deep dives on markets or technologies, so clients act faster, cut risk, and unlock growth.

The Leaderboard benchmarks and ranks top vendors, classifying them as Established Leaders, Leading Challengers, or Disruptors & Challengers.

Locates where complements amplify value and substitutes erode it, forecasting net impact by horizon

We deliver granular, decision-grade intel: market sizing, 5-year forecasts, pricing, adoption, usage, revenue, and operational KPIs—plus competitor tracking, regulation, and value chains—across 60 countries broadly.

Spot the shifts before they hit your P&L. We track inflection points, adoption curves, pricing moves, and ecosystem plays to show where demand is heading, why it is changing, and what to do next across high-growth markets and disruptive tech

Real-time reads of user behavior. We track shifting priorities, perceptions of today’s and next-gen services, and provider experience, then pace how fast tech moves from trial to adoption, blending buyer, consumer, and channel inputs with social signals (#WhySwitch, #UX).

Partner with our analyst team to build a custom report designed around your business priorities. From analysing market trends to assessing competitors or crafting bespoke datasets, we tailor insights to your needs.
Supplier Intelligence
Discovery & Profiling
Capacity & Footprint
Performance & Risk
Compliance & Governance
Commercial Readiness
Who Supplies Whom
Scorecards & Shortlists
Playbooks & Docs
Category Intelligence
Definition & Scope
Demand & Use Cases
Cost Drivers
Market Structure
Supply Chain Map
Trade & Policy
Operating Norms
Deliverables
Buyer Intelligence
Account Basics
Spend & Scope
Procurement Model
Vendor Requirements
Terms & Policies
Entry Strategy
Pain Points & Triggers
Outputs
Pricing Analysis
Benchmarks
Trends
Should-Cost
Indexation
Landed Cost
Commercial Terms
Deliverables
Brand Analysis
Positioning & Value Prop
Share & Presence
Customer Evidence
Go-to-Market
Digital & Reputation
Compliance & Trust
KPIs & Gaps
Outputs
Full Research Suite comprises of:
Market outlook & trends analysis
Interviews & case studies
Strategic recommendations
Vendor profiles & capabilities analysis
5-year forecasts
8 regions and 60+ country-level data splits
Market segment data splits
12 months of continuous data updates
DELIVERED AS:
PDF EXCEL ONLINE
Box Liners Market Size and Share Forecast Outlook 2025 to 2035
Boxboard Packaging Market Analysis - Size, Share, and Forecast Outlook 2025 to 2035
Dewatering Pump Market Size and Share Forecast Outlook 2025 to 2035
Dewatering Bin Market Size and Share Forecast Outlook 2025 to 2035
Dewatering Liner Market Analysis - Size and Share Forecast Outlook 2025 to 2035
Box Compression Tester Market Size and Share Forecast Outlook 2025 to 2035
Box Latch Market Size and Share Forecast Outlook 2025 to 2035
Box Pouch Market by Pouch Type from 2025 to 2035
Box Filling Machine Market from 2025 to 2035
Box and Carton Overwrap Films Market Demand and Growth
Box and Carton Overwrapping Machines Market Insights and Growth 2025 to 2035
Boxcar Scars Market – Demand, Growth & Forecast 2025 to 2035
Box Sealing Machines Market Trends – Growth & Forecast 2025 to 2035
Competitive Breakdown of Box Pouch Providers
Market Share Insights of Boxboard Packaging Providers
Box Latch Market Positioning & Competitive Analysis
Industry Share Analysis for Box Liners Companies
Market Share Breakdown of Dewatering Pump Manufacturers
Carboxymethyl Tamarind Kernel Powder Market Size and Share Forecast Outlook 2025 to 2035
Carboxymethyl Tamarind Gum (CMT) Market Size and Share Forecast Outlook 2025 to 2035

Thank you!
You will receive an email from our Business Development Manager. Please be sure to check your SPAM/JUNK folder too.
Chat With
MaRIA