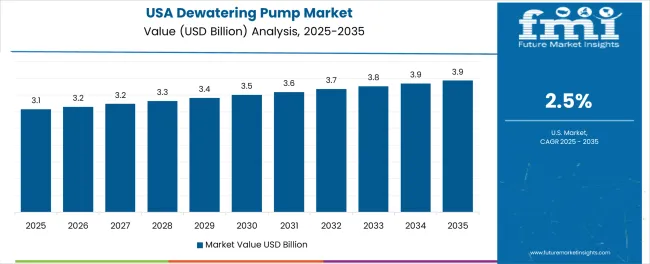
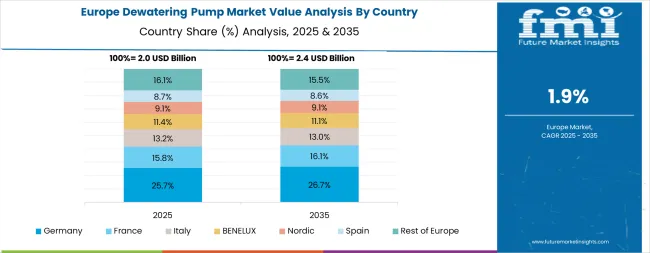
Dewatering Pumps Market
Market Insights on Dewatering Pumps covering sales outlook, demand forecast & up-to-date key trends
Dewatering Pumps Market by Product Type (Sludge Pumps, Slurry Pumps, Drainage Pumps, Hybrid Pumps), Technology (Positive Displacement Type, Centrifugal Type), End Use (Civic Infrastructure Construction, Mining & Metals, Paper & Pulp, Chemicals, Power Generation) & Region - Forecast 2022 - 2028
Dewatering Pumps Market Outlook – 2022-2028
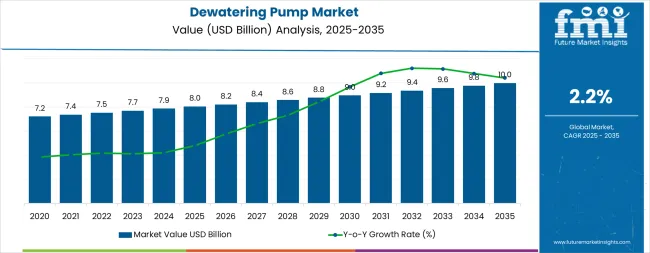
[337 Pages] The dewatering pumps market is expected to grow at year-on-year rate of 5.3%, reaching a value of about US$ 6.9 Bn by 2022.
Dewatering Pumps Market Base Year Value (2021A) |
US$ 6.6 Bn |
Dewatering Pumps Market Estimated Year Value (2022E) |
US$ 6.9 Bn |
Dewatering Pumps Market Projected Year Value (2028F) |
US$ 9.5 Bn |
Value CAGR (2022-2028) |
5.3% |
Collective Value Share: Top 3 Countries (2022E) |
34% |
The global dewatering pumps market is primarily driven by robust demand from ongoing infrastructure projects. Future Market Insights (FMI) has projected the market to register a CAGR of 5.3% by value during the period of 2022 and 2028.
North America is expected to dominate global dewatering pumps market in terms of revenue in 2022 and is anticipated to grow at a CAGR of 4.7% by value over the forecast period.
Let us know your requirement to get
100% FREE customization
How The Market Progressed Till June 2022?
Market Statistics |
Details |
H1,2021 (A) |
5.1% |
H1,2022 Projected (P) |
5.3% |
H1,2022 Outlook (O) |
5.4% |
BPS Change : H1,2022 (O) - H1,2022 (P) |
(+) 25 ↑ |
BPS Change : H1,2022 (O) - H1,2021 (A) |
(+) 9 ↑ |
Future Market Insights predict a comparison and review study for the dynamics of the dewatering pumps market, which is primarily influenced by residential complex expansion, industrialization, and the mining industry. Increasing hydraulic fracturing production to support oil and gas operations will create a favorable climate for market expansion.
According to FMI analysis, the change in BPS values observed in the market for dewatering pumps in H1, 2022 - Outlook for H1, 2022 The projected rise is based on a 9-unit increase. In comparison to H1-2021, the market is predicted to rise by 25 basis points in H1-2022.
The constant uptake of the market during the first half of the projection period is due to the key causes for this shift in the growth rate. Factors such as increasing oil shipments, rising natural gas exports, and steady fuel flows will also have a beneficial impact on the dewatering pumps market.
Despite these advantages, dewatering pumps are prone to corrosion. With time, the seals might deteriorate, allowing water to flow into the motor and raising maintenance costs.
2022-2028 Dewatering Pumps Market Outlook in Comparison to Growth Registered in 2017-2021
With the expansion of residential complexes, industrialisation, and the mining sector, the need for dewatering pumps is increasing. Dewatering pumps are typically used to remove excess of water from construction and mining sites.
They are transportable equipment that are commonly used in subsurface excavation for foundations and basement space building, and are positioned at construction sites with lower ground levels to manage and maintain groundwater levels.
Various industries, particularly oil & gas, power and chemicals are investing in refurbishment of their plants and pumping systems in order to increase production efficiency. Also, rising demand for effective industrial infrastructure in developing regions, focus on retrofitting, upgrades, and replacement of ageing components are driving the sales of dewatering pumps.
Steered by surging demand, dewatering pump manufacturers are expected to focus on innovations. For instance, ARO Fluid Management introduced P35A1-EU submersible dewatering pump, which is capable of handling a wide variety of debris-laden applications.
Why is North America Considered Dominant Dewatering Pumps Market?
Driven by the expansion of the oil and gas sector, the dewatering pump market in North America is expected to grow considerably through the forecast period. Increasing production of hydraulic fracturing to support operations in the oil and gas industry will present conducive environment for the growth of the market.
Besides this, factors such as increasing oil shipments, rising natural gas exports, and steady fuel flows have helped the United States become a net energy exporter, boosting dewatering pump demand in North America.
Furthermore, rising demand for dewatering pumps in the chemical industry is likely to boost market. Also, growing concerns about waste water treatment in North America would will encourage investment in dewatering pumps.
The Canadian Government has recently invested over US$ 10 Bn for the replacement and optimization of the existing dewatering pump network in the country. Favorable initiatives undertaken by the government is expected to help the North America market grow.
Find your sweet spots for generating winning opportunities in this market.
Talk to AnalystWhat Are The Opportunities For Dewatering Pumps Manufacturers?
Most small and medium size dewatering pumps are sold through distributors. End users are inclined towards pumps distributors who provide engineering expertise, aftersales services and end-to-end solutions to meet specific requirements of customers.
Most global players such as Grundfos, KSB AG, Wilo AG and Xylem Incorporation follow the strategy of expanding local networks by increasing tie-ups with regional as well as local distributors.
Some are also investing to set up facilities in promising economies such as India and China, to reduce their operational costs and increase profitability. Besides this, their focus on strategic collaborations will continue growing as they aim for competitive edge.
What Is The Impact Of The COVID-19 Crisis On The Dewatering Pumps Market?
Lockdowns implemented in a number of countries had a negative influence on the market. Obstacles have arisen as a result of limited production and transportation-related delays caused by travel restrictions. Furthermore, economic activities had come to a halt due to widespread lockdowns and mobility restrictions.
The global demand for dewatering pumps in 2020 has been influenced by the shutdown of manufacturing and construction businesses. This had a negative impact on the dewatering pumps market.

A unified Market Research Subscription Platform, built for today's disparate research needs.
Country-wise Insights
What is the demand outlook for Germany dewatering pumps market?
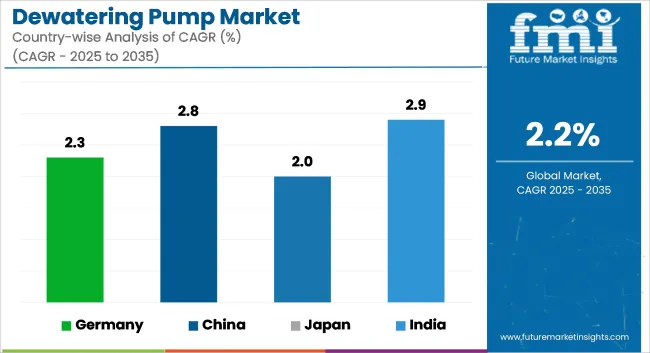
The increasing use of dewatering pumps in wastewater management and recycling is likely to drive growth of the market in Germany. This is due to the fact that dewatering pumps assist in the pumping of both clean and unclean water containing abrasives. In addition, manufacturers in Germany are focusing on developing energy-efficient pump systems to help the industry grow.
For example, BBA Pumps BV, offers a line of PT WellPoint dewatering pumps with low maintenance, high suction lift, and long service life. Furthermore, the need for energy-efficient and eco-friendly pumps is expected to enable growth in the Germany market.
Owing to the increasing refurbishment activities in industrial plants and use of different pumping systems in various industries, particularly oil & gas, and power and chemicals to increase production efficiency net sales of dewatering pumps will increase during the forecast period.
What is Driving the China Dewatering Pumps Market?
The China dewatering pump market is indisputably huge. Amid ongoing modernization of infrastructure and urbanization, China offers impressive opportunities for the growth of the dewatering pumps market.
With mass immigration of population from rural to urban areas, demand for dewatering pumps required in waste and water treatment, food & beverage and power generation will considerably grow.
Apart from wastewater treatment plants, water reclamation and resource recovery stations also are exhibiting high demand for dewatering pumps in China. According to the study, China is estimated to dominate the Asia dewatering pumps market with the CAGR of 6.0% by value over the forecast period
Will Japan Emerge as a Lucrative Market for Dewatering Pumps?
Japan is inclined towards a better living standard with a sustainable environment; hence, the country spends highly on increasing drinking water capacity and on wastewater treatment. This will in turn increase the demand for dewatering pumps.
The increasing fossil fuel and mineral ore requirements in the country is slated to encourage exploration activities in mining industry where slurry, sludge and hybrid type of dewatering pumps are extensively used. The Japan dewatering pump market is estimated to be valued at US$ 228.3 Mn by 2022 end and expanding with a CAGR of 3.9% over the forecast period.
Category-wise Insights
Which is the Preferred Capacity in Dewatering Pumps Market?
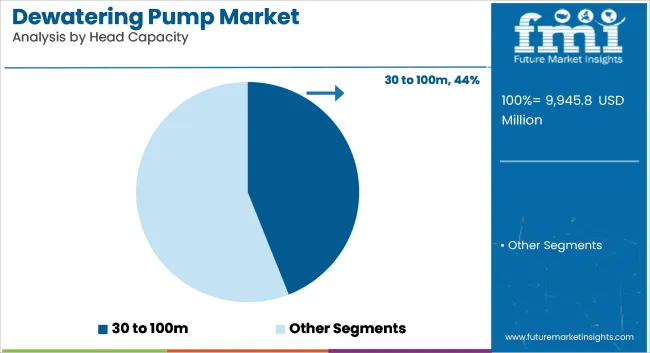
The 3-10 HP dewatering pumps segment accounts for more than one-fourth of the global market. These high pressure pumps are used in agriculture and irrigation applications, which are easy to operate, and are suitable for potable purposes, as well as the robustness and durability makes it preferred choice among the end-users. The segment is expected to grow at a CAGR of 5.2% by volume during the forecast period.
Which Is The Most Preferred Product Type In The Dewatering Pumps Market?
Among product types, slurry pump and sludge pump are expected to witness high growth in demand over the forecast period. Rising demand from water & wastewater treatment industry, followed by the oil & gas industry is expected to drive the market over the forecast period.
In terms of value, the slurry pumps segment is anticipated to be valued at US$ 3,283.3 Mn by 2022 end, which is estimated to grow with a CAGR of 5.7% over the forecast period.
Competitive Landscape
Over the past few years, increase in the number of acquisitions and expansion activities has been witnessed to improve the supply of industrial components. Several key players are also focusing on improving efficiency of pumps. For Instance:
- In May 2021, the KSB Group launched the latest generation of its time-tested submersible grey water pumps-the AmaDrainer 3 type series, which is a vertical single-stage fully floodable submersible motor pump.
In January 2018, Sulzer acquired California-based JWC Environmental LLC, which is into critical solids reduction and removal products manufacturing.
Scope of Report
Attribute |
Details |
Forecast Period |
2022-2028 |
Historical Data Available for |
2013-2022 |
Market Analysis |
USD Million for Value and Units for Volume |
Key Regions Covered |
North America, Latin America, Eastern Europe, Western Europe, Middle East and Africa (MEA), South East Asia Pacific, China, India, Japan |
Key Countries Covered |
US, Canada, Brazil, Mexico, Germany, U.K., France, Spain Italy, BENELUX, Indonesia, Philippines, Thailand, Malaysia, Oceania, Russia, Poland, GCC Countries, Turkey, Israel, South Africa |
Key Segments Covered |
Product Type, Technology, Capacity, End Use and Region |
Key Companies Profiled |
Atlas Copco AB Kubota Corporation KSB SE & Co. KGaA Grundfos Suzler Ltd Wacker Neuson Group Tsurumi Manufacturing Co.,Ltd. Ruhrpumpen Group WILO SE The Weir Group Plc Kirloskar Brothers Ltd. Grindex AB Thomson Pump SPP Pumps ANDRITZ GROUP Ingersoll-Rand PLC Sumitomo Heavy Industries Ltd. |
Report Coverage |
Market Forecast, Company Share Analysis, Competition Intelligence, DROT Analysis, Market Dynamics and Challenges, and Strategic Growth Initiatives |
Customization & Pricing |
Available upon Request |
Dewatering Pumps Market by Category
By Product Type:
- Sludge Pumps
- Slurry Pumps
- Drainage Pumps
- Hybrid Pumps
By Technology:
- Positive Displacement Type
- Centrifugal Type
By Capacity:
- 0.5-3 hp
- 3-10 hp
- 10-50 hp
- Above 50
By End Use:
- Civic Infrastructure Construction
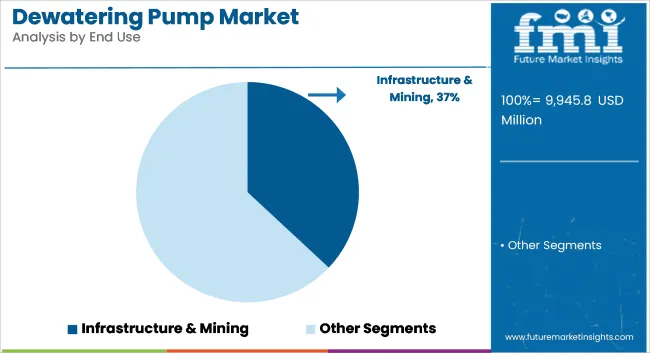
- Mining & Metals
- Paper & Pulp
- Chemicals
- Power Generation
- Food & Beverages
- Municipal
- Others
By Region:
- North America
- Latin America
- Eastern Europe
- Western Europe
- Middle East and Africa (MEA)
- South East Asia Pacific
- China
- India
- Japan
Frequently Asked Questions
The dewatering pumps market is expected to reach US$ 6.9 Bn in 2022.
The dewatering pumps market has been estimated to exhibit growth at 5.3% CAGR between 2022 and 2028 on the basis of value.
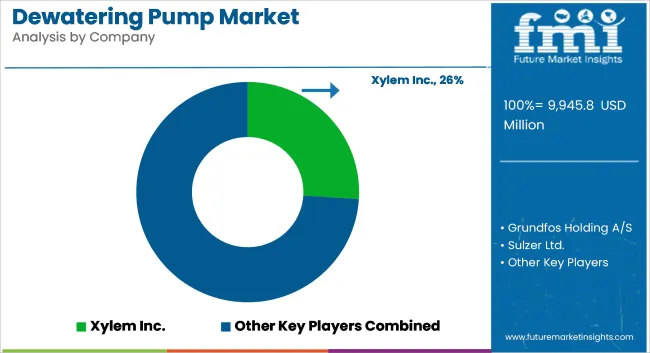
Xylem Inc., Atlas Copco AB, Kubota Corporation, KSB SE & Co. KGaA, Grundfos. are the leading market players. They collectively is anticipated to account for 35% to 40% of the global market share.
The demand in the U.S. is expected to increase by 4.8% CAGR between 2022 and 2028.
China, the U.S., and Germany, are the key end users of dewatering pumps.
Increasing focus on capacity expansion and acquisitions among leading players is expected to shape the market in the coming years. Entry of new players especially in China is also expected to impact growth prospects positively.
Table of Content
1. Executive Summary
1.1. Market Overview
1.2. Market Analysis
1.3. FMI Analysis and Recommendations
1.4. Wheel of Fortune
2. Market Introduction
2.1. Market Definition
2.2. Market Taxonomy
3. Dewatering Pumps Market Background
3.1. Macro-Economic Factors
3.2. Opportunity Analysis
3.3. Market Dynamics
3.3.1. Drivers
3.3.2. Restraints
3.3.3. Trends
3.4. Value Chain Analysis
3.5. Forecast Factors – Relevance & Impact
4. Global Dewatering Pumps Market Analysis 2013–2021 and Forecast 2022–2028
4.1. Market Volume (Units) Projections
4.2. Market Size Projections
4.2.1. Y-o-Y Projections
4.2.2. Absolute $ Opportunity Analysis
5. Global Dewatering Pumps Market Analysis 2013–2021 and Forecast 2022–2028, by Technology
5.1. Introduction
5.1.1. Market Value Share Analysis By Technology
5.1.2. Y-o-Y Growth Analysis By Technology
5.2. Historical Market Size (US$ Mn) and Volume (Units) By Technology, 2013–2021
5.3. Market Size (US$ Mn) and Volume (Units) Forecast By Technology, 2022-2028
5.3.1. Positive Displacement Type
5.3.2. Centrifugal Type
5.4. Market Attractiveness Analysis By Technology
6. Global Dewatering Pumps Market Analysis 2013–2021 and Forecast 2022–2028, by Capacity
6.1. Introduction
6.1.1. Market Value Share Analysis By Capacity
6.1.2. Y-o-Y Growth Analysis By Capacity
6.2. Historical Market Size (US$ Mn) and Volume (Units) By Capacity, 2013–2021
6.3. Market Size (US$ Mn) and Volume (Units) Forecast By Capacity, 2022-2028
6.3.1. 0.5-3 hp
6.3.2. 3-10 hp
6.3.3. 10-50 hp
6.3.4. Above 50
6.4. Market Attractiveness Analysis By Capacity
7. Global Dewatering Pumps Market Analysis 2013–2021 and Forecast 2022–2028, by Product Type
7.1. Introduction
7.1.1. Market Value Share Analysis By Product Type
7.1.2. Y-o-Y Growth Analysis By Product Type
7.2. Historical Market Size (US$ Mn) and Volume (Units) By Product Type, 2013–2021
7.3. Market Size (US$ Mn) and Volume (Units) Forecast By Product Type, 2022-2028
7.3.1. Sludge Pumps
7.3.2. Slurry Pumps
7.3.3. Drainage Pumps
7.3.4. Hybrid Pumps
7.4. Market Attractiveness Analysis By Product Type
8. Global Dewatering Pumps Market Analysis 2013–2021 and Forecast 2022–2028, by End Use
8.1. Introduction
8.1.1. Market Value Share Analysis By End Use
8.1.2. Y-o-Y Growth Analysis By End Use
8.2. Historical Market Size (US$ Mn) and Volume (Units) By End Use, 2013–2021
8.3. Market Size (US$ Mn) and Volume (Units) Forecast By End Use, 2022-2028
8.3.1. Civic Infrastructure Construction
8.3.1.1. Commercial Construction
8.3.1.2. Tunnels
8.3.2. Mining & Metals
8.3.3. Paper & Pulp
8.3.4. Chemicals
8.3.5. Power Generation
8.3.6. Food & Beverages
8.3.7. Municipal
8.3.8. Others
8.4. Market Attractiveness Analysis By End Use
9. Global Dewatering Pumps Market Analysis 2013–2021 and Forecast 2022–2028 By Region
9.1. Introduction
9.1.1. Market Value Share Analysis By Region
9.1.2. Y-o-Y Growth Analysis By Region
9.2. Historical Market Size (US$ Mn) and Volume (Units) Analysis By Region, 2013–2021
9.3. Current Market Size (US$ Mn) and Volume (Units) Forecast By Region, 2022-2028
9.3.1. North America
9.3.2. Western Europe
9.3.3. South East Asia & Pacific (SAEP)
9.3.4. Latin America
9.3.5. Eastern Europe
9.3.6. Middle East and Africa
9.3.7. China
9.3.8. Japan
9.3.9. India
9.4. Market Attractiveness Analysis By Region
10. Global Dewatering Pumps Market Pricing Analysis
10.1. Regional Average Pricing Analysis
10.1.1. North America
10.1.2. Western Europe
10.1.3. South East Asia & Pacific (SAEP)
10.1.4. Latin America
10.1.5. Eastern Europe
10.1.6. Middle East and Africa
10.1.7. China
10.1.8. Japan
10.1.9. India
10.2. Pricing Analysis by Technology
10.3. Pricing Analysis by Capacity
10.4. Pricing Analysis, by Key Manufacturers
11. North America Dewatering Pumps Market Analysis 2013–2021 and Forecast 2022–2028
11.1. Introduction
11.2. Historical Market Size (US$ Mn) and Volume (Units) By Market Segments, 2013–2021
11.3. Market Size (US$ Mn) and Volume (Units) Forecast By Market Segments, 2022-2028
11.3.1. By Country
11.3.1.1. U.S.
11.3.1.2. Canada
11.3.2. By Technology
11.3.2.1. Positive Displacement Type
11.3.2.2. Centrifugal Type
11.3.3. By Capacity
11.3.4. 0.5-3 hp
11.3.5. 3-10 hp
11.3.6. 10-50 hp
11.3.7. Above 50
11.3.8. By Product Type
11.3.8.1. Sludge Pumps
11.3.8.2. Slurry Pumps
11.3.8.3. Drainage Pumps
11.3.8.4. Hybrid Pumps
11.3.9. By End Use
11.3.9.1. Civic Infrastructure Construction
11.3.9.1.1. Commercial Construction
11.3.9.1.2. Tunnels
11.3.9.2. Mining & Metals
11.3.9.3. Paper & Pulp
11.3.9.4. Chemicals
11.3.9.5. Power Generation
11.3.9.6. Food & Beverages
11.3.9.7. Municipal
11.3.9.8. Others
11.4. Market Attractiveness Analysis
11.4.1. By Country
11.4.2. By Technology
11.4.3. By Capacity
11.4.4. By Product Type
11.4.5. By End Use
11.5. Market Trends
11.6. Drivers and Restraints: Impact Analysis
11.7. Key Market Participants- (Intensity Map)
12. Western Europe Dewatering Pumps Market Analysis 2013–2021 and Forecast 2022–2028
12.1. Introduction
12.2. Historical Market Size (US$ Mn) and Volume (Units) By Market Segments, 2013–2021
12.3. Market Size (US$ Mn) and Volume (Units) Forecast By Market Segments, 2022-2028
12.3.1. By Country
12.3.1.1. Germany
12.3.1.2. Italy
12.3.1.3. France
12.3.1.4. U.K.
12.3.1.5. Spain
12.3.1.6. BENELUX
12.3.1.7. Rest of Western Europe
12.3.2. By Technology
12.3.2.1. Positive Displacement Type
12.3.2.2. Centrifugal Type
12.3.3. By Capacity
12.3.4. 0.5-3 hp
12.3.5. 3-10 hp
12.3.6. 10-50 hp
12.3.7. Above 50
12.3.8. By Product Type
12.3.8.1. Sludge Pumps
12.3.8.2. Slurry Pumps
12.3.8.3. Drainage Pumps
12.3.8.4. Hybrid Pumps
12.3.9. By End Use
12.3.9.1. Civic Infrastructure Construction
12.3.9.1.1. Commercial Construction
12.3.9.1.2. Tunnels
12.3.9.2. Mining & Metals
12.3.9.3. Paper & Pulp
12.3.9.4. Chemicals
12.3.9.5. Power Generation
12.3.9.6. Food & Beverages
12.3.9.7. Municipal
12.3.9.8. Others
12.4. Market Attractiveness Analysis
12.4.1. By Country
12.4.2. By Technology
12.4.3. By Capacity
12.4.4. By Product Type
12.4.5. By End Use
12.5. Market Trends
12.6. Drivers and Restraints: Impact Analysis
12.7. Key Market Participants- (Intensity Map)
13. South East Asia & Pacific (SAEP) Dewatering Pumps Market Analysis 2013–2021 and Forecast 2022–2028
13.1. Introduction
13.2. Historical Market Size (US$ Mn) and Volume (Units) By Market Segments, 2013–2021
13.3. Market Size (US$ Mn) and Volume (Units) Forecast By Market Segments, 2022-2028
13.3.1. By Country
13.3.1.1. Indonesia
13.3.1.2. Philippines
13.3.1.3. Thailand
13.3.1.4. Malaysia
13.3.1.5. Oceania
13.3.1.6. Rest of SEA & Pacific
13.3.2. By Technology
13.3.2.1. Positive Displacement Type
13.3.2.2. Centrifugal Type
13.3.3. By Capacity
13.3.4. 0.5-3 hp
13.3.5. 3-10 hp
13.3.6. 10-50 hp
13.3.7. Above 50
13.3.8. By Product Type
13.3.8.1. Sludge Pumps
13.3.8.2. Slurry Pumps
13.3.8.3. Drainage Pumps
13.3.8.4. Hybrid Pumps
13.3.9. By End Use
13.3.9.1. Civic Infrastructure Construction
13.3.9.1.1. Commercial Construction
13.3.9.1.2. Tunnels
13.3.9.2. Mining & Metals
13.3.9.3. Paper & Pulp
13.3.9.4. Chemicals
13.3.9.5. Power Generation
13.3.9.6. Food & Beverages
13.3.9.7. Municipal
13.3.9.8. Others
13.4. Market Attractiveness Analysis
13.4.1. By Country
13.4.2. By Technology
13.4.3. By Capacity
13.4.4. By Product Type
13.4.5. By End Use
13.5. Market Trends
13.6. Drivers and Restraints: Impact Analysis
13.7. Key Market Participants- (Intensity Map)
14. Latin America Dewatering Pumps Market Analysis 2013–2021 and Forecast 2022–2028
14.1. Introduction
14.2. Historical Market Size (US$ Mn) and Volume (Units) By Market Segments, 2013–2021
14.3. Market Size (US$ Mn) and Volume (Units) Forecast By Market Segments, 2022-2028
14.3.1. By Country
14.3.1.1. Mexico
14.3.1.2. Brazil
14.3.1.3. Rest of Latin America
14.3.2. By Technology
14.3.2.1. Positive Displacement Type
14.3.2.2. Centrifugal Type
14.3.3. By Capacity
14.3.4. 0.5-3 hp
14.3.5. 3-10 hp
14.3.6. 10-50 hp
14.3.7. Above 50
14.3.8. By Product Type
14.3.8.1. Sludge Pumps
14.3.8.2. Slurry Pumps
14.3.8.3. Drainage Pumps
14.3.8.4. Hybrid Pumps
14.3.9. By End Use
14.3.9.1. Civic Infrastructure Construction
14.3.9.1.1. Commercial Construction
14.3.9.1.2. Tunnels
14.3.9.2. Mining & Metals
14.3.9.3. Paper & Pulp
14.3.9.4. Chemicals
14.3.9.5. Power Generation
14.3.9.6. Food & Beverages
14.3.9.7. Municipal
14.3.9.8. Others
14.4. Market Attractiveness Analysis
14.4.1. By Country
14.4.2. By Technology
14.4.3. By Capacity
14.4.4. By Product Type
14.4.5. By End Use
14.5. Market Trends
14.6. Drivers and Restraints: Impact Analysis
14.7. Key Market Participants- (Intensity Map)
15. Eastern Europe Dewatering Pumps Market Analysis 2013–2021 and Forecast 2022–2028
15.1. Introduction
15.2. Historical Market Size (US$ Mn) and Volume (Units) By Market Segments, 2013–2021
15.3. Market Size (US$ Mn) and Volume (Units) Forecast By Market Segments, 2022-2028
15.3.1. By Country
15.3.1.1. Russia
15.3.1.2. Poland
15.3.1.3. Rest of Eastern Europe
15.3.2. By Technology
15.3.2.1. Positive Displacement Type
15.3.2.2. Centrifugal Type
15.3.3. By Capacity
15.3.4. 0.5-3 hp
15.3.5. 3-10 hp
15.3.6. 10-50 hp
15.3.7. Above 50
15.3.8. By Product Type
15.3.8.1. Sludge Pumps
15.3.8.2. Slurry Pumps
15.3.8.3. Drainage Pumps
15.3.8.4. Hybrid Pumps
15.3.9. By End Use
15.3.9.1. Civic Infrastructure Construction
15.3.9.1.1. Commercial Construction
15.3.9.1.2. Tunnels
15.3.9.2. Mining & Metals
15.3.9.3. Paper & Pulp
15.3.9.4. Chemicals
15.3.9.5. Power Generation
15.3.9.6. Food & Beverages
15.3.9.7. Municipal
15.3.9.8. Others
15.4. Market Attractiveness Analysis
15.4.1. By Country
15.4.2. By Technology
15.4.3. By Capacity
15.4.4. By Product Type
15.4.5. By End Use
15.5. Market Trends
15.6. Drivers and Restraints: Impact Analysis
15.7. Key Market Participants- (Intensity Map)
16. Middle East and Africa (MEA) Dewatering Pumps Market Analysis 2013–2021 and Forecast 2022–2028
16.1. Introduction
16.2. Historical Market Size (US$ Mn) and Volume (Units) By Market Segments, 2013–2021
16.3. Market Size (US$ Mn) and Volume (Units) Forecast By Market Segments, 2022-2028
16.3.1. By Country
16.3.1.1. GCC Countries
16.3.1.2. Turkey
16.3.1.3. Israel
16.3.1.4. South Africa
16.3.1.5. Rest of MEA
16.3.2. By Technology
16.3.2.1. Positive Displacement Type
16.3.2.2. Centrifugal Type
16.3.3. By Capacity
16.3.4. 0.5-3 hp
16.3.5. 3-10 hp
16.3.6. 10-50 hp
16.3.7. Above 50
16.3.8. By Product Type
16.3.8.1. Sludge Pumps
16.3.8.2. Slurry Pumps
16.3.8.3. Drainage Pumps
16.3.8.4. Hybrid Pumps
16.3.9. By End Use
16.3.9.1. Civic Infrastructure Construction
16.3.9.1.1. Commercial Construction
16.3.9.1.2. Tunnels
16.3.9.2. Mining & Metals
16.3.9.3. Paper & Pulp
16.3.9.4. Chemicals
16.3.9.5. Power Generation
16.3.9.6. Food & Beverages
16.3.9.7. Municipal
16.3.9.8. Others
16.4. Market Attractiveness Analysis
16.4.1. By Country
16.4.2. By Technology
16.4.3. By Capacity
16.4.4. By Product Type
16.4.5. By End Use
16.5. Market Trends
16.6. Drivers and Restraints: Impact Analysis
16.7. Key Market Participants- (Intensity Map)
17. China Dewatering Pumps Market Analysis 2013–2021 and Forecast 2022–2028
17.1. Introduction
17.2. Historical Market Size (US$ Mn) and Volume (Units) By Market Segments, 2013–2021
17.3. Market Size (US$ Mn) and Volume (Units) Forecast By Market Segments, 2022-2028
17.3.1. By Technology
17.3.1.1. Positive Displacement Type
17.3.1.2. Centrifugal Type
17.3.2. By Capacity
17.3.3. 0.5-3 hp
17.3.4. 3-10 hp
17.3.5. 10-50 hp
17.3.6. Above 50
17.3.7. By Product Type
17.3.7.1. Sludge Pumps
17.3.7.2. Slurry Pumps
17.3.7.3. Drainage Pumps
17.3.7.4. Hybrid Pumps
17.3.8. By End Use
17.3.8.1. Civic Infrastructure Construction
17.3.8.1.1. Commercial Construction
17.3.8.1.2. Tunnels
17.3.8.2. Mining & Metals
17.3.8.3. Paper & Pulp
17.3.8.4. Chemicals
17.3.8.5. Power Generation
17.3.8.6. Food & Beverages
17.3.8.7. Municipal
17.3.8.8. Others
17.4. Market Attractiveness Analysis
17.4.1. By Technology
17.4.2. By Capacity
17.4.3. By Product Type
17.4.4. By End Use
17.5. Market Trends
17.6. Drivers and Restraints: Impact Analysis
17.7. Key Market Participants- (Intensity Map)
18. Japan Dewatering Pumps Market Analysis 2013–2021 and Forecast 2022–2028
18.1. Introduction
18.2. Historical Market Size (US$ Mn) and Volume (Units) By Market Segments, 2013–2021
18.3. Market Size (US$ Mn) and Volume (Units) Forecast By Market Segments, 2022-2028
18.3.1. By Technology
18.3.1.1. Positive Displacement Type
18.3.1.2. Centrifugal Type
18.3.2. By Capacity
18.3.3. 0.5-3 hp
18.3.4. 3-10 hp
18.3.5. 10-50 hp
18.3.6. Above 50
18.3.7. By Product Type
18.3.7.1. Sludge Pumps
18.3.7.2. Slurry Pumps
18.3.7.3. Drainage Pumps
18.3.7.4. Hybrid Pumps
18.3.8. By End Use
18.3.8.1. Civic Infrastructure Construction
18.3.8.1.1. Commercial Construction
18.3.8.1.2. Tunnels
18.3.8.2. Mining & Metals
18.3.8.3. Paper & Pulp
18.3.8.4. Chemicals
18.3.8.5. Power Generation
18.3.8.6. Food & Beverages
18.3.8.7. Municipal
18.3.8.8. Others
18.4. Market Attractiveness Analysis
18.4.1. By Technology
18.4.2. By Capacity
18.4.3. By Product Type
18.4.4. By End Use
18.5. Market Trends
18.6. Drivers and Restraints: Impact Analysis
18.7. Key Market Participants- (Intensity Map)
19. India Dewatering Pumps Market Analysis 2013–2021 and Forecast 2022–2028
19.1. Introduction
19.2. Historical Market Size (US$ Mn) and Volume (Units) By Market Segments, 2013–2021
19.3. Market Size (US$ Mn) and Volume (Units) Forecast By Market Segments, 2022-2028
19.3.1. By Technology
19.3.1.1. Positive Displacement Type
19.3.1.2. Centrifugal Type
19.3.2. By Capacity
19.3.3. 0.5-3 hp
19.3.4. 3-10 hp
19.3.5. 10-50 hp
19.3.6. Above 50
19.3.7. By Product Type
19.3.7.1. Sludge Pumps
19.3.7.2. Slurry Pumps
19.3.7.3. Drainage Pumps
19.3.7.4. Hybrid Pumps
19.3.8. By End Use
19.3.8.1. Civic Infrastructure Construction
19.3.8.1.1. Commercial Construction
19.3.8.1.2. Tunnels
19.3.8.2. Mining & Metals
19.3.8.3. Paper & Pulp
19.3.8.4. Chemicals
19.3.8.5. Power Generation
19.3.8.6. Food & Beverages
19.3.8.7. Municipal
19.3.8.8. Others
19.4. Market Attractiveness Analysis
19.4.1. By Technology
19.4.2. By Capacity
19.4.3. By Product Type
19.4.4. By End Use
19.5. Market Trends
19.6. Drivers and Restraints: Impact Analysis
19.7. Key Market Participants- (Intensity Map)
20. Dewatering Pumps Market Industry Structure
20.1. Market Analysis by Tier of Companies
20.1.1. By Tier-1,2 and independent level companies
20.2. Market Concentration
20.2.1. By Top 5 and By Top 10
20.3. Market Presence Analysis
20.3.1. By Regional Footprint
20.3.2. By Channel Footprint
21. Competition Analysis
21.1. Competition Dashboard
21.2. Competitive Benchmarking
21.3. Profitability and Gross Margin Analysis By Competition
21.4. Competition Developments (Mergers, Acquisitions and Expansions)
21.5. Competition Deepdive (Sample Illustration for Company 1)
21.5.1. Xylem Inc.
21.5.1.1. Overview
21.5.1.2. Service Portfolio
21.5.1.3. Profitability by Market Segments (Channel/Region)
21.5.1.4. Operations & Service Footprint
21.5.1.5. Channel Footprint
21.5.1.6. Gross Margin Benchmarking
21.5.1.7. Strategy Overview
21.5.1.7.1. Marketing Strategy
21.5.1.7.2. Channel Strategy
21.5.2. Atlas Copco AB
21.5.2.1. Overview
21.5.2.2. Service Portfolio
21.5.2.3. Profitability by Market Segments (Channel/Region)
21.5.2.4. Operations & Service Footprint
21.5.2.5. Channel Footprint
21.5.2.6. Gross Margin Benchmarking
21.5.2.7. Strategy Overview
21.5.2.7.1. Marketing Strategy
21.5.2.7.2. Channel Strategy
21.5.3. Ebara Corporation
21.5.3.1. Overview
21.5.3.2. Service Portfolio
21.5.3.3. Profitability by Market Segments (Channel/Region)
21.5.3.4. Operations & Service Footprint
21.5.3.5. Channel Footprint
21.5.3.6. Gross Margin Benchmarking
21.5.3.7. Strategy Overview
21.5.3.7.1. Marketing Strategy
21.5.3.7.2. Channel Strategy
21.5.4. Kubota Corporation
21.5.4.1. Overview
21.5.4.2. Service Portfolio
21.5.4.3. Profitability by Market Segments (Channel/Region)
21.5.4.4. Operations & Service Footprint
21.5.4.5. Channel Footprint
21.5.4.6. Gross Margin Benchmarking
21.5.4.7. Strategy Overview
21.5.4.7.1. Marketing Strategy
21.5.4.7.2. Channel Strategy
21.5.5. KSB SE & Co. KGaA
21.5.5.1. Overview
21.5.5.2. Service Portfolio
21.5.5.3. Profitability by Market Segments (Channel/Region)
21.5.5.4. Operations & Service Footprint
21.5.5.5. Channel Footprint
21.5.5.6. Gross Margin Benchmarking
21.5.5.7. Strategy Overview
21.5.5.7.1. Marketing Strategy
21.5.5.7.2. Channel Strategy
21.5.6. Grundfos
21.5.6.1. Overview
21.5.6.2. Service Portfolio
21.5.6.3. Profitability by Market Segments (Channel/Region)
21.5.6.4. Operations & Service Footprint
21.5.6.5. Channel Footprint
21.5.6.6. Gross Margin Benchmarking
21.5.6.7. Strategy Overview
21.5.6.7.1. Marketing Strategy
21.5.6.7.2. Channel Strategy
21.5.7. Suzler Ltd
21.5.7.1. Overview
21.5.7.2. Service Portfolio
21.5.7.3. Profitability by Market Segments (Channel/Region)
21.5.7.4. Operations & Service Footprint
21.5.7.5. Channel Footprint
21.5.7.6. Gross Margin Benchmarking
21.5.7.7. Strategy Overview
21.5.7.7.1. Marketing Strategy
21.5.7.7.2. Channel Strategy
21.5.8. Wacker Neuson Group
21.5.8.1. Overview
21.5.8.2. Service Portfolio
21.5.8.3. Profitability by Market Segments (Channel/Region)
21.5.8.4. Operations & Service Footprint
21.5.8.5. Channel Footprint
21.5.8.6. Gross Margin Benchmarking
21.5.8.7. Strategy Overview
21.5.8.7.1. Marketing Strategy
21.5.8.7.2. Channel Strategy
21.5.9. Tsurumi Manufacturing Co.,Ltd.
21.5.9.1. Overview
21.5.9.2. Service Portfolio
21.5.9.3. Profitability by Market Segments (Channel/Region)
21.5.9.4. Operations & Service Footprint
21.5.9.5. Channel Footprint
21.5.9.6. Gross Margin Benchmarking
21.5.9.7. Strategy Overview
21.5.9.7.1. Marketing Strategy
21.5.9.7.2. Channel Strategy
21.5.10. Ruhrpumpen Group
21.5.10.1. Overview
21.5.10.2. Service Portfolio
21.5.10.3. Profitability by Market Segments (Channel/Region)
21.5.10.4. Operations & Service Footprint
21.5.10.5. Channel Footprint
21.5.10.6. Gross Margin Benchmarking
21.5.10.7. Strategy Overview
21.5.10.7.1. Marketing Strategy
21.5.10.7.2. Channel Strategy
21.5.11. WILO SE
21.5.11.1. Overview
21.5.11.2. Service Portfolio
21.5.11.3. Profitability by Market Segments (Channel/Region)
21.5.11.4. Operations & Service Footprint
21.5.11.5. Channel Footprint
21.5.11.6. Gross Margin Benchmarking
21.5.11.7. Strategy Overview
21.5.11.7.1. Marketing Strategy
21.5.11.7.2. Channel Strategy
21.5.12. The Weir Group Plc
21.5.12.1. Overview
21.5.12.2. Service Portfolio
21.5.12.3. Profitability by Market Segments (Channel/Region)
21.5.12.4. Operations & Service Footprint
21.5.12.5. Channel Footprint
21.5.12.6. Gross Margin Benchmarking
21.5.12.7. Strategy Overview
21.5.12.7.1. Marketing Strategy
21.5.12.7.2. Channel Strategy
21.5.13. Kirloskar Brothers Ltd.
21.5.13.1. Overview
21.5.13.2. Service Portfolio
21.5.13.3. Profitability by Market Segments (Channel/Region)
21.5.13.4. Operations & Service Footprint
21.5.13.5. Channel Footprint
21.5.13.6. Gross Margin Benchmarking
21.5.13.7. Strategy Overview
21.5.13.7.1. Marketing Strategy
21.5.13.7.2. Channel Strategy
21.5.14. Grindex AB
21.5.14.1. Overview
21.5.14.2. Service Portfolio
21.5.14.3. Profitability by Market Segments (Channel/Region)
21.5.14.4. Operations & Service Footprint
21.5.14.5. Channel Footprint
21.5.14.6. Gross Margin Benchmarking
21.5.14.7. Strategy Overview
21.5.14.7.1. Marketing Strategy
21.5.14.7.2. Channel Strategy
21.5.15. Thomson Pump
21.5.15.1. Overview
21.5.15.2. Service Portfolio
21.5.15.3. Profitability by Market Segments (Channel/Region)
21.5.15.4. Operations & Service Footprint
21.5.15.5. Channel Footprint
21.5.15.6. Gross Margin Benchmarking
21.5.15.7. Strategy Overview
21.5.15.7.1. Marketing Strategy
21.5.15.7.2. Channel Strategy
21.5.16. SPP Pumps
21.5.16.1. Overview
21.5.16.2. Service Portfolio
21.5.16.3. Profitability by Market Segments (Channel/Region)
21.5.16.4. Operations & Service Footprint
21.5.16.5. Channel Footprint
21.5.16.6. Gross Margin Benchmarking
21.5.16.7. Strategy Overview
21.5.16.7.1. Marketing Strategy
21.5.16.7.2. Channel Strategy
21.5.17. ANDRITZ GROUP
21.5.17.1. Overview
21.5.17.2. Service Portfolio
21.5.17.3. Profitability by Market Segments (Channel/Region)
21.5.17.4. Operations & Service Footprint
21.5.17.5. Channel Footprint
21.5.17.6. Gross Margin Benchmarking
21.5.17.7. Strategy Overview
21.5.17.7.1. Marketing Strategy
21.5.17.7.2. Channel Strategy
21.5.18. Ingersoll-Rand PLC
21.5.18.1. Overview
21.5.18.2. Service Portfolio
21.5.18.3. Profitability by Market Segments (Channel/Region)
21.5.18.4. Operations & Service Footprint
21.5.18.5. Channel Footprint
21.5.18.6. Gross Margin Benchmarking
21.5.18.7. Strategy Overview
21.5.18.7.1. Marketing Strategy
21.5.18.7.2. Channel Strategy
21.5.19. Sumitomo Heavy Industries Ltd.
21.5.19.1. Overview
21.5.19.2. Service Portfolio
21.5.19.3. Profitability by Market Segments (Channel/Region)
21.5.19.4. Operations & Service Footprint
21.5.19.5. Channel Footprint
21.5.19.6. Gross Margin Benchmarking
21.5.19.7. Strategy Overview
21.5.19.7.1. Marketing Strategy
21.5.19.7.2. Channel Strategy
22. Research Methodology
Let us know your requirement to get
100% FREE customization
List of Tables
Table 01: Global Dewatering Pumps Market Value (US$ Mn) and Volume (Units) Forecast by Technology, 2013 – 2028
Table 02: Global Dewatering Pumps Market Value (US$ Mn) and Volume (Units) Forecast by Product Type, 2013 – 2028
Table 03: Global Dewatering Pumps Market Value (US$ Mn) and Volume (Units) Forecast by Product Type, 2013 – 2028
Table 04: Global Dewatering Pumps Market Volume (Units) Forecast by End Use, 2013 – 2028
Table 05: Global Dewatering Pumps Market Value (US$ Mn) Forecast by End Use, 2013 – 2028
Table 06: Global Dewatering Pumps Market Volume (Units) Forecast By Region, 2013 – 2028
Table 07: Global Dewatering Pumps Market Size (US$ Mn) Forecast By Region, 2013 – 2028
Table 08: North America Dewatering Pump Market Value (US$ Mn) and Volume (Units) Forecast By Country, 2013 – 2028
Table 09: North America Dewatering Pumps Market Value (US$ Mn) and Volume (Units) Forecast by Technology, 2013 – 2028
Table 10: North America Dewatering Pumps Market Value (US$ Mn) and Volume (Units) Forecast by Product Type, 2013 – 2028
Table 11: North America Dewatering Pumps Market Value (US$ Mn) and Volume (Units) Forecast by Product Type, 2013 – 2028
Table 12: North America Dewatering Pumps Market Value (US$ Mn) and Volume (Units) Forecast by End Use, 2013 – 2028
Table 13: Latin America Dewatering Pump Market Value (US$ Mn) and Volume (Units) Forecast By Country, 2013 – 2028
Table 14: Latin America Dewatering Pumps Market Value (US$ Mn) and Volume (Units) Forecast by Technology, 2013 – 2028
Table 15: Latin America Dewatering Pumps Market Value (US$ Mn) and Volume (Units) Forecast by Product Type, 2013 – 2028
Table 16: Latin America Dewatering Pumps Market Value (US$ Mn) and Volume (Units) Forecast by Product Type, 2013 – 2028
Table 17: Latin America Dewatering Pumps Market Value (US$ Mn) and Volume (Units) Forecast by End Use, 2013 – 2028
Table 18: Western Europe Dewatering Pump Market Value (US$ Mn) and Volume (Units) Forecast By Country, 2013 – 2028
Table 19: Western Europe Dewatering Pumps Market Value (US$ Mn) and Volume (Units) Forecast by Technology, 2013 – 2028
Table 20: Western Europe Dewatering Pumps Market Value (US$ Mn) and Volume (Units) Forecast by Product Type, 2013 – 2028
Table 21: Western Europe Dewatering Pumps Market Value (US$ Mn) and Volume (Units) Forecast by Product Type, 2013 – 2028
Table 22: Western Europe Dewatering Pumps Market Value (US$ Mn) and Volume (Units) Forecast by End Use, 2013 – 2028
Table 23: Eastern Europe Dewatering Pump Market Value (US$ Mn) and Volume (Units) Forecast By Country, 2013 – 2027
Table 24: Eastern Europe Dewatering Pumps Market Value (US$ Mn) and Volume (Units) Forecast by Technology, 2013 – 2028
Table 25: Eastern Europe Dewatering Pumps Market Value (US$ Mn) and Volume (Units) Forecast by Product Type, 2013 – 2028
Table 26: Eastern Europe Dewatering Pumps Market Value (US$ Mn) and Volume (Units) Forecast by Product Type, 2013 – 2028
Table 27: Eastern Europe Dewatering Pumps Market Value (US$ Mn) and Volume (Units) Forecast by End Use, 2013 – 2028
Table 28: MEA Dewatering Pump Market Value (US$ Mn) and Volume (Units) Forecast By Country, 2013 – 2028
Table 29: MEA Dewatering Pumps Market Value (US$ Mn) and Volume (Units) Forecast by Technology, 2013 – 2028
Table 30: MEA Dewatering Pumps Market Value (US$ Mn) and Volume (Units) Forecast by Product Type, 2013 – 2028
Table 31: MEA Dewatering Pumps Market Value (US$ Mn) and Volume (Units) Forecast by Product Type, 2013 – 2028
Table 32: MEA Dewatering Pumps Market Value (US$ Mn) and Volume (Units) Forecast by End Use, 2013 – 2028
Table 33: China Dewatering Pumps Market Value (US$ Mn) and Volume (Units) Forecast by Technology, 2013 – 2028
Table 34: China Dewatering Pumps Market Value (US$ Mn) and Volume (Units) Forecast by Product Type, 2013 – 2028
Table 35: China Dewatering Pumps Market Value (US$ Mn) and Volume (Units) Forecast by Product Type, 2013 – 2028
Table 36: China Dewatering Pumps Market Value (US$ Mn) and Volume (Units) Forecast by End Use, 2013 – 2028
Table 37: SEA & Pacific Dewatering Pump Market Value (US$ Mn) and Volume (Units) Forecast By Country, 2013 – 2028
Table 38: SEA & Pacific Dewatering Pumps Market Value (US$ Mn) and Volume (Units) Forecast by Technology, 2013 – 2028
Table 39: SEA & Pacific Dewatering Pumps Market Value (US$ Mn) and Volume (Units) Forecast by Product Type, 2013 – 2028
Table 40: SEA & Pacific Dewatering Pumps Market Value (US$ Mn) and Volume (Units) Forecast by Product Type, 2013 – 2028
Table 41: SEA & Pacific Dewatering Pumps Market Value (US$ Mn) and Volume (Units) Forecast by End Use, 2013 – 2028
Table 42: India Dewatering Pumps Market Value (US$ Mn) and Volume (Units) Forecast by Technology, 2013 – 2028
Table 43: India Dewatering Pumps Market Value (US$ Mn) and Volume (Units) Forecast by Product Type, 2013 – 2028
Table 44: India Dewatering Pumps Market Value (US$ Mn) and Volume (Units) Forecast by Product Type, 2013 – 2028
Table 45: India Dewatering Pumps Market Value (US$ Mn) and Volume (Units) Forecast by End Use, 2013 – 2028
Table 46: Japan Dewatering Pumps Market Value (US$ Mn) and Volume (Units) Forecast by Technology, 2013 – 2028
Table 47: Japan Dewatering Pumps Market Value (US$ Mn) and Volume (Units) Forecast by Product Type, 2013 – 2028
Table 48: Japan Dewatering Pumps Market Value (US$ Mn) and Volume (Units) Forecast by Product Type, 2013 – 2028
Table 49: Japan Dewatering Pumps Market Value (US$ Mn) and Volume (Units) Forecast by End Use, 2013 – 2028
Find your sweet spots for generating winning opportunities in this market.
Talk to AnalystList of Charts
Figure 01: Global Dewatering Pump Market Size (US$ Mn) and Volume (Units) Analysis, 2013-2021
Figure 02: Global Dewatering Pump Market Size (US$ Mn) and Volume (Units) Analysis, 2022-2026
Figure 03: Global Dewatering Pumps Market: BPS Analysis by Technology – 2013, 2022 & 2028
Figure 04: Global Dewatering Pumps Market: Y-o-Y Growth Comparison by Technology, 2021 – 2028
Figure 05: Global Dewatering Pumps Market: Market Attractiveness by Technology, 2022 – 2028
Figure 06: Global Dewatering Pumps Market Absolute $ Opportunity by Positive Displacement Type Segment 2022 to 2022 and 2028
Figure 07:Global Dewatering Pumps Market Absolute $ Opportunity by Centrifugal Type Segment 2013 to 2022 and 2028
Figure 08: Global Dewatering Pumps Market: BPS Analysis by Product Type – 2013, 2022 & 2028
Figure 09: Global Dewatering Pumps Market: Y-o-Y Growth Comparison by Product Type, 2021 – 2028
Figure 10: Global Dewatering Pumps Market: Market Attractiveness by Product Type, 2022 – 2028
Figure 11: Global Dewatering Pumps Market Absolute $ Opportunity by Sludge Pumps Segment 2013 to 2022 and 2028
Figure 12: Global Dewatering Pumps Market Absolute $ Opportunity by Slurry Pumps Segment 2013 to 2022 and 2028
Figure 13: Global Dewatering Pumps Market Absolute $ Opportunity by Drainage Pumps Segment 2013 to 2022 and 2028
Figure 14: Global Dewatering Pumps Market Absolute $ Opportunity by Hybrid Pumps Segment 2013 to 2022 and 2028
Figure 15: Global Dewatering Pumps Market: BPS Analysis by Capacity – 2022 & 2028
Figure 16: Global Dewatering Pumps Market: Y-o-Y Growth Comparison by Capacity, 2021 – 2028
Figure 17: Global Dewatering Pumps Market: Market Attractiveness by Capacity, 2022 – 2028
Figure 18: Global Dewatering Pumps Market Absolute $ Opportunity by 0.5-3 hp Segment 2013 to 2022 and 2028
Figure 19: Global Dewatering Pumps Market Absolute $ Opportunity by 3-10 hp Segment 2013 to 2022 and 2028
Figure 20: Global Dewatering Pumps Market Absolute $ Opportunity by 10-50 hp Segment 2013 to 2022 and 2028
Figure 21: Global Dewatering Pumps Market Absolute $ Opportunity by Above 50 hp Segment 2013 to 2022 and 2028
Figure 22: Global Dewatering Pumps Market: BPS Analysis by End Use – 2013, 2022 & 2028
Figure 23: Global Dewatering Pumps Market: Y-o-Y Growth Comparison by End Use, 2013 – 2028
Figure 24: Global Dewatering Pumps Market: Market Attractiveness by End-Use, 2013 – 2028
Figure 25: Global Dewatering Pumps Market Absolute $ Opportunity by Civic Infrastructure Construction Segment 2022 and 2028
Figure 26: Global Dewatering Pumps Market Absolute $ Opportunity by Mining & Metals Segment 2013 to 2022 and 2028
Figure 27: Global Dewatering Pumps Market Absolute $ Opportunity by Paper & Pulp Segment 2013 to 2022 and 2028
Figure 28: Global Dewatering Pumps Market Absolute $ Opportunity by Chemicals Segment 2013 to 2022 and 2028
Figure 29: Global Dewatering Pumps Market Absolute $ Opportunity by Power Generation Segment 2013 to 2022 and 2028
Figure 30: Global Dewatering Pumps Market Absolute $ Opportunity by Food & Beverages Segment 2013 to 2022 and 2028
Figure 31: Global Dewatering Pumps Market Absolute $ Opportunity by Municipal Segment 2013 to 2022 and 2028
Figure 32: Global Dewatering Pumps Market Absolute $ Opportunity by Others Segment 2013 to 2022 and 2028
Figure 33: Global Dewatering Pumps Market BPS Analysis By Region – 2013, 2022 & 2028
Figure 34: Global Dewatering Pumps Market Y-o-Y Projections By Region, 2013-2028
Figure 35: Global Dewatering Pumps Market
Figure 36: North America Dewatering Pumps Market Absolute $ Opportunity 2013 to 2022 and 2028
Figure 37: Latin America Dewatering Pumps Market Absolute $ Opportunity 2013 to 2022 and 2028
Figure 38: Western Europe Dewatering Pumps Market Absolute $ Opportunity 2013 to 2022 and 2028
Figure 39: Eastern Europe Dewatering Pumps Market Absolute $ Opportunity 2013 to 2022 and 2028
Figure 40: MEA Dewatering Pumps Market Absolute $ Opportunity 2013 to 2022 and 2028
Figure 41: China Dewatering Pumps Market Absolute $ Opportunity 2013 to 2022 and 2028
Figure 42: SEAP Dewatering Pumps Market Absolute $ Opportunity 2013 to 2022 and 2028
Figure 43: India Dewatering Pumps Market Absolute $ Opportunity 2013 to 2022 and 2028
Figure 44: Japan Dewatering Pumps Market Absolute $ Opportunity 2013 to 2022 and 2028
Figure 45: North America Dewatering Pump Market Share and BPS Analysis By Country – 2013, 2022 & 2028
Figure 46: North America Dewatering Pump Market Y-o-Y Growth Projections By Country, 2014-2028
Figure 47: North America Dewatering Pump Market Attractiveness Analysis By Country, 2022,2028
Figure 48: U.S. Dewatering Pump Market Absolute $ Opportunity 2013 to 2022 and 2028
Figure 49: Canada Dewatering Pump Market Absolute $ Opportunity 2013 to 2022 and 2028
Figure 50: North America Dewatering Pumps Market: BPS Analysis by Technology – 2013, 2022 & 2028
Figure 51: North America Dewatering Pumps Market: Y-o-Y Growth Comparison by Technology, 2021 – 2028
Figure 52: North America Dewatering Pumps Market: Market Attractiveness by Technology, 2022 – 2028
Figure 53: North America Dewatering Pumps Market Absolute $ Opportunity by Positive Displacement Type Segment 2013 to 2022 and 2028
Figure 54:North America Dewatering Pumps Market Absolute $ Opportunity by Centrifugal Type Segment 2013 to 2022 and 2028
Figure 55: North America Dewatering Pumps Market: BPS Analysis by Product Type – 2013, 2022 & 2028
Figure 56: North America Dewatering Pumps Market: Y-o-Y Growth Comparison by Product Type, 2021 – 2028
Figure 57: North America Dewatering Pumps Market: Market Attractiveness by Product Type, 2022 – 2028
Figure 58: North America Dewatering Pumps Market Absolute $ Opportunity by Sludge Pumps Segment 2013 to 2022 and 2028
Figure 59: North America Dewatering Pumps Market Absolute $ Opportunity by Slurry Pumps Segment 2013 to 2022 and 2028
Figure 60: North America Dewatering Pumps Market Absolute $ Opportunity by Drainage Pumps Segment 2013 to 2022 and 2028
Figure 61: North America Dewatering Pumps Market Absolute $ Opportunity by Hybrid Pumps Segment 2013 to 2022 and 2028
Figure 62: North America Dewatering Pumps Market: BPS Analysis by Capacity – 2013, 2022 & 2028
Figure 63: North America Dewatering Pumps Market: Y-o-Y Growth Comparison by Capacity, 2021 – 2028
Figure 64: North America Dewatering Pumps Market: Market Attractiveness by Capacity, 2022 – 2028
Figure 65: North America Dewatering Pumps Market Absolute $ Opportunity by 0.5-3 hp Segment 2013 to 2022 and 2028
Figure 66: North America Dewatering Pumps Market Absolute $ Opportunity by 3-10 hp Segment 2013 to 2022 and 2028
Figure 67: North America Dewatering Pumps Market Absolute $ Opportunity by 10-50 hp Segment 2013 to 2022 and 2028
Figure 68: North America Dewatering Pumps Market Absolute $ Opportunity by Above 50 hp Segment 2013 to 2022 and 2028
Figure 69: North America Dewatering Pumps Market: BPS Analysis by End Use – 2013, 2022 & 2028
Figure 70: North America Dewatering Pumps Market: Y-o-Y Growth Comparison by End Use, 2013 – 2028
Figure 71: North America Dewatering Pumps Market: Market Attractiveness by End-Use, 2013 – 2028
Figure 72: North America Dewatering Pumps Market Absolute $ Opportunity by Civic Infrastructure Construction Segment 2013 to 2022 and 2028
Figure 73: North America Dewatering Pumps Market Absolute $ Opportunity by Mining & Metals Segment 2013 to 2022 and 2028
Figure 74: North America Dewatering Pumps Market Absolute $ Opportunity by Paper & Pulp Segment 2013 to 2022 and 2028
Figure 75: North America Dewatering Pumps Market Absolute $ Opportunity by Chemicals Segment 2013 to 2022 and 2028
Figure 76: North America Dewatering Pumps Market Absolute $ Opportunity by Power Generation Segment 2013 to 2022 and 2028
Figure 77: North America Dewatering Pumps Market Absolute $ Opportunity by Food & Beverages Segment 2013 to 2022 and 2028
Figure 78: North America Dewatering Pumps Market Absolute $ Opportunity by Municipal Segment 2013 to 2022 and 2028
Figure 79: North America Dewatering Pumps Market Absolute $ Opportunity by Others Segment 2013 to 2022 and 2028
Figure 80: Latin America Dewatering Pump Market Share and BPS Analysis By Country – 2013, 2022 & 2028
Figure 81: Latin America Dewatering Pump Market Y-o-Y Growth Projections By Country, 2021-2028
Figure 82: Latin America Dewatering Pump Market Attractiveness Analysis By Country, 2022-2028
Figure 83: Mexico Dewatering Pump Market Absolute $ Opportunity 2013 to 2022 and 2028
Figure 84: Brazil Dewatering Pump Market Absolute $ Opportunity 2013 to 2022 and 2028
Figure 85: Rest of Latin America Dewatering Pump Market Absolute $ Opportunity 2013 to 2022 and 2028
Figure 86: Latin America Dewatering Pumps Market: BPS Analysis by Technology – 2013, 2022 & 2028
Figure 87: Latin America Dewatering Pumps Market: Y-o-Y Growth Comparison by Technology, 2021 – 2028
Figure 88: Latin America Dewatering Pumps Market: Market Attractiveness by Technology, 2022 – 2028
Figure 89: Latin America Dewatering Pumps Market Absolute $ Opportunity by Positive Displacement Type Segment 2013 to 2022 and 2028
Figure 90: Latin America Dewatering Pumps Market Absolute $ Opportunity by Centrifugal Type Segment 2013 to 2022 and 2028
Figure 91: Latin America Dewatering Pumps Market: BPS Analysis by Product Type – 2013, 2022 & 2028
Figure 92: Latin America Dewatering Pumps Market: Y-o-Y Growth Comparison by Product Type, 2021 – 2028
Figure 93: Latin America Dewatering Pumps Market: Market Attractiveness by Product Type, 2022 – 2028
Figure 94: Latin America Dewatering Pumps Market Absolute $ Opportunity by Sludge Pumps Segment 2013 to 2022 and 2028
Figure 95: Latin America Dewatering Pumps Market Absolute $ Opportunity by Slurry Pumps Segment 2013 to 2022 and 2028
Figure 96: Latin America Dewatering Pumps Market Absolute $ Opportunity by Drainage Pumps Segment 2013 to 2022 and 2028
Figure 97: Latin America Dewatering Pumps Market Absolute $ Opportunity by Hybrid Pumps Segment 2013 to 2022 and 2028
Figure 98: Latin America Dewatering Pumps Market: BPS Analysis by Capacity – 2013, 2022 & 2028
Figure 99: Latin America Dewatering Pumps Market: Y-o-Y Growth Comparison by Capacity, 2021 – 2028
Figure 100: Latin America Dewatering Pumps Market: Market Attractiveness by Capacity, 2022 – 2028
Figure 101: Latin America Dewatering Pumps Market Absolute $ Opportunity by 0.5-3 hp Segment 2013 to 2022 and 2028
Figure 102: Latin America Dewatering Pumps Market Absolute $ Opportunity by 3-10 hp Segment 2013 to 2022 and 2028
Figure 103: Latin America Dewatering Pumps Market Absolute $ Opportunity by 10-50 hp Segment 2013 to 2022 and 2028
Figure 104: Latin America Dewatering Pumps Market Absolute $ Opportunity by Above 50 hp Segment 2013 to 2022 and 2028
Figure 105: Latin America Dewatering Pumps Market: BPS Analysis by End Use – 2013, 2022 & 2028
Figure 106: Latin America Dewatering Pumps Market: Y-o-Y Growth Comparison by End Use, 2013 – 2028
Figure 107: Latin America Dewatering Pumps Market: Market Attractiveness by End-Use, 2013 – 2028
Figure 108: Latin America Dewatering Pumps Market Absolute $ Opportunity by Civic Infrastructure Construction Segment 2013 to 2022 and 2028
Figure 109: Latin America Dewatering Pumps Market Absolute $ Opportunity by Mining & Metals Segment 2013 to 2022 and 2028
Figure 110: Latin America Dewatering Pumps Market Absolute $ Opportunity by Paper & Pulp Segment 2013 to 2022 and 2028
Figure 111: Latin America Dewatering Pumps Market Absolute $ Opportunity by Chemicals Segment 2013 to 2022 and 2028
Figure 112: Latin America Dewatering Pumps Market Absolute $ Opportunity by Power Generation Segment 2013 to 2022 and 2028
Figure 113: Latin America Dewatering Pumps Market Absolute $ Opportunity by Food & Beverages Segment 2013 to 2022 and 2028
Figure 114: Latin America Dewatering Pumps Market Absolute $ Opportunity by Municipal Segment 2013 to 2022 and 2028
Figure 115: Latin America Dewatering Pumps Market Absolute $ Opportunity by Others Segment 2013 to 2022 and 2028
Figure 116: Western Europe Dewatering Pump Market Share and BPS Analysis By Country – 2013, 2022 & 2028
Figure 117: Western Europe Dewatering Pump Market Y-o-Y Growth Projections By Country, 2021-2028
Figure 118: Western Europe Dewatering Pump Market Attractiveness Analysis By Country, 2022-2028
Figure 119: Germany Dewatering Pump Market Absolute $ Opportunity 2013 to 2022 and 2028
Figure 120: France Dewatering Pump Market Absolute $ Opportunity 2013 to 2022 and 2028
Figure 121: Italy Dewatering Pump Market Absolute $ Opportunity 2013 to 2022 and 2028
Figure 122: Spain Dewatering Pump Market Absolute $ Opportunity 2013 to 2022 and 2028
Figure 123: U.K. Dewatering Pump Market Absolute $ Opportunity 2013 to 2022 and 2028
Figure 124: BENELUX Dewatering Pump Market Absolute $ Opportunity 2013 to 2022 and 2028
Figure 125: Rest of Western Europe Dewatering Pump Market Absolute $ Opportunity 2013 to 2022 and 2028
Figure 126: Western Europe Dewatering Pumps Market: BPS Analysis by Technology – 2013, 2022 & 2028
Figure 127: Western Europe Dewatering Pumps Market: Y-o-Y Growth Comparison by Technology, 2021 – 2028
Figure 128: Western Europe Dewatering Pumps Market: Market Attractiveness by Technology, 2022 – 2028
Figure 129: Western Europe Dewatering Pumps Market Absolute $ Opportunity by Positive Displacement Type Segment 2013 to 2022 and 2028
Figure 130: Western Europe Dewatering Pumps Market Absolute $ Opportunity by Centrifugal Type Segment 2013 to 2022 and 2028
Figure 131: Western Europe Dewatering Pumps Market: BPS Analysis by Product Type – 2013, 2022 & 2028
Figure 132: Western Europe Dewatering Pumps Market: Y-o-Y Growth Comparison by Product Type, 2021 – 2028
Figure 133: Western Europe Dewatering Pumps Market: Market Attractiveness by Product Type, 2022 – 2028
Figure 134: Western Europe Dewatering Pumps Market Absolute $ Opportunity by Sludge Pumps Segment 2013 to 2022 and 2028
Figure 135: Western Europe Dewatering Pumps Market Absolute $ Opportunity by Slurry Pumps Segment 2013 to 2022 and 2028
Figure 136: Western Europe Dewatering Pumps Market Absolute $ Opportunity by Drainage Pumps Segment 2013 to 2022 and 2028
Figure 137: Western Europe Dewatering Pumps Market Absolute $ Opportunity by Hybrid Pumps Segment 2013 to 2022 and 2028
Figure 138: Western Europe Dewatering Pumps Market: BPS Analysis by Capacity – 2013, 2022 & 2028
Figure 139: Western Europe Dewatering Pumps Market: Y-o-Y Growth Comparison by Capacity, 2021 – 2028
Figure 140: Western Europe Dewatering Pumps Market: Market Attractiveness by Capacity, 2022 – 2028
Figure 141: Western Europe Dewatering Pumps Market Absolute $ Opportunity by 0.5-3 hp Segment 2013 to 2022 and 2028
Figure 142: Western Europe Dewatering Pumps Market Absolute $ Opportunity by 3-10 hp Segment 2013 to 2022 and 2028
Figure 143: Western Europe Dewatering Pumps Market Absolute $ Opportunity by 10-50 hp Segment 2013 to 2022 and 2028
Figure 144: Western Europe Dewatering Pumps Market Absolute $ Opportunity by Above 50 hp Segment 2013 to 2022 and 2028
Figure 145: Western Europe Dewatering Pumps Market: BPS Analysis by End Use – 2013, 2022 & 2028
Figure 146: Western Europe Dewatering Pumps Market: Y-o-Y Growth Comparison by End Use, 2013 – 2028
Figure 147: Western Europe Dewatering Pumps Market: Market Attractiveness by End-Use, 2013 – 2028
Figure 148: Western Europe Dewatering Pumps Market Absolute $ Opportunity by Civic Infrastructure Construction Segment 2013 to 2022 and 2028
Figure 149: Western Europe Dewatering Pumps Market Absolute $ Opportunity by Mining & Metals Segment 2013 to 2022 and 2028
Figure 150: Western Europe Dewatering Pumps Market Absolute $ Opportunity by Paper & Pulp Segment 2013 to 2022 and 2028
Figure 151: Western Europe Dewatering Pumps Market Absolute $ Opportunity by Chemicals Segment 2013 to 2022 and 2028
Figure 152: Western Europe Dewatering Pumps Market Absolute $ Opportunity by Power Generation Segment 2013 to 2022 and 2028
Figure 153: Western Europe Dewatering Pumps Market Absolute $ Opportunity by Food & Beverages Segment 2013 to 2022 and 2028
Figure 154: Western Europe Dewatering Pumps Market Absolute $ Opportunity by Municipal Segment 2013 to 2022 and 2028
Figure 155: Western Europe Dewatering Pumps Market Absolute $ Opportunity by Others Segment 2013 to 2022 and 2028
Figure 156: Eastern Europe Dewatering Pump Market Share and BPS Analysis By Country – 2013, 2022 & 2028
Figure 157: Eastern Europe Dewatering Pump Market Y-o-Y Growth Projections By Country, 2021-2028
Figure 158: Eastern Europe Dewatering Pump Market Attractiveness Analysis By Country, 2022-2028
Figure 159: Russia Dewatering Pump Market Absolute $ Opportunity 2013 to 2022 and 2028
Figure 160: Poland Dewatering Pump Market Absolute $ Opportunity 2013 to 2022 and 2028
Figure 161: Rest of Eastern Europe Dewatering Pump Market Absolute $ Opportunity 2013 to 2022 and 2028
Figure 162: Eastern Europe Dewatering Pumps Market: BPS Analysis by Technology – 2013, 2022 & 2028
Figure 163: Eastern Europe Dewatering Pumps Market: Y-o-Y Growth Comparison by Technology, 2021 – 2028
Figure 164: Eastern Europe Dewatering Pumps Market: Market Attractiveness by Technology, 2022 – 2028
Figure 165: Eastern Europe Dewatering Pumps Market Absolute $ Opportunity by Positive Displacement Type Segment 2013 to 2022 and 2028
Figure 166: Eastern Europe Dewatering Pumps Market Absolute $ Opportunity by Centrifugal Type Segment 2013 to 2022 and 2028
Figure 167: Eastern Europe Dewatering Pumps Market: BPS Analysis by Product Type – 2013, 2022 & 2028
Figure 168: Eastern Europe Dewatering Pumps Market: Y-o-Y Growth Comparison by Product Type, 2021 – 2028
Figure 169: Eastern Europe Dewatering Pumps Market: Market Attractiveness by Product Type, 2022 – 2028
Figure 170: Eastern Europe Dewatering Pumps Market Absolute $ Opportunity by Sludge Pumps Segment 2013 to 2022 and 2028
Figure 171: Eastern Europe Dewatering Pumps Market Absolute $ Opportunity by Slurry Pumps Segment 2013 to 2022 and 2028
Figure 172: Eastern Europe Dewatering Pumps Market Absolute $ Opportunity by Drainage Pumps Segment 2013 to 2022 and 2028
Figure 173: Eastern Europe Dewatering Pumps Market Absolute $ Opportunity by Hybrid Pumps Segment 2013 to 2022 and 2028
Figure 174: Eastern Europe Dewatering Pumps Market: BPS Analysis by Capacity – 2013, 2022 & 2028
Figure 175: Eastern Europe Dewatering Pumps Market: Y-o-Y Growth Comparison by Capacity, 2021 – 2028
Figure 176: Eastern Europe Dewatering Pumps Market: Market Attractiveness by Capacity, 2022 – 2028
Figure 177: Eastern Europe Dewatering Pumps Market Absolute $ Opportunity by 0.5-3 hp Segment 2013 to 2022 and 2028
Figure 178: Eastern Europe Dewatering Pumps Market Absolute $ Opportunity by 3-10 hp Segment 2013 to 2022 and 2028
Figure 179: Eastern Europe Dewatering Pumps Market Absolute $ Opportunity by 10-50 hp Segment 2013 to 2022 and 2028
Figure 180: Eastern Europe Dewatering Pumps Market Absolute $ Opportunity by Above 50 hp Segment 2013 to 2022 and 2028
Figure 181: Eastern Europe Dewatering Pumps Market: BPS Analysis by End Use – 2013, 2022 & 2028
Figure 182: Eastern Europe Dewatering Pumps Market: Y-o-Y Growth Comparison by End Use, 2013 – 2028
Figure 183: Eastern Europe Dewatering Pumps Market: Market Attractiveness by End-Use, 2013 – 2028
Figure 184: Eastern Europe Dewatering Pumps Market Absolute $ Opportunity by Civic Infrastructure Construction Segment 2013 to 2022 and 2028
Figure 185: Eastern Europe Dewatering Pumps Market Absolute $ Opportunity by Mining & Metals Segment 2013 to 2022 and 2028
Figure 186: Eastern Europe Dewatering Pumps Market Absolute $ Opportunity by Paper & Pulp Segment 2013 to 2022 and 2028
Figure 187: Eastern Europe Dewatering Pumps Market Absolute $ Opportunity by Chemicals Segment 2013 to 2022 and 2028
Figure 188: Eastern Europe Dewatering Pumps Market Absolute $ Opportunity by Power Generation Segment 2013 to 2022 and 2028
Figure 189: Eastern Europe Dewatering Pumps Market Absolute $ Opportunity by Food & Beverages Segment 2013 to 2022 and 2028
Figure 190: Eastern Europe Dewatering Pumps Market Absolute $ Opportunity by Municipal Segment 2013 to 2022 and 2028
Figure 191: Eastern Europe Dewatering Pumps Market Absolute $ Opportunity by Others Segment 2013 to 2022 and 2028
Figure 192: MEA Dewatering Pump Market Share and BPS Analysis By Country – 2013, 2022 & 2028
Figure 193: MEA Dewatering Pump Market Y-o-Y Growth Projections By Country, 2021-2028
Figure 194: MEA Dewatering Pump Market Attractiveness Analysis By Country, 2022-2028
Figure 195: GCC Countries Dewatering Pump Market Absolute $ Opportunity 2013 to 2022 and 2028
Figure 196: Turkey Dewatering Pump Market Absolute $ Opportunity 2013 to 2022 and 2028
Figure 197: South Africa Dewatering Pump Market Absolute $ Opportunity 2013 to 2022 and 2028
Figure 198: Rest of MEA Dewatering Pump Market Absolute $ Opportunity 2013 to 2022 and 2028
Figure 199: MEA Dewatering Pumps Market: BPS Analysis by Technology – 2013, 2022 & 2028
Figure 200: MEA Dewatering Pumps Market: Y-o-Y Growth Comparison by Technology, 2021 – 2028
Figure 201: MEA Dewatering Pumps Market: Market Attractiveness by Technology, 2022 – 2028
Figure 202: MEA Dewatering Pumps Market Absolute $ Opportunity by Positive Displacement Type Segment 2013 to 2022 and 2028
Figure 203: MEA Dewatering Pumps Market Absolute $ Opportunity by Centrifugal Type Segment 2013 to 2022 and 2028
Figure 204: MEA Dewatering Pumps Market: BPS Analysis by Product Type – 2013, 2022 & 2028
Figure 205: MEA Dewatering Pumps Market: Y-o-Y Growth Comparison by Product Type, 2021 – 2028
Figure 206: MEA Dewatering Pumps Market: Market Attractiveness by Product Type, 2022 – 2028
Figure 207: MEA Dewatering Pumps Market Absolute $ Opportunity by Sludge Pumps Segment 2013 to 2022 and 2028
Figure 208: MEA Dewatering Pumps Market Absolute $ Opportunity by Slurry Pumps Segment 2013 to 2022 and 2028
Figure 209: MEA Dewatering Pumps Market Absolute $ Opportunity by Hybrid Pumps Segment 2013 to 2022 and 2028
Figure 210: MEA Dewatering Pumps Market: BPS Analysis by Capacity – 2013, 2022 & 2028
Figure 211: MEA Dewatering Pumps Market: Y-o-Y Growth Comparison by Capacity, 2021 – 2028
Figure 212: MEA Dewatering Pumps Market: Market Attractiveness by Capacity, 2022 – 2028
Figure 213: MEA Dewatering Pumps Market Absolute $ Opportunity by 0.5-3 hp Segment 2013 to 2022 and 2028
Figure 214: MEA Dewatering Pumps Market Absolute $ Opportunity by 3-10 hp Segment 2013 to 2022 and 2028
Figure 215: MEA Dewatering Pumps Market Absolute $ Opportunity by 10-50 hp Segment 2013 to 2022 and 2028
Figure 216: MEA Dewatering Pumps Market Absolute $ Opportunity by Above 50 hp Segment 2013 to 2022 and 2028
Figure 217: MEA Dewatering Pumps Market: BPS Analysis by End Use – 2013, 2022 & 2028
Figure 218: MEA Dewatering Pumps Market: Y-o-Y Growth Comparison by End Use, 2013 – 2028
Figure 219: MEA Dewatering Pumps Market: Market Attractiveness by End-Use, 2013 – 2028
Figure 220: MEA Dewatering Pumps Market Absolute $ Opportunity by Civic Infrastructure Construction Segment 2013 to 2022 and 2028
Figure 221: MEA Dewatering Pumps Market Absolute $ Opportunity by Mining & Metals Segment 2013 to 2022 and 2028
Figure 222: MEA Dewatering Pumps Market Absolute $ Opportunity by Paper & Pulp Segment 2013 to 2022 and 2028
Figure 223: MEA Dewatering Pumps Market Absolute $ Opportunity by Chemicals Segment 2013 to 2022 and 2028
Figure 224: MEA Dewatering Pumps Market Absolute $ Opportunity by Power Generation Segment 2013 to 2022 and 2028
Figure 225: MEA Dewatering Pumps Market Absolute $ Opportunity by Food & Beverages Segment 2013 to 2022 and 2028
Figure 226: MEA Dewatering Pumps Market Absolute $ Opportunity by Municipal Segment 2013 to 2022 and 2028
Figure 227: MEA Dewatering Pumps Market Absolute $ Opportunity by Others Segment 2013 to 2022 and 2028
Figure 228: China Dewatering Pumps Market: BPS Analysis by Technology – 2013, 2022 & 2028
Figure 229: China Dewatering Pumps Market: Y-o-Y Growth Comparison by Technology, 2021 – 2028
Figure 230: China Dewatering Pumps Market: Market Attractiveness by Technology, 2022 – 2028
Figure 231: China Dewatering Pumps Market Absolute $ Opportunity by Positive Displacement Type Segment 2013 to 2022 and 2028
Figure 232: Dewatering Pumps Market Absolute $ Opportunity by Centrifugal Type Segment 2013 to 2022 and 2028
Figure 233: China Dewatering Pumps Market: BPS Analysis by Product Type – 2013, 2022 & 2028
Figure 234: China Dewatering Pumps Market: Y-o-Y Growth Comparison by Product Type, 2021 – 2028
Figure 235: China Dewatering Pumps Market: Market Attractiveness by Product Type, 2022 – 2028
Figure 236: China Dewatering Pumps Market Absolute $ Opportunity by Sludge Pumps Segment 2013 to 2022 and 2028
Figure 237: China Dewatering Pumps Market Absolute $ Opportunity by Slurry Pumps Segment 2013 to 2022 and 2028
Figure 238: China Dewatering Pumps Market Absolute $ Opportunity by Drainage Pumps Segment 2013 to 2022 and 2028
Figure 239: China Dewatering Pumps Market Absolute $ Opportunity by Hybrid Pumps Segment 2013 to 2022 and 2028
Figure 240: China Dewatering Pumps Market: BPS Analysis by Capacity – 2013, 2022 & 2028
Figure 241: China Dewatering Pumps Market: Y-o-Y Growth Comparison by Capacity, 2021 – 2028
Figure 242: China Dewatering Pumps Market: Market Attractiveness by Capacity, 2022 – 2028
Figure 243: China Dewatering Pumps Market Absolute $ Opportunity by 0.5-3 hp Segment 2013 to 2022 and 2028
Figure 244: China Dewatering Pumps Market Absolute $ Opportunity by 3-10 hp Segment 2013 to 2022 and 2028
Figure 245: China Dewatering Pumps Market Absolute $ Opportunity by 10-50 hp Segment 2013 to 2022 and 2028
Figure 246: China Dewatering Pumps Market Absolute $ Opportunity by Above 50 hp Segment 2013 to 2022 and 2028
Figure 247: China Dewatering Pumps Market: BPS Analysis by End Use – 2013, 2022 & 2028
Figure 248: China Dewatering Pumps Market: Y-o-Y Growth Comparison by End Use, 2013 – 2028
Figure 249: China Dewatering Pumps Market: Market Attractiveness by End-Use, 2013 – 2028
Figure 250: China Dewatering Pumps Market Absolute $ Opportunity by Civic Infrastructure Construction Segment 2013 to 2022 and 2028
Figure 251: China Dewatering Pumps Market Absolute $ Opportunity by Mining & Metals Segment 2013 to 2022 and 2028
Figure 252: China Dewatering Pumps Market Absolute $ Opportunity by Paper & Pulp Segment 2013 to 2022 and 2028
Figure 253: China Dewatering Pumps Market Absolute $ Opportunity by Chemicals Segment 2013 to 2022 and 2028
Figure 254: China Dewatering Pumps Market Absolute $ Opportunity by Power Generation Segment 2013 to 2022 and 2028
Figure 255: China Dewatering Pumps Market Absolute $ Opportunity by Food & Beverages Segment 2013 to 2022 and 2028
Figure 256: China Dewatering Pumps Market Absolute $ Opportunity by Municipal Segment 2013 to 2022 and 2028
Figure 257: China Dewatering Pumps Market Absolute $ Opportunity by Others Segment 2013 to 2022 and 2028
Figure 258: SEA & Pacific Dewatering Pump Market Share and BPS Analysis By Country – 2013, 2022 & 2028
Figure 259: SEA & Pacific Dewatering Pump Market Y-o-Y Growth Projections By Country, 2021-2028
Figure 260: SEA & Pacific Dewatering Pump Market Attractiveness Analysis By Country, 2022-2028
Figure 261: Indonesia Dewatering Pump Market Absolute $ Opportunity 2013 to 2022 and 2028
Figure 262: Philippines Dewatering Pump Market Absolute $ Opportunity 2013 to 2022 and 2028
Figure 263: Thailand Dewatering Pump Market Absolute $ Opportunity 2013 to 2022 and 2028
Figure 264: Malaysia Dewatering Pump Market Absolute $ Opportunity 2013 to 2022 and 2028
Figure 265: Oceania Dewatering Pump Market Absolute $ Opportunity 2013 to 2022 and 2028
Figure 266: Poland Dewatering Pump Market Absolute $ Opportunity 2013 to 2022 and 2028
Figure 267: SEA & Pacific Dewatering Pumps Market: BPS Analysis by Technology – 2013, 2022 & 2028
Figure 268: SEA & Pacific Dewatering Pumps Market: Y-o-Y Growth Comparison by Technology, 2021 – 2028
Figure 269: SEA & Pacific Dewatering Pumps Market: Market Attractiveness by Technology, 2022 – 2028
Figure 270: SEA & Pacific Dewatering Pumps Market Absolute $ Opportunity by Positive Displacement Type Segment 2013 to 2022 and 2028
Figure 271: SEA & Pacific Dewatering Pumps Market Absolute $ Opportunity by Centrifugal Type Segment 2013 to 2022 and 2028
Figure 272: SEA & Pacific Dewatering Pumps Market: BPS Analysis by Product Type – 2013, 2022 & 2028
Figure 273: SEA & Pacific Dewatering Pumps Market: Y-o-Y Growth Comparison by Product Type, 2021 – 2028
Figure 274: SEA & Pacific Dewatering Pumps Market: Market Attractiveness by Product Type, 2022 – 2028
Figure 275: SEA & Pacific Dewatering Pumps Market Absolute $ Opportunity by Sludge Pumps Segment 2013 to 2022 and 2028
Figure 276: SEA & Pacific Dewatering Pumps Market Absolute $ Opportunity by Slurry Pumps Segment 2013 to 2022 and 2028
Figure 277: SEA & Pacific Dewatering Pumps Market Absolute $ Opportunity by Drainage Pumps Segment 2013 to 2022 and 2028
Figure 278: SEA & Pacific Dewatering Pumps Market Absolute $ Opportunity by Hybrid Pumps Segment 2013 to 2022 and 2028
Figure 279: SEA & Pacific Dewatering Pumps Market: BPS Analysis by Capacity – 2013, 2022 & 2028
Figure 280: SEA & Pacific Dewatering Pumps Market: Y-o-Y Growth Comparison by Capacity, 2021 – 2028
Figure 281: SEA & Pacific Dewatering Pumps Market: Market Attractiveness by Capacity, 2022 – 2028
Figure 282: SEA & Pacific Dewatering Pumps Market Absolute $ Opportunity by 0.5-3 hp Segment 2013 to 2022 and 2028
Figure 283: SEA & Pacific Dewatering Pumps Market Absolute $ Opportunity by 3-10 hp Segment 2013 to 2022 and 2028
Figure 284: SEA & Pacific Dewatering Pumps Market Absolute $ Opportunity by 10-50 hp Segment 2013 to 2022 and 2028
Figure 285: SEA & Pacific Dewatering Pumps Market Absolute $ Opportunity by Above 50 hp Segment 2013 to 2022 and 2028
Figure 286: SEA & Pacific Dewatering Pumps Market: BPS Analysis by End Use – 2013, 2022 & 2028
Figure 287: SEA & Pacific Dewatering Pumps Market: Y-o-Y Growth Comparison by End Use, 2013 – 2028
Figure 288: SEA & Pacific Dewatering Pumps Market: Market Attractiveness by End-Use, 2013 – 2028
Figure 289: SEA & Pacific Dewatering Pumps Market Absolute $ Opportunity by Civic Infrastructure Construction Segment 2013 to 2022 and 2028
Figure 290: SEA & Pacific Dewatering Pumps Market Absolute $ Opportunity by Mining & Metals Segment 2013 to 2022 and 2028
Figure 291: SEA & Pacific Dewatering Pumps Market Absolute $ Opportunity by Paper & Pulp Segment 2013 to 2022 and 2028
Figure 292: SEA & Pacific Dewatering Pumps Market Absolute $ Opportunity by Chemicals Segment 2013 to 2022 and 2028
Figure 293: SEA & Pacific Dewatering Pumps Market Absolute $ Opportunity by Power Generation Segment 2013 to 2022 and 2028
Figure 294: SEA & Pacific Dewatering Pumps Market Absolute $ Opportunity by Food & Beverages Segment 2013 to 2022 and 2028
Figure 295: SEA & Pacific Dewatering Pumps Market Absolute $ Opportunity by Municipal Segment 2013 to 2022 and 2028
Figure 296: SEA & Pacific Dewatering Pumps Market Absolute $ Opportunity by Others Segment 2013 to 2022 and 2028
Figure 297: India Dewatering Pumps Market: BPS Analysis by Technology – 2013,
Figure 298: India Dewatering Pumps Market: Y-o-Y Growth Comparison by Technology,
Figure 299: India Dewatering Pumps Market: Market Attractiveness by Technology,
Figure 300: India Dewatering Pumps Market Absolute $ Opportunity by Positive Displacement Type Segment 2013 to 2022 and 2028
Figure 301: India Dewatering Pumps Market Absolute $ Opportunity by Centrifugal Type Segment 2013 to 2022 and 2028
Figure 302: India Dewatering Pumps Market: BPS Analysis by Product Type – 2013, 2022 & 2028
Figure 303: India Dewatering Pumps Market: Y-o-Y Growth Comparison by Product Type, 2021 – 2028
Figure 304: India Dewatering Pumps Market: Market Attractiveness by Product Type, 2022 – 2028
Figure 305: India Dewatering Pumps Market Absolute $ Opportunity by Sludge Pumps Segment 2013 to 2022 and 2028
Figure 306: India Dewatering Pumps Market Absolute $ Opportunity by Slurry Pumps Segment 2013 to 2022 and 2028
Figure 307: India Dewatering Pumps Market Absolute $ Opportunity by Drainage Pumps Segment 2013 to 2022 and 2028
Figure 308: India Dewatering Pumps Market Absolute $ Opportunity by Hybrid Pumps Segment 2013 to 2022 and 2028
Figure 309: India Dewatering Pumps Market: BPS Analysis by Capacity – 2013, 2022 & 2028
Figure 310: India Dewatering Pumps Market: Y-o-Y Growth Comparison by Capacity, 2021 – 2028
Figure 311: India Dewatering Pumps Market: Market Attractiveness by Capacity, 2022 – 2028
Figure 312: India Dewatering Pumps Market Absolute $ Opportunity by 0.5-3 hp Segment 2013 to 2022 and 2028
Figure 313: India Dewatering Pumps Market Absolute $ Opportunity by 3-10 hp Segment 2013 to 2022 and 2028
Figure 314: India Dewatering Pumps Market Absolute $ Opportunity by 10-50 hp Segment 2013 to 2022 and 2028
Figure 315: India Dewatering Pumps Market Absolute $ Opportunity by Above 50 hp Segment 2013 to 2022 and 2028
Figure 316: India Dewatering Pumps Market: BPS Analysis by End Use – 2013, 2022 & 2028
Figure 317: India Dewatering Pumps Market: Y-o-Y Growth Comparison by End Use, 2013 – 2028
Figure 318: India Dewatering Pumps Market: Market Attractiveness by End-Use, 2013 – 2028
Figure 319: India Dewatering Pumps Market Absolute $ Opportunity by Civic Infrastructure Construction Segment 2013 to 2022 and 2028
Figure 320: India Dewatering Pumps Market Absolute $ Opportunity by Mining & Metals Segment 2013 to 2022 and 2028
Figure 321: India Dewatering Pumps Market Absolute $ Opportunity by Paper & Pulp Segment 2013 to 2022 and 2028
Figure 322: India Dewatering Pumps Market Absolute $ Opportunity by Chemicals Segment 2013 to 2022 and 2028
Figure 323: India Dewatering Pumps Market Absolute $ Opportunity by Power Generation Segment 2013 to 2022 and 2028
Figure 324: India Dewatering Pumps Market Absolute $ Opportunity by Food & Beverages Segment 2013 to 2022 and 2028
Figure 325: India Dewatering Pumps Market Absolute $ Opportunity by Municipal Segment 2013 to 2022 and 2028
Figure 326: India Dewatering Pumps Market Absolute $ Opportunity by Others Segment 2013 to 2022 and 2028
Figure 327: Japan Dewatering Pumps Market: BPS Analysis by Technology – 2013, 2022 & 2028
Figure 328: Japan Dewatering Pumps Market: Y-o-Y Growth Comparison by Technology, 2021 – 2028
Figure 329: Japan Dewatering Pumps Market: Market Attractiveness by Technology, 2022 – 2028
Figure 330: Japan Dewatering Pumps Market Absolute $ Opportunity by Positive Displacement Type Segment 2013 to 2022 and 2028
Figure 331: Japan Dewatering Pumps Market Absolute $ Opportunity by Centrifugal Type Segment 2013 to 2022 and 2028
Figure 332: Japan Dewatering Pumps Market: BPS Analysis by Product Type – 2013, 2022 & 2028
Figure 333: Japan Dewatering Pumps Market: Y-o-Y Growth Comparison by Product Type, 2021 – 2028
Figure 334: Japan Dewatering Pumps Market: Market Attractiveness by Product Type, 2022 – 2028
Figure 335: Japan Dewatering Pumps Market Absolute $ Opportunity by Sludge Pumps Segment 2013 to 2022 and 2028
Figure 336: Japan Dewatering Pumps Market Absolute $ Opportunity by Slurry Pumps Segment 2013 to 2022 and 2028
Figure 337: Japan Dewatering Pumps Market Absolute $ Opportunity by Drainage Pumps Segment 2013 to 2022 and 2028
Figure 338: Japan Dewatering Pumps Market Absolute $ Opportunity by Hybrid Pumps Segment 2013 to 2022 and 2028
Figure 339: Japan Dewatering Pumps Market: BPS Analysis by Capacity – 2013, 2022 & 2028
Figure 340: Japan Dewatering Pumps Market: Y-o-Y Growth Comparison by Capacity, 2021 – 2028
Figure 341: Japan Dewatering Pumps Market: Market Attractiveness by Capacity, 2022 – 2028
Figure 342: Japan Dewatering Pumps Market Absolute $ Opportunity by 0.5-3 hp Segment 2013 to 2022 and 2028
Figure 343: Japan Dewatering Pumps Market Absolute $ Opportunity by 3-10 hp Segment 2013 to 2022 and 2028
Figure 344: Japan Dewatering Pumps Market Absolute $ Opportunity by 10-50 hp Segment 2013 to 2022 and 2028
Figure 345: Japan Dewatering Pumps Market Absolute $ Opportunity by above 50 hp Segment 2013 to 2022 and 2028
Figure 346: Japan Dewatering Pumps Market: BPS Analysis by End Use – 2013, 2022 & 2028
Figure 347: Japan Dewatering Pumps Market: Y-o-Y Growth Comparison by End Use, 2013 – 2028
Figure 348: Japan Dewatering Pumps Market: Market Attractiveness by End-Use, 2013 – 2028
Figure 349: Japan Dewatering Pumps Market Absolute $ Opportunity by Civic Infrastructure Construction Segment 2013 to 2022 and 2028
Figure 350: Japan Dewatering Pumps Market Absolute $ Opportunity by Mining & Metals Segment 2013 to 2022 and 2028
Figure 351: Japan Dewatering Pumps Market Absolute $ Opportunity by Paper & Pulp Segment 2013 to 2022 and 2028
Figure 352: Japan Dewatering Pumps Market Absolute $ Opportunity by Chemicals Segment 2013 to 2022 and 2028
Figure 353: Japan Dewatering Pumps Market Absolute $ Opportunity by Power Generation Segment 2013 to 2022 and 2028
Figure 354: Japan Dewatering Pumps Market Absolute $ Opportunity by Food & Beverages Segment 2013 to 2022 and 2028
Figure 355: Japan Dewatering Pumps Market Absolute $ Opportunity by Municipal Segment 2013 to 2022 and 2028
Figure 356: Japan Dewatering Pumps Market Absolute $ Opportunity by Others Segment 2013 to 2022 and 2028
Need specific information?
Request CustomizationExplore Industrial Automation Insights
View Reports