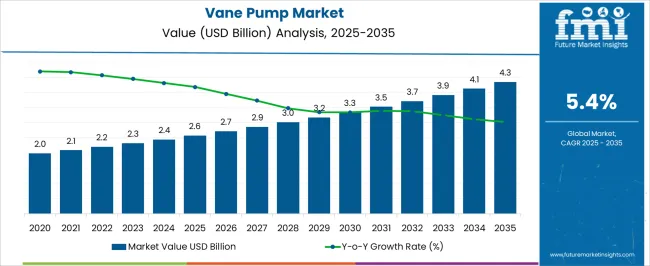
The vane pump market is estimated to be USD 2,442.4 million in 2024. In 2023, the market size was USD 2,311.1 million. The market is expected to progress at a CAGR of 5.6% from 2024 to 2034. By 2034, the vane pump market is anticipated to be valued at USD 4,292.1 million.
Global Vane Pump Market Trends
Attributes | Details |
---|---|
Vane Pump Market Size, 2024 | USD 2,442.4 million |
Projected Market Value, 2034 | USD 4,292.1 million |
Value-based CAGR (2024 to 2034) | 5.6% |
The vane pump market valuation was USD 1,844.5 million in 2019. During the historical period from 2019 to 2023, the market grew at a CAGR of 5.8%.
The adoption of vane pumps in industries continued to accelerate during the historical period. As positive displacement found more of a place in industries, vane pumps had a positive outlook. The growth of the automobile and aerospace industries over the historical period also contributed to the growth of the market. The market value reached USD 2,311.1 million by 2023.
Market Valuation (2019) | USD 1,844.5 million |
---|---|
Historical CAGR (2019 to 2023) | 5.8% |
Historical Market Valuation (2023) | USD 2,311.1 million |
For 2024, the value of the vane pump market is estimated at USD 2,442.4 million. During the period from 2024 to 2034, the market is expected to progress at a CAGR of 5.6%.
The easy-to-handle and easy-to-operate features of vane pumps make the machine viable for several industrial processes. With positive displacement equipment’s popularity set to continue over the forecast period, vane pumps are also set to find greater industrial use. The rise of industrialization is expected to positively affect the vane pump market.
However, the presence of numerous alternatives like gear pumps and piston pumps are set to restrict the pace of progress in the market. The market is projected to reach USD 4,292.1 million by the end of the forecast period.
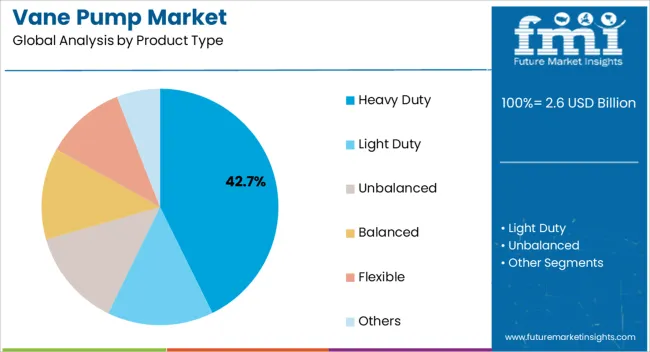
Industrialists are inclined toward the heavy duty subset when it comes to vane pumps. In 2024, heavy duty vane pumps are estimated to hold 32.0% of the market share by product type.
Ease of handling regarding heavy duty vane pumps starts from the installment itself. The machine is easy to install, and when working, it provides operational ease to end-users too. Thus, heavy duty vane pumps are popular in the market.
Attributes | Details |
---|---|
Top Product Type | Heavy Duty |
Market Share in 2024 | 32.0% |
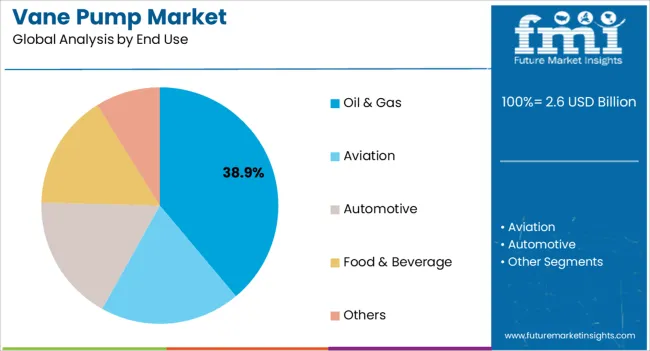
Vane pumps are widely employed in the aviation industry. For 2024, the aviation segment is anticipated to hold 24.0% of the market share by end-use industry.
Vane pumps have numerous applications in planes. Vane pumps are used in braking systems for all kinds of planes. As the size of the plane gets bigger, the hydraulic system required also increases. Thus, bigger planes have a bigger need for vane pumps. Therefore, the aviation industry is representing a significant end-user base for vane pumps.
Attributes | Details |
---|---|
Top End-use Industry | Aviation |
Market Share in 2024 | 24.0% |
Rising industrialization in Asia Pacific, especially in China and India, is propelling the demand for vane pumps. As a result, Asia Pacific represents significant opportunities for market players.
Europe is another region with potential for market growth. Europe drives the global market demand due to the wide acceptance of hydraulic systems in the region.
Countries | CAGR (2024 to 2034) |
---|---|
United States | 5.2% |
Australia | 5.3% |
United Kingdom | 5.2% |
India | 6.3% |
China | 6.1% |
India is anticipated to be one of the fastest-growing countries in the market. The CAGR for the market in India is marked at a promising 6.3% from 2024 to 2034.
Government initiatives have broadened the scope of industrialization in India. For example, the ‘Make in India’ initiative has helped industries to grow in the country. Market players such as HHV Pumps have taken advantage of the initiative to expand facilities. Thus, the market is getting propelled in India.
China is not far behind India when it comes to Asian countries with regard to the progress of the market. The CAGR for the market in China is pegged at an encouraging 6.1% over the forecast period.
With rapid advancements in the automobile and aviation industries, the adoption of hydraulic systems is increasing in China. Thus, the market is expected to have bright prospects in China.
Various industrial plants for renewable energy are dotting the Australian landscape. With an increasing focus on renewable energy as one of the emerging sectors, demand for vane pumps is rising in Australia and is thus rife with opportunity for the market. The CAGR for Australia over the forecast period is pegged at a solid 5.3%.
In the United Kingdom, the demand for sliding vane pumps is increasing. Manufacturers are paying attention by developing new technologies in sliding vane pumps. Thus, there is an increase both in the production and in the use of sliding vane pumps in the United Kingdom. For the forecast period, the United Kingdom market is pegged to register a reasonable CAGR of 5.2%.
In the United States, pumps and pump systems are viewed positively by industries and regulatory bodies. For example, the ‘Pump Systems Matter’ program has been developed by the Hydraulic Institute in the United States. Vane pumps, too, are benefitting due to the positive outlook towards pumps. Over the forecast period, it is predicted the market will register a sturdy CAGR of 5.2%
Efficiency and low noise levels are two of the important aspects that appeal to end-users while purchasing vane pumps. Manufacturers are further trying to improve efficiency and reduce the noise levels to make vane pumps even more appealing. The help of technology is being sought to meet the dual objectives.
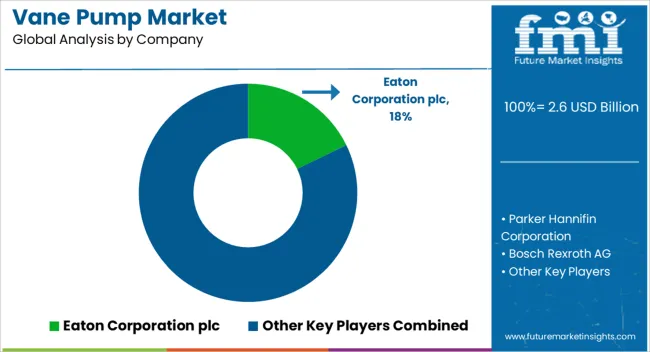
The market for vane pumps is highly competitive. Several well-established companies compete with local players to gain higher profits. Expanding into untapped regions is a common concern among many of the higher-end players.
Recent Developments in the Vane Pump Market
Table 1: Global Market Value (US$ Million) Forecast by Region, 2019 to 2034
Table 2: Global Market Volume (Units) Forecast by Region, 2019 to 2034
Table 3: Global Market Value (US$ Million) Forecast by Type, 2019 to 2034
Table 4: Global Market Volume (Units) Forecast by Type, 2019 to 2034
Table 5: Global Market Value (US$ Million) Forecast by Component, 2019 to 2034
Table 6: Global Market Volume (Units) Forecast by Component, 2019 to 2034
Table 7: Global Market Value (US$ Million) Forecast by End-Users, 2019 to 2034
Table 8: Global Market Volume (Units) Forecast by End-Users, 2019 to 2034
Table 9: North America Market Value (US$ Million) Forecast by Country, 2019 to 2034
Table 10: North America Market Volume (Units) Forecast by Country, 2019 to 2034
Table 11: North America Market Value (US$ Million) Forecast by Type, 2019 to 2034
Table 12: North America Market Volume (Units) Forecast by Type, 2019 to 2034
Table 13: North America Market Value (US$ Million) Forecast by Component, 2019 to 2034
Table 14: North America Market Volume (Units) Forecast by Component, 2019 to 2034
Table 15: North America Market Value (US$ Million) Forecast by End-Users, 2019 to 2034
Table 16: North America Market Volume (Units) Forecast by End-Users, 2019 to 2034
Table 17: Latin America Market Value (US$ Million) Forecast by Country, 2019 to 2034
Table 18: Latin America Market Volume (Units) Forecast by Country, 2019 to 2034
Table 19: Latin America Market Value (US$ Million) Forecast by Type, 2019 to 2034
Table 20: Latin America Market Volume (Units) Forecast by Type, 2019 to 2034
Table 21: Latin America Market Value (US$ Million) Forecast by Component, 2019 to 2034
Table 22: Latin America Market Volume (Units) Forecast by Component, 2019 to 2034
Table 23: Latin America Market Value (US$ Million) Forecast by End-Users, 2019 to 2034
Table 24: Latin America Market Volume (Units) Forecast by End-Users, 2019 to 2034
Table 25: Western Europe Market Value (US$ Million) Forecast by Country, 2019 to 2034
Table 26: Western Europe Market Volume (Units) Forecast by Country, 2019 to 2034
Table 27: Western Europe Market Value (US$ Million) Forecast by Type, 2019 to 2034
Table 28: Western Europe Market Volume (Units) Forecast by Type, 2019 to 2034
Table 29: Western Europe Market Value (US$ Million) Forecast by Component, 2019 to 2034
Table 30: Western Europe Market Volume (Units) Forecast by Component, 2019 to 2034
Table 31: Western Europe Market Value (US$ Million) Forecast by End-Users, 2019 to 2034
Table 32: Western Europe Market Volume (Units) Forecast by End-Users, 2019 to 2034
Table 33: Eastern Europe Market Value (US$ Million) Forecast by Country, 2019 to 2034
Table 34: Eastern Europe Market Volume (Units) Forecast by Country, 2019 to 2034
Table 35: Eastern Europe Market Value (US$ Million) Forecast by Type, 2019 to 2034
Table 36: Eastern Europe Market Volume (Units) Forecast by Type, 2019 to 2034
Table 37: Eastern Europe Market Value (US$ Million) Forecast by Component, 2019 to 2034
Table 38: Eastern Europe Market Volume (Units) Forecast by Component, 2019 to 2034
Table 39: Eastern Europe Market Value (US$ Million) Forecast by End-Users, 2019 to 2034
Table 40: Eastern Europe Market Volume (Units) Forecast by End-Users, 2019 to 2034
Table 41: South Asia and Pacific Market Value (US$ Million) Forecast by Country, 2019 to 2034
Table 42: South Asia and Pacific Market Volume (Units) Forecast by Country, 2019 to 2034
Table 43: South Asia and Pacific Market Value (US$ Million) Forecast by Type, 2019 to 2034
Table 44: South Asia and Pacific Market Volume (Units) Forecast by Type, 2019 to 2034
Table 45: South Asia and Pacific Market Value (US$ Million) Forecast by Component, 2019 to 2034
Table 46: South Asia and Pacific Market Volume (Units) Forecast by Component, 2019 to 2034
Table 47: South Asia and Pacific Market Value (US$ Million) Forecast by End-Users, 2019 to 2034
Table 48: South Asia and Pacific Market Volume (Units) Forecast by End-Users, 2019 to 2034
Table 49: East Asia Market Value (US$ Million) Forecast by Country, 2019 to 2034
Table 50: East Asia Market Volume (Units) Forecast by Country, 2019 to 2034
Table 51: East Asia Market Value (US$ Million) Forecast by Type, 2019 to 2034
Table 52: East Asia Market Volume (Units) Forecast by Type, 2019 to 2034
Table 53: East Asia Market Value (US$ Million) Forecast by Component, 2019 to 2034
Table 54: East Asia Market Volume (Units) Forecast by Component, 2019 to 2034
Table 55: East Asia Market Value (US$ Million) Forecast by End-Users, 2019 to 2034
Table 56: East Asia Market Volume (Units) Forecast by End-Users, 2019 to 2034
Table 57: Middle East and Africa Market Value (US$ Million) Forecast by Country, 2019 to 2034
Table 58: Middle East and Africa Market Volume (Units) Forecast by Country, 2019 to 2034
Table 59: Middle East and Africa Market Value (US$ Million) Forecast by Type, 2019 to 2034
Table 60: Middle East and Africa Market Volume (Units) Forecast by Type, 2019 to 2034
Table 61: Middle East and Africa Market Value (US$ Million) Forecast by Component, 2019 to 2034
Table 62: Middle East and Africa Market Volume (Units) Forecast by Component, 2019 to 2034
Table 63: Middle East and Africa Market Value (US$ Million) Forecast by End-Users, 2019 to 2034
Table 64: Middle East and Africa Market Volume (Units) Forecast by End-Users, 2019 to 2034
Figure 1: Global Market Value (US$ Million) by Type, 2024 to 2034
Figure 2: Global Market Value (US$ Million) by Component, 2024 to 2034
Figure 3: Global Market Value (US$ Million) by End-Users, 2024 to 2034
Figure 4: Global Market Value (US$ Million) by Region, 2024 to 2034
Figure 5: Global Market Value (US$ Million) Analysis by Region, 2019 to 2034
Figure 6: Global Market Volume (Units) Analysis by Region, 2019 to 2034
Figure 7: Global Market Value Share (%) and BPS Analysis by Region, 2024 to 2034
Figure 8: Global Market Y-o-Y Growth (%) Projections by Region, 2024 to 2034
Figure 9: Global Market Value (US$ Million) Analysis by Type, 2019 to 2034
Figure 10: Global Market Volume (Units) Analysis by Type, 2019 to 2034
Figure 11: Global Market Value Share (%) and BPS Analysis by Type, 2024 to 2034
Figure 12: Global Market Y-o-Y Growth (%) Projections by Type, 2024 to 2034
Figure 13: Global Market Value (US$ Million) Analysis by Component, 2019 to 2034
Figure 14: Global Market Volume (Units) Analysis by Component, 2019 to 2034
Figure 15: Global Market Value Share (%) and BPS Analysis by Component, 2024 to 2034
Figure 16: Global Market Y-o-Y Growth (%) Projections by Component, 2024 to 2034
Figure 17: Global Market Value (US$ Million) Analysis by End-Users, 2019 to 2034
Figure 18: Global Market Volume (Units) Analysis by End-Users, 2019 to 2034
Figure 19: Global Market Value Share (%) and BPS Analysis by End-Users, 2024 to 2034
Figure 20: Global Market Y-o-Y Growth (%) Projections by End-Users, 2024 to 2034
Figure 21: Global Market Attractiveness by Type, 2024 to 2034
Figure 22: Global Market Attractiveness by Component, 2024 to 2034
Figure 23: Global Market Attractiveness by End-Users, 2024 to 2034
Figure 24: Global Market Attractiveness by Region, 2024 to 2034
Figure 25: North America Market Value (US$ Million) by Type, 2024 to 2034
Figure 26: North America Market Value (US$ Million) by Component, 2024 to 2034
Figure 27: North America Market Value (US$ Million) by End-Users, 2024 to 2034
Figure 28: North America Market Value (US$ Million) by Country, 2024 to 2034
Figure 29: North America Market Value (US$ Million) Analysis by Country, 2019 to 2034
Figure 30: North America Market Volume (Units) Analysis by Country, 2019 to 2034
Figure 31: North America Market Value Share (%) and BPS Analysis by Country, 2024 to 2034
Figure 32: North America Market Y-o-Y Growth (%) Projections by Country, 2024 to 2034
Figure 33: North America Market Value (US$ Million) Analysis by Type, 2019 to 2034
Figure 34: North America Market Volume (Units) Analysis by Type, 2019 to 2034
Figure 35: North America Market Value Share (%) and BPS Analysis by Type, 2024 to 2034
Figure 36: North America Market Y-o-Y Growth (%) Projections by Type, 2024 to 2034
Figure 37: North America Market Value (US$ Million) Analysis by Component, 2019 to 2034
Figure 38: North America Market Volume (Units) Analysis by Component, 2019 to 2034
Figure 39: North America Market Value Share (%) and BPS Analysis by Component, 2024 to 2034
Figure 40: North America Market Y-o-Y Growth (%) Projections by Component, 2024 to 2034
Figure 41: North America Market Value (US$ Million) Analysis by End-Users, 2019 to 2034
Figure 42: North America Market Volume (Units) Analysis by End-Users, 2019 to 2034
Figure 43: North America Market Value Share (%) and BPS Analysis by End-Users, 2024 to 2034
Figure 44: North America Market Y-o-Y Growth (%) Projections by End-Users, 2024 to 2034
Figure 45: North America Market Attractiveness by Type, 2024 to 2034
Figure 46: North America Market Attractiveness by Component, 2024 to 2034
Figure 47: North America Market Attractiveness by End-Users, 2024 to 2034
Figure 48: North America Market Attractiveness by Country, 2024 to 2034
Figure 49: Latin America Market Value (US$ Million) by Type, 2024 to 2034
Figure 50: Latin America Market Value (US$ Million) by Component, 2024 to 2034
Figure 51: Latin America Market Value (US$ Million) by End-Users, 2024 to 2034
Figure 52: Latin America Market Value (US$ Million) by Country, 2024 to 2034
Figure 53: Latin America Market Value (US$ Million) Analysis by Country, 2019 to 2034
Figure 54: Latin America Market Volume (Units) Analysis by Country, 2019 to 2034
Figure 55: Latin America Market Value Share (%) and BPS Analysis by Country, 2024 to 2034
Figure 56: Latin America Market Y-o-Y Growth (%) Projections by Country, 2024 to 2034
Figure 57: Latin America Market Value (US$ Million) Analysis by Type, 2019 to 2034
Figure 58: Latin America Market Volume (Units) Analysis by Type, 2019 to 2034
Figure 59: Latin America Market Value Share (%) and BPS Analysis by Type, 2024 to 2034
Figure 60: Latin America Market Y-o-Y Growth (%) Projections by Type, 2024 to 2034
Figure 61: Latin America Market Value (US$ Million) Analysis by Component, 2019 to 2034
Figure 62: Latin America Market Volume (Units) Analysis by Component, 2019 to 2034
Figure 63: Latin America Market Value Share (%) and BPS Analysis by Component, 2024 to 2034
Figure 64: Latin America Market Y-o-Y Growth (%) Projections by Component, 2024 to 2034
Figure 65: Latin America Market Value (US$ Million) Analysis by End-Users, 2019 to 2034
Figure 66: Latin America Market Volume (Units) Analysis by End-Users, 2019 to 2034
Figure 67: Latin America Market Value Share (%) and BPS Analysis by End-Users, 2024 to 2034
Figure 68: Latin America Market Y-o-Y Growth (%) Projections by End-Users, 2024 to 2034
Figure 69: Latin America Market Attractiveness by Type, 2024 to 2034
Figure 70: Latin America Market Attractiveness by Component, 2024 to 2034
Figure 71: Latin America Market Attractiveness by End-Users, 2024 to 2034
Figure 72: Latin America Market Attractiveness by Country, 2024 to 2034
Figure 73: Western Europe Market Value (US$ Million) by Type, 2024 to 2034
Figure 74: Western Europe Market Value (US$ Million) by Component, 2024 to 2034
Figure 75: Western Europe Market Value (US$ Million) by End-Users, 2024 to 2034
Figure 76: Western Europe Market Value (US$ Million) by Country, 2024 to 2034
Figure 77: Western Europe Market Value (US$ Million) Analysis by Country, 2019 to 2034
Figure 78: Western Europe Market Volume (Units) Analysis by Country, 2019 to 2034
Figure 79: Western Europe Market Value Share (%) and BPS Analysis by Country, 2024 to 2034
Figure 80: Western Europe Market Y-o-Y Growth (%) Projections by Country, 2024 to 2034
Figure 81: Western Europe Market Value (US$ Million) Analysis by Type, 2019 to 2034
Figure 82: Western Europe Market Volume (Units) Analysis by Type, 2019 to 2034
Figure 83: Western Europe Market Value Share (%) and BPS Analysis by Type, 2024 to 2034
Figure 84: Western Europe Market Y-o-Y Growth (%) Projections by Type, 2024 to 2034
Figure 85: Western Europe Market Value (US$ Million) Analysis by Component, 2019 to 2034
Figure 86: Western Europe Market Volume (Units) Analysis by Component, 2019 to 2034
Figure 87: Western Europe Market Value Share (%) and BPS Analysis by Component, 2024 to 2034
Figure 88: Western Europe Market Y-o-Y Growth (%) Projections by Component, 2024 to 2034
Figure 89: Western Europe Market Value (US$ Million) Analysis by End-Users, 2019 to 2034
Figure 90: Western Europe Market Volume (Units) Analysis by End-Users, 2019 to 2034
Figure 91: Western Europe Market Value Share (%) and BPS Analysis by End-Users, 2024 to 2034
Figure 92: Western Europe Market Y-o-Y Growth (%) Projections by End-Users, 2024 to 2034
Figure 93: Western Europe Market Attractiveness by Type, 2024 to 2034
Figure 94: Western Europe Market Attractiveness by Component, 2024 to 2034
Figure 95: Western Europe Market Attractiveness by End-Users, 2024 to 2034
Figure 96: Western Europe Market Attractiveness by Country, 2024 to 2034
Figure 97: Eastern Europe Market Value (US$ Million) by Type, 2024 to 2034
Figure 98: Eastern Europe Market Value (US$ Million) by Component, 2024 to 2034
Figure 99: Eastern Europe Market Value (US$ Million) by End-Users, 2024 to 2034
Figure 100: Eastern Europe Market Value (US$ Million) by Country, 2024 to 2034
Figure 101: Eastern Europe Market Value (US$ Million) Analysis by Country, 2019 to 2034
Figure 102: Eastern Europe Market Volume (Units) Analysis by Country, 2019 to 2034
Figure 103: Eastern Europe Market Value Share (%) and BPS Analysis by Country, 2024 to 2034
Figure 104: Eastern Europe Market Y-o-Y Growth (%) Projections by Country, 2024 to 2034
Figure 105: Eastern Europe Market Value (US$ Million) Analysis by Type, 2019 to 2034
Figure 106: Eastern Europe Market Volume (Units) Analysis by Type, 2019 to 2034
Figure 107: Eastern Europe Market Value Share (%) and BPS Analysis by Type, 2024 to 2034
Figure 108: Eastern Europe Market Y-o-Y Growth (%) Projections by Type, 2024 to 2034
Figure 109: Eastern Europe Market Value (US$ Million) Analysis by Component, 2019 to 2034
Figure 110: Eastern Europe Market Volume (Units) Analysis by Component, 2019 to 2034
Figure 111: Eastern Europe Market Value Share (%) and BPS Analysis by Component, 2024 to 2034
Figure 112: Eastern Europe Market Y-o-Y Growth (%) Projections by Component, 2024 to 2034
Figure 113: Eastern Europe Market Value (US$ Million) Analysis by End-Users, 2019 to 2034
Figure 114: Eastern Europe Market Volume (Units) Analysis by End-Users, 2019 to 2034
Figure 115: Eastern Europe Market Value Share (%) and BPS Analysis by End-Users, 2024 to 2034
Figure 116: Eastern Europe Market Y-o-Y Growth (%) Projections by End-Users, 2024 to 2034
Figure 117: Eastern Europe Market Attractiveness by Type, 2024 to 2034
Figure 118: Eastern Europe Market Attractiveness by Component, 2024 to 2034
Figure 119: Eastern Europe Market Attractiveness by End-Users, 2024 to 2034
Figure 120: Eastern Europe Market Attractiveness by Country, 2024 to 2034
Figure 121: South Asia and Pacific Market Value (US$ Million) by Type, 2024 to 2034
Figure 122: South Asia and Pacific Market Value (US$ Million) by Component, 2024 to 2034
Figure 123: South Asia and Pacific Market Value (US$ Million) by End-Users, 2024 to 2034
Figure 124: South Asia and Pacific Market Value (US$ Million) by Country, 2024 to 2034
Figure 125: South Asia and Pacific Market Value (US$ Million) Analysis by Country, 2019 to 2034
Figure 126: South Asia and Pacific Market Volume (Units) Analysis by Country, 2019 to 2034
Figure 127: South Asia and Pacific Market Value Share (%) and BPS Analysis by Country, 2024 to 2034
Figure 128: South Asia and Pacific Market Y-o-Y Growth (%) Projections by Country, 2024 to 2034
Figure 129: South Asia and Pacific Market Value (US$ Million) Analysis by Type, 2019 to 2034
Figure 130: South Asia and Pacific Market Volume (Units) Analysis by Type, 2019 to 2034
Figure 131: South Asia and Pacific Market Value Share (%) and BPS Analysis by Type, 2024 to 2034
Figure 132: South Asia and Pacific Market Y-o-Y Growth (%) Projections by Type, 2024 to 2034
Figure 133: South Asia and Pacific Market Value (US$ Million) Analysis by Component, 2019 to 2034
Figure 134: South Asia and Pacific Market Volume (Units) Analysis by Component, 2019 to 2034
Figure 135: South Asia and Pacific Market Value Share (%) and BPS Analysis by Component, 2024 to 2034
Figure 136: South Asia and Pacific Market Y-o-Y Growth (%) Projections by Component, 2024 to 2034
Figure 137: South Asia and Pacific Market Value (US$ Million) Analysis by End-Users, 2019 to 2034
Figure 138: South Asia and Pacific Market Volume (Units) Analysis by End-Users, 2019 to 2034
Figure 139: South Asia and Pacific Market Value Share (%) and BPS Analysis by End-Users, 2024 to 2034
Figure 140: South Asia and Pacific Market Y-o-Y Growth (%) Projections by End-Users, 2024 to 2034
Figure 141: South Asia and Pacific Market Attractiveness by Type, 2024 to 2034
Figure 142: South Asia and Pacific Market Attractiveness by Component, 2024 to 2034
Figure 143: South Asia and Pacific Market Attractiveness by End-Users, 2024 to 2034
Figure 144: South Asia and Pacific Market Attractiveness by Country, 2024 to 2034
Figure 145: East Asia Market Value (US$ Million) by Type, 2024 to 2034
Figure 146: East Asia Market Value (US$ Million) by Component, 2024 to 2034
Figure 147: East Asia Market Value (US$ Million) by End-Users, 2024 to 2034
Figure 148: East Asia Market Value (US$ Million) by Country, 2024 to 2034
Figure 149: East Asia Market Value (US$ Million) Analysis by Country, 2019 to 2034
Figure 150: East Asia Market Volume (Units) Analysis by Country, 2019 to 2034
Figure 151: East Asia Market Value Share (%) and BPS Analysis by Country, 2024 to 2034
Figure 152: East Asia Market Y-o-Y Growth (%) Projections by Country, 2024 to 2034
Figure 153: East Asia Market Value (US$ Million) Analysis by Type, 2019 to 2034
Figure 154: East Asia Market Volume (Units) Analysis by Type, 2019 to 2034
Figure 155: East Asia Market Value Share (%) and BPS Analysis by Type, 2024 to 2034
Figure 156: East Asia Market Y-o-Y Growth (%) Projections by Type, 2024 to 2034
Figure 157: East Asia Market Value (US$ Million) Analysis by Component, 2019 to 2034
Figure 158: East Asia Market Volume (Units) Analysis by Component, 2019 to 2034
Figure 159: East Asia Market Value Share (%) and BPS Analysis by Component, 2024 to 2034
Figure 160: East Asia Market Y-o-Y Growth (%) Projections by Component, 2024 to 2034
Figure 161: East Asia Market Value (US$ Million) Analysis by End-Users, 2019 to 2034
Figure 162: East Asia Market Volume (Units) Analysis by End-Users, 2019 to 2034
Figure 163: East Asia Market Value Share (%) and BPS Analysis by End-Users, 2024 to 2034
Figure 164: East Asia Market Y-o-Y Growth (%) Projections by End-Users, 2024 to 2034
Figure 165: East Asia Market Attractiveness by Type, 2024 to 2034
Figure 166: East Asia Market Attractiveness by Component, 2024 to 2034
Figure 167: East Asia Market Attractiveness by End-Users, 2024 to 2034
Figure 168: East Asia Market Attractiveness by Country, 2024 to 2034
Figure 169: Middle East and Africa Market Value (US$ Million) by Type, 2024 to 2034
Figure 170: Middle East and Africa Market Value (US$ Million) by Component, 2024 to 2034
Figure 171: Middle East and Africa Market Value (US$ Million) by End-Users, 2024 to 2034
Figure 172: Middle East and Africa Market Value (US$ Million) by Country, 2024 to 2034
Figure 173: Middle East and Africa Market Value (US$ Million) Analysis by Country, 2019 to 2034
Figure 174: Middle East and Africa Market Volume (Units) Analysis by Country, 2019 to 2034
Figure 175: Middle East and Africa Market Value Share (%) and BPS Analysis by Country, 2024 to 2034
Figure 176: Middle East and Africa Market Y-o-Y Growth (%) Projections by Country, 2024 to 2034
Figure 177: Middle East and Africa Market Value (US$ Million) Analysis by Type, 2019 to 2034
Figure 178: Middle East and Africa Market Volume (Units) Analysis by Type, 2019 to 2034
Figure 179: Middle East and Africa Market Value Share (%) and BPS Analysis by Type, 2024 to 2034
Figure 180: Middle East and Africa Market Y-o-Y Growth (%) Projections by Type, 2024 to 2034
Figure 181: Middle East and Africa Market Value (US$ Million) Analysis by Component, 2019 to 2034
Figure 182: Middle East and Africa Market Volume (Units) Analysis by Component, 2019 to 2034
Figure 183: Middle East and Africa Market Value Share (%) and BPS Analysis by Component, 2024 to 2034
Figure 184: Middle East and Africa Market Y-o-Y Growth (%) Projections by Component, 2024 to 2034
Figure 185: Middle East and Africa Market Value (US$ Million) Analysis by End-Users, 2019 to 2034
Figure 186: Middle East and Africa Market Volume (Units) Analysis by End-Users, 2019 to 2034
Figure 187: Middle East and Africa Market Value Share (%) and BPS Analysis by End-Users, 2024 to 2034
Figure 188: Middle East and Africa Market Y-o-Y Growth (%) Projections by End-Users, 2024 to 2034
Figure 189: Middle East and Africa Market Attractiveness by Type, 2024 to 2034
Figure 190: Middle East and Africa Market Attractiveness by Component, 2024 to 2034
Figure 191: Middle East and Africa Market Attractiveness by End-Users, 2024 to 2034
Figure 192: Middle East and Africa Market Attractiveness by Country, 2024 to 2034
The size of the vane pump market is estimated to be USD 2,442.4 million in 2024.
Heavy duty vane pumps are leading the market by product type, with an estimated share of 32.0% in 2024.
Vane pumps are commonly used in the aviation industry, with a projected market share of 24.0% in 2024.
The vane pump market size is predicted to be USD 4,292.1 million by 2034.
The market in India is predicted to progress at a CAGR of 6.3% from 2024 to 2034.
Explore Similar Insights
Thank you!
You will receive an email from our Business Development Manager. Please be sure to check your SPAM/JUNK folder too.