Dewatering Bin Market Forecast and Outlook (2025-2035)

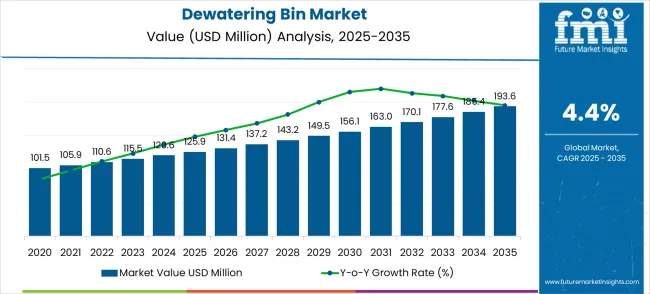
The global dewatering bin market is valued at USD 125.9 million in 2025 and is expected to reach USD 193.6 million by 2035, reflecting a CAGR of 4.4%. Growth contribution across this period is primarily driven by increasing demand from wastewater treatment, food processing, and industrial applications where efficient moisture removal is critical. In the early phase from 2025 to 2028, contributions are concentrated in regions with expanding municipal infrastructure and growing industrial output. Manufacturers offering high-capacity, durable, and energy-efficient dewatering bins secure larger market shares, while technological enhancements such as automated discharge and corrosion-resistant designs reinforce adoption. During this stage, growth is amplified by operational efficiency gains and regulatory requirements for improved waste and water management.
Quick Stats for Dewatering Bin Market

  • Dewatering Bin Market Value (2025): USD 125.9 million
  • Dewatering Bin Market Forecast Value (2035): USD 193.6 million
  • Dewatering Bin Market Forecast CAGR: 4.4%
  • Leading Application in Dewatering Bin Market: Wastewater Treatment and Municipal Engineering (44.1%)
  • Key Growth Regions in Dewatering Bin Market: Asia Pacific, North America, and Europe
  • Key Players in Dewatering Bin Market: Babcock & Wilcox, UCC Environmental, Wastequip, Ironclad Environmental, ParkUSA (ParkProcess), Con-Fab, Spectrum Water Technology, DumpsterLiners, Morrow Water Technologies, and E-Pak Manufacturing

Dewatering Bin Market Market Value Analysis

From 2029 to 2035, the growth contribution becomes more balanced as markets in developed regions approach maturity and emerging regions expand adoption. Innovations in modular designs, compact systems, and integration with advanced waste treatment technologies support incremental gains. Collaboration between equipment suppliers and large-scale industrial users further strengthens market penetration and steady value creation.

By 2035, the market is expected to record an absolute increase of USD 67.7 million, indicating consistent expansion over the decade. The growth contribution index analysis highlights how early momentum driven by infrastructure development transitions into steady growth supported by technological innovation and broader adoption, ensuring long-term stability and progressive market accumulation in the global dewatering bin sector.

Dewatering Bin Market Key Takeaways

Metric Value
Estimated Value in (2025E) USD 125.9 million
Forecast Value in (2035F) USD 193.6 million
Forecast CAGR (2025 to 2035) 4.4%

The dewatering bin market is segmented into construction and civil engineering at 37%, mining and mineral processing at 26%, industrial wastewater treatment at 17%, food and beverage processing at 11%, and municipal services at 9%. Construction dominates due to extensive use in excavation, trenching, and foundation work where water removal is essential. Mining and mineral facilities utilize dewatering bins for slurry management and efficient solid-liquid separation. Industrial wastewater plants apply them to handle sludge volumes more effectively. Food and beverage industries benefit from water recycling and by-product management. Municipal services use bins for stormwater control and sludge reduction, ensuring efficient waste handling and compliance with local regulations.

Trends in the dewatering bin market highlight the adoption of modular and stackable designs to maximize space usage and simplify logistics. Manufacturers are advancing with lightweight, corrosion-resistant, and automated systems to improve durability and reduce manual labor. Growing uptake in construction, mining, and industrial facilities reflects the need for cost-effective sludge and water control solutions.

Integration of smart monitoring tools and IoT-enabled systems is enhancing operational efficiency by tracking fill levels, water recovery, and disposal cycles. Collaborations between equipment suppliers and utility providers are leading to customized solutions. The rising demand for efficient sludge management and adherence to regulations continues to drive global adoption across multiple industries.

Why is the Dewatering Bin Market Growing?

Market expansion is being supported by the increasing global demand for efficient waste management solutions and the corresponding need for reliable dewatering systems that can handle diverse waste streams while maintaining consistent performance across various industrial applications. Modern industrial facilities are increasingly focused on implementing waste treatment solutions that can reduce disposal costs, minimize environmental impact, and provide consistent quality in processed waste discharge. Dewatering bins' proven ability to deliver efficient solid-liquid separation, reduced waste volume, and versatile operational capabilities make them essential equipment for contemporary industrial waste management and processing solutions.

The growing focus on environmental compliance and green manufacturing practices is driving demand for dewatering bins that can support regulatory requirements, reduce waste disposal costs, and enable efficient resource recovery from industrial waste streams. Industrial processors' preference for equipment that combines operational efficiency with environmental benefits and cost-effectiveness is creating opportunities for innovative dewatering implementations. The rising influence of circular economy principles and resource recovery demands is also contributing to the increased adoption of dewatering bins, which can provide efficient separation solutions without excessive energy consumption or maintenance requirements.

Analyzing Dewatering Bin Market by Top Investment Segments

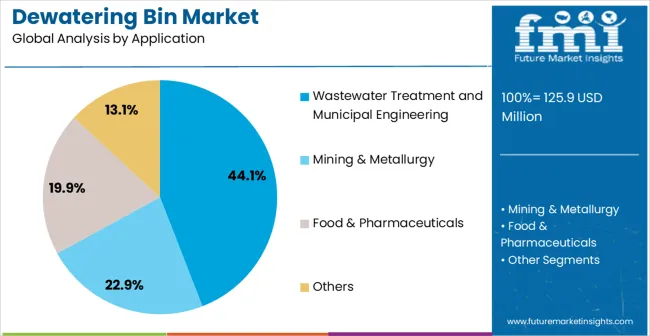
The dewatering bin market is experiencing steady growth, driven by increasing demand for efficient sludge and liquid-solid separation systems across industries. Gravity sedimentation type bins dominate the technology segment with a 35% market share, while mechanical filter press types and other technologies account for the remainder. In terms of application, wastewater treatment and municipal engineering lead with a 44.1% share, followed by mining and metallurgy, food and pharmaceuticals, and other industrial applications. These segments represent the primary opportunities for investment, reflecting widespread adoption and consistent demand for reliable dewatering solutions across key industrial sectors.
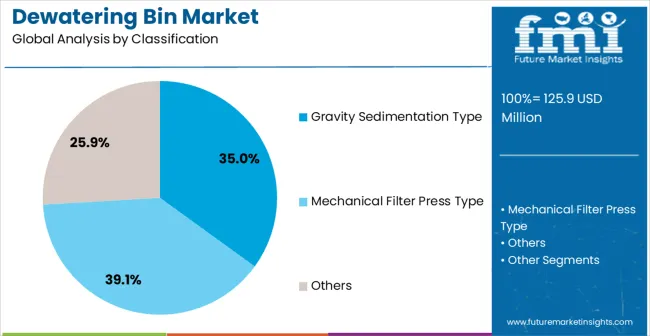
Gravity Sedimentation Type Leads Demand for Dewatering Bins in 2025

Dewatering Bin Market Analysis By Classification

Gravity sedimentation type dewatering bins hold a 35% share of the technology segment, making them the most commonly used solution. They are favored for wastewater treatment, municipal sludge handling, and low to medium solids content separation due to their simplicity and cost-effectiveness. Key manufacturers include Alfa Laval, Veolia, ANDRITZ, and GEA Group. Gravity sedimentation bins offer low energy consumption and minimal maintenance requirements, which makes them particularly attractive for municipal and industrial wastewater treatment plants. Their reliability and ease of operation contribute to continued preference among operators in sectors seeking efficient, low-cost dewatering solutions.
  • Simple and cost-effective solution for low to medium solids separation
  • Low energy consumption and minimal maintenance requirements
  • Widely adopted in municipal and industrial wastewater treatment

Wastewater Treatment and Municipal Engineering Likely to Dominate Dewatering Bin Market by Application in 2025

Dewatering Bin Market Analysis By Application

Wastewater treatment and municipal engineering applications account for 44.1% of the market, representing the largest segment. Dewatering bins in this segment are used to process municipal sludge, industrial effluent, and other liquid-solid waste, improving operational efficiency and environmental compliance. Leading manufacturers such as Alfa Laval, Veolia, ANDRITZ, and GEA Group provide solutions designed for high reliability and ease of integration into existing treatment systems. The segment’s growth is driven by expanding municipal infrastructure, increasing regulatory standards for wastewater management, and the need for efficient waste handling, making it the primary focus for investment.

  • Widely used for municipal sludge and liquid-solid waste processing
  • Supports compliance with regulatory wastewater management standards
  • Growth driven by expanding municipal infrastructure and industrial effluent treatment

What are the Drivers, Restraints, and Key Trends of the Dewatering Bin Market?

The dewatering bin market is expanding as industries seek efficient waste management solutions. These bins separate liquids from solids, reducing waste volume and simplifying disposal. Construction and mining sectors are major contributors, producing slurry and wastewater that require safe handling. Improvements in bin design and materials have enhanced durability and performance, making them more reliable for industrial applications. The ability to maintain cleaner work environments, reduce operational hazards, and support regulatory compliance reinforces demand. Combined with increasing industrial activity globally, these factors are driving steady growth for dewatering bin solutions. Companies are investing in improved designs and manufacturing processes to meet evolving industrial requirements while ensuring effective, safe, and environmentally responsible waste handling.

High Equipment Costs and Operational Challenges Limiting Adoption

Despite the growth potential, the dewatering bin market faces significant challenges. High acquisition costs make these systems less accessible for smaller organizations or budget-constrained facilities. Operational requirements, including regular maintenance and proper handling, add to total ownership expenses. Skilled personnel are often needed to ensure correct use, which can increase labor costs. Performance may vary depending on the type and consistency of waste, sometimes requiring customized solutions that further increase investment. Urban or space-limited environments can restrict installation options. Limited awareness of advanced waste management practices in some regions can also slow adoption. These factors collectively hinder broader implementation, even as demand from large industrial operators and high-volume facilities continues to increase, highlighting the need for cost-effective and user-friendly solutions.

Automation and Enviroments Shaping Dewatering Bin Market Trends

Market trends show increasing adoption of automation and green practices. Dewatering bins are being equipped with sensors and monitoring features that allow efficient operation, reduce manual labor, and prevent overflow or spillage. Manufacturers are focusing on environmentally conscious designs using durable, recyclable materials. Customization is growing in response to diverse industrial needs, with bins tailored to handle specific waste types, volumes, and operational conditions. Companies are exploring modular and portable designs to improve installation flexibility and space utilization. The trend toward cleaner, safer, and more efficient industrial processes is guiding innovation.

Analysis of the Dewatering Bin Market by Key Countries

The global dewatering bin sector is expected to expand at a CAGR of 4.4% from 2025 to 2035, corresponding to a multiplication factor of 1.44 over the period. China leads at 5.9% (1.76x), 1.5 points above the global average, supported by growing industrial activities and enhanced waste processing infrastructure. India follows at 5.5% (1.71x), 1.1 points above global growth, fueled by urban development and modernization of municipal waste systems, both part of BRICS along with Brazil, which grows at 4.6% (1.56x), slightly above the global rate due to expanding waste management projects. Germany records 5.1% (1.65x), 0.7 points higher than the global average, reflecting advanced waste handling facilities. The USA grows at 4.2% (1.52x), slightly below the global pace, while the UK at 3.7% (1.44x) and Japan at 3.3% (1.38x) lag behind. ASEAN and Oceania are adopting these solutions at 4-5% (1.44-1.56x), driven by rising urban waste management initiatives.
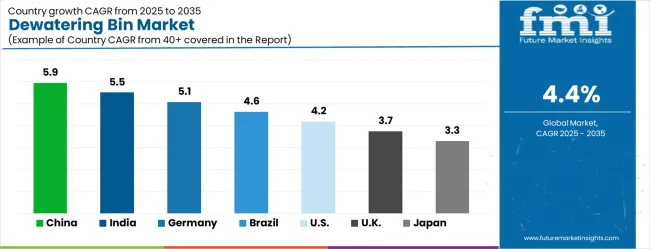
Dewatering Bin Market Cagr Analysis By Country

Country CAGR (2025-2035)
China 5.9%
India 5.5%
Germany 5.1%
Brazil 4.6%
USA 4.2%
UK 3.7%
Japan 3.3%

The report covers an in-depth analysis of 40+ countries, Top-performing countries are highlighted below.

Market Growth of Dewatering Bins in China

China accounts for 5.9% of the global Dewatering Bin market with CAGR projected at 5.9% from 2025 to 2035, above the global rate of 4.4%. Demand is supported by rapid expansion of industrial wastewater treatment, large-scale municipal waste operations, and heavy construction activity. International players such as Veolia and GEA Group are strengthening their presence through partnerships with domestic firms to deliver high-capacity, automated systems. Eastern and southern provinces dominate installations due to industrial concentration. Demand for modular bins is increasing as facilities prioritize compact designs for ease of handling. Strong government focus on efficient effluent management continues to drive purchases.

  • Eastern and southern provinces represent 50% of installations.
  • Industrial wastewater applications account for 40% of market demand.
  • Modular bin adoption improves space use and reduces processing time.

Dewatering Bin Market Outlook in India

India contributes 5.5% to the global market with 5.5% CAGR expected through 2035. Expansion is linked to municipal wastewater facilities, industrial plants, and expanding infrastructure projects. Metropolitan hubs including Mumbai, Delhi, and Bangalore lead adoption. Suppliers such as GEA Group and Veolia are introducing bins with automated solid-liquid separation, reducing manual intervention in large treatment plants. Growing adoption in textile, chemical, and food industries adds to demand. Compact, multifunctional bins are gaining preference due to space constraints in urban facilities. Government-backed water management initiatives and investments in industrial effluent treatment are further strengthening adoption.

  • Mumbai, Delhi, and Bangalore contribute 45% of adoption.
  • Textile and chemical industries make up 30% of demand.
  • Compact bins improve handling speed and efficiency in urban plants.

Dewatering Bin Utilization in Germany

Germany represents 5.1% of the global Dewatering Bin market with 5.1% CAGR. Adoption is strongest in industrial wastewater plants, municipal operations, and manufacturing sectors requiring efficient sludge management. Regions such as North Rhine-Westphalia and Bavaria dominate installations due to heavy industrial activity. Companies like GEA Group and Veolia are supplying advanced automated bins that integrate with recycling systems. Food and chemical industries are particularly strong adopters, requiring high-capacity dewatering equipment for compliance with EU standards. Automated designs also reduce reliance on labor while improving accuracy in separation processes.

  • North Rhine-Westphalia and Bavaria drive 55% of adoption.
  • Food and chemical plants contribute 35% of installations.
  • Automated bins improve compliance and operational efficiency.

Expansion of Dewatering Bins in Brazil

Brazil accounts for 4.6% of the global market, recording CAGR of 4.6%. Market adoption is highest in wastewater facilities, municipal programs, and food processing operations. São Paulo and Rio de Janeiro are leading centers of installation, representing more than half of the demand. International suppliers such as Veolia and GEA Group are adapting equipment for local climate and infrastructure. Applications include wastewater recycling, bioenergy, and industrial sludge treatment. Modular bin systems with automation help facilities cut handling costs and optimize workflows. Regulatory focus on effluent control is expected to steady demand.

  • São Paulo and Rio de Janeiro account for 50% of adoption.
  • Recycling and bioenergy initiatives contribute 35% of demand.
  • Modular automation improves handling and reduces operational costs.

Dewatering Bin Demand in the United States

The United States holds 4.2% share of the global market with CAGR at 4.2%. Adoption is concentrated in municipal wastewater plants, industrial sites, and construction-related projects. States such as California, Texas, and New York lead usage due to dense urban and industrial activity. Suppliers including Veolia and GEA Group are delivering high-capacity, automated bins designed for efficient solid-liquid separation. Growing investments in water reuse and environmental compliance are supporting steady adoption. Compact and modular designs are gaining traction as enterprises focus on reducing operational space while improving waste handling performance.

  • California, Texas, and New York represent 60% of usage.
  • Industrial wastewater treatment drives 40% of installations.
  • Compact modular bins reduce space and enhance efficiency.

Dewatering Bin Applications in the United Kingdom

The United Kingdom makes up 3.7% of the global market with CAGR at 3.7%. Demand is concentrated in municipal wastewater centers, industrial plants, and recycling facilities. London, Manchester, and Birmingham dominate installations owing to large urban populations and manufacturing activity. GEA Group and Veolia are supplying modular bins with improved solid-liquid separation and automation. Food, paper, and chemical processing sectors rely on dewatering systems to comply with strict waste guidelines. Compact models are increasingly preferred to manage space in high-density facilities.
  • London, Manchester, and Birmingham drive 55% of demand.
  • Food, paper, and chemical sectors account for 35% of usage.
  • Compact automated bins optimize space and meet compliance needs.

Dewatering Bin Adoption in Japan

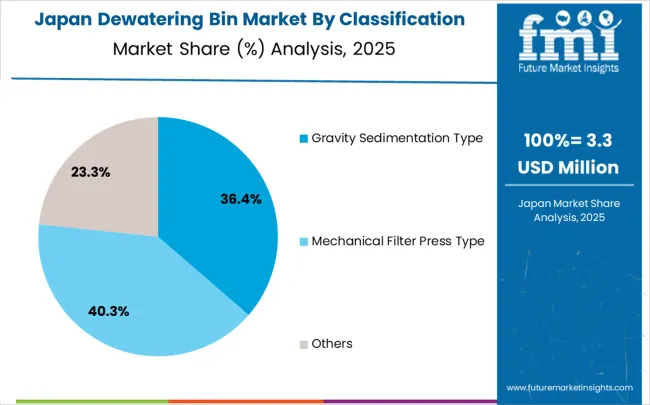
Dewatering Bin Market Japan Market Share Analysis By Classification

Japan accounts for 3.3% of the global Dewatering Bin market with CAGR at 3.3%, below the global average. Installations are concentrated in Tokyo, Osaka, and Nagoya, which account for half of total demand. International players like Veolia and GEA Group provide compact, high-efficiency bins designed for dense urban environments. Adoption is driven by wastewater treatment plants, municipal facilities, and industrial processing operations. Automated bin systems are replacing older models, cutting labor requirements and improving accuracy in separation. Compact units are increasingly chosen due to limited space in urban laboratories and treatment centers.
  • Tokyo, Osaka, and Nagoya account for 50% of usage.
  • Automated systems deliver 40% improvement in operational efficiency.
  • Compact designs reduce manual work and optimize space utilization.

Europe Market Split by Countries

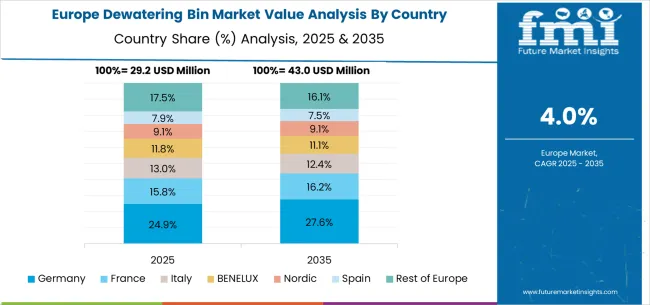
Dewatering Bin Market Europe Country Market Share Analysis, 2025 & 2035

The dewatering bin market in Europe is projected to grow from USD 29.2 million in 2025 to USD 44.8 million by 2035, registering a CAGR of 4.3% over the forecast period. Germany is expected to maintain its leadership position with a 31.5% market share in 2025, moderating slightly to 31.2% by 2035, supported by its strong industrial base, advanced waste treatment infrastructure, and comprehensive environmental compliance requirements serving major European markets.

The United Kingdom follows with a 22.5% share in 2025, projected to reach 22.7% by 2035, driven by robust industrial facility upgrades, municipal infrastructure modernization, and established waste treatment systems across manufacturing and municipal sectors. France holds a 17.8% share in 2025, rising to 18.0% by 2035, supported by industrial development. Italy records 11.5% in 2025, inching to 11.6% by 2035, with growth underpinned by industrial modernization and increasing adoption of advanced waste treatment technologies. Spain contributes 8.2% in 2025, moving to 8.3% by 2035, supported by expanding industrial activities and municipal infrastructure development. The Netherlands maintains a 3.1% share in 2025, growing to 3.2% by 2035. The Rest of Europe region, including Nordic countries, Eastern Europe, Belgium, Switzerland, and Austria, is anticipated to gain momentum, expanding its collective share from 5.4% to 5.0% by 2035, attributed to increasing adoption of advanced waste treatment solutions in Nordic countries and growing industrial activities across Eastern European markets implementing environmental compliance programs.
Competitive Landscape of the Dewatering Bin Market

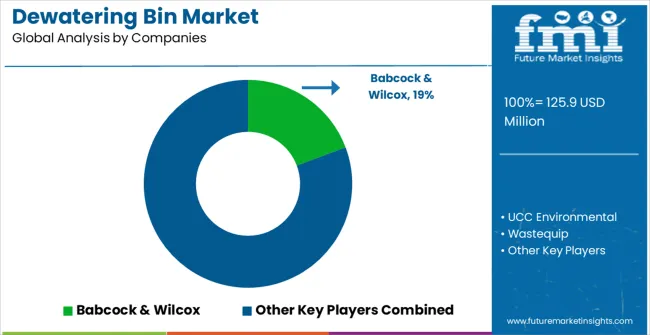
Dewatering Bin Market Analysis By Company

The dewatering bin market is defined by engineering performance, compliance demands, and cost efficiency. Key companies include Babcock & Wilcox, UCC Environmental, Wastequip, Ironclad Environmental, ParkUSA under ParkProcess, Con-Fab, Spectrum Water Technology, DumpsterLiners, Morrow Water Technologies, and E-Pak Manufacturing. Competition is shaped by durability of bins, adaptability to multiple site conditions, and the ability to handle high solids content without leakage. Buyers evaluate bins not only on strength but also on ease of maintenance and disposal logistics. Product value is tied to reliability in drainage and long service life.

UCC Environmental promotes bins designed with wear-resistant plates, center dewatering elements, and fast discharge features. Spectrum Water Technology presents transport-ready bins optimized for solids retention with minimal manual handling. Babcock & Wilcox highlights heavy-duty designs suitable for industrial applications, while ParkProcess offers skid-mounted units for flexible deployment. Con-Fab and E-Pak Manufacturing focus on rugged fabrication with customizable dimensions. DumpsterLiners and Morrow Water Technologies differentiate by providing accessories and support solutions tailored to waste transport.

Capacity ranges are presented in cubic yards, steel gauges are listed to underline durability, and drainage performance is detailed with perforation ratios. Gate mechanisms, lifting configurations, and corrosion-resistant coatings are positioned as critical selection points. Customers are shown maintenance steps, liner compatibility, and safe unloading procedures. Manufacturers present their products as engineered for operational savings, reduced downtime, and compliance with discharge rules. Competition relies on innovation in bin geometry, structural reinforcement, and service programs. Distinct positioning is maintained through product reliability, adaptability, and after-sales support, rather than simple price competition.

Dewatering Bin Market - Stakeholder Contribution Framework

Dewatering bins represent a specialized solid-liquid separation segment within industrial waste management and municipal engineering, projected to grow from USD 125.9 million in 2025 to USD 193.6 million by 2035 at a 4.4% CAGR. These gravity sedimentation and mechanical filter press systems enable efficient dewatering operations across wastewater treatment and municipal engineering (44.1% market share), mining and metallurgy, and food and pharmaceutical processing applications. Market expansion is driven by increasing environmental regulations, growing industrial waste management requirements, rising demand for cost-effective waste treatment solutions, and expanding municipal infrastructure development requiring reliable solid-liquid separation technologies.

How Environmental Regulatory Authorities Could Strengthen Waste Management Standards and Compliance?

  • Discharge Standards Development: Establish comprehensive regulations for industrial waste discharge, sludge handling, and solid-liquid separation requirements that drive demand for efficient dewatering systems while protecting water resources and ensuring environmental compliance across diverse industrial sectors.
  • Municipal Infrastructure Requirements: Implement mandatory standards for municipal wastewater treatment facilities requiring advanced dewatering capabilities that reduce waste volume, improve treatment efficiency, and minimize environmental impact in urban and industrial areas.
  • Resource Recovery Incentives: Create regulatory frameworks encouraging waste-to-resource conversion through efficient dewatering processes, including incentives for facilities that demonstrate superior solid-liquid separation performance and reduced landfill dependency.
  • Technology Validation Programs: Develop certification processes for dewatering equipment performance, efficiency standards, and environmental impact assessment that ensure systems meet regulatory requirements while providing reliable waste treatment capabilities.
  • Cross-Industry Harmonization: Coordinated dewatering standards across municipal, industrial, mining, and food processing sectors to create consistent regulatory frameworks that facilitate equipment standardization and technology development.

How Municipal Engineering Organizations Could Advance Infrastructure Standards and Operational Excellence?

  • Design and Installation Guidelines: Develop comprehensive technical standards for dewatering bin selection, sizing, and integration within municipal treatment facilities that optimize performance, reduce maintenance requirements, and ensure reliable long-term operation.
  • Performance Benchmarking Systems: Establish industry metrics for dewatering efficiency, operational reliability, and cost-effectiveness that enable comparative analysis, identify best practices, and drive continuous improvement across municipal facilities.
  • Operator Training and Certification: Create specialized training programs for municipal facility operators covering dewatering system operation, maintenance procedures, troubleshooting techniques, and optimization methods specific to municipal waste treatment applications.
  • Technology Integration Protocols: Develop standards for integrating dewatering systems with existing municipal infrastructure, control systems, and waste management processes that maximize operational efficiency and minimize implementation disruption.
  • Lifecycle Management Standards: Establish protocols for equipment maintenance, replacement planning, and upgrade strategies that optimize total cost of ownership while maintaining consistent treatment performance throughout system lifecycles.

How Equipment Manufacturers Could Drive Innovation and Competitive Advantage?

  • Technology Enhancement Research: Invest in the development of advanced dewatering technologies, including improved filtration systems, automated control capabilities, and energy-efficient operation that deliver superior performance while reducing operational costs and environmental impact.
  • Modular System Design: Engineer flexible, scalable dewatering platforms with standardized components and modular configurations that enable customization for specific applications while reducing manufacturing costs and simplifying maintenance procedures.
  • Smart Monitoring Integration: Develop intelligent systems with integrated sensors, predictive maintenance capabilities, and remote monitoring that optimize performance, prevent failures, and provide operational insights for facility managers.
  • Material and Durability Innovation: Create systems using advanced materials and corrosion-resistant designs that extend equipment life, reduce maintenance requirements, and ensure reliable performance in challenging industrial environments.
  • Comprehensive Service Solutions: Establish global service networks providing installation support, maintenance programs, spare parts availability, and technical expertise that ensure optimal system performance throughout operational lifecycles.

How Industrial Facility Operators Could Optimize Waste Management and Operational Efficiency?

  • Strategic System Planning: Conduct comprehensive assessments of waste stream characteristics, treatment requirements, and operational constraints to select optimal dewatering solutions that maximize efficiency while minimizing capital and operating costs.
  • Process Integration Optimization: Integrate dewatering systems with existing waste treatment processes, control systems, and material handling equipment to create seamless operations that optimize overall facility performance and regulatory compliance.
  • Preventive Maintenance Excellence: Implement systematic maintenance programs including condition monitoring, predictive maintenance techniques, and systematic component replacement that prevent unexpected failures and extend equipment lifecycles.
  • Operational Performance Monitoring: Utilize data analytics, performance tracking, and continuous improvement methodologies to optimize dewatering operations, reduce energy consumption, and improve overall waste treatment efficiency.
  • Regulatory Compliance Management: Establish comprehensive compliance monitoring systems that track dewatering performance against regulatory requirements while documenting operational data for regulatory reporting and audit purposes.

How Engineering Consultants and System Integrators Could Enable Comprehensive Solutions?

  • Application-Specific Design: Provide specialized engineering services for dewatering system design, process optimization, and integration planning that address unique facility requirements, waste characteristics, and operational constraints.
  • Technology Selection Expertise: Offer comprehensive technology assessment services comparing different dewatering approaches, equipment options, and performance capabilities to help facilities select optimal solutions for specific applications.
  • System Integration Services: Provide expertise in integrating dewatering systems with existing facility infrastructure, control systems, and waste management processes that maximize operational efficiency and minimize implementation complexity.
  • Performance Optimization Support: Conduct detailed performance analysis, efficiency assessments, and optimization studies that identify improvement opportunities and develop strategies for enhanced dewatering effectiveness.
  • Regulatory Compliance Consulting: Offer specialized knowledge of environmental regulations, permitting requirements, and compliance documentation to ensure dewatering systems meet all applicable regulatory standards and reporting requirements.

How Investors and Financial Enablers Could Support Market Development and Infrastructure Growth?

  • Municipal Infrastructure Investment: Finance the construction and modernization of municipal wastewater treatment facilities, incorporating advanced dewatering systems that drive demand for efficient solid-liquid separation equipment while supporting urban development.
  • Industrial Facility Modernization: Provide capital for industrial companies upgrading waste treatment capabilities, implementing advanced dewatering systems, and improving environmental compliance through enhanced waste management technologies.
  • Technology Development Funding: Support research and development of breakthrough dewatering technologies, including advanced filtration systems, automated control capabilities, and energy-efficient operation that address current market limitations and emerging requirements.
  • Emerging Market Development: Finance infrastructure development in emerging economies through wastewater treatment projects, industrial facility construction, and municipal engineering initiatives that expand global market access for dewatering technologies.

Key Players in the Dewatering Bin Market

  • Babcock & Wilcox
  • UCC Environmental
  • Wastequip
  • Ironclad Environmental
  • ParkUSA (ParkProcess)
  • Con-Fab
  • Spectrum Water Technology
  • DumpsterLiners
  • Morrow Water Technologies
  • E-Pak Manufacturing

Scope of the Report

Items Values
Quantitative Units (2025) USD 125.9 million
Technology Type Gravity Sedimentation Type, Mechanical Filter Press Type, Others
Application Wastewater Treatment and Municipal Engineering, Mining & Metallurgy, Food & Pharmaceuticals, Others
Regions Covered North America, Europe, East Asia, South Asia & Pacific, Latin America, Middle East & Africa
Countries Covered United States, Canada, United Kingdom, Germany, France, China, Japan, South Korea, India, Brazil, Australia and 40+ countries
Key Companies Profiled Babcock & Wilcox, UCC Environmental, Wastequip, Ironclad Environmental, ParkUSA (ParkProcess), Con-Fab, Spectrum Water Technology, DumpsterLiners, Morrow Water Technologies, and E-Pak Manufacturing
Additional Attributes Dollar sales by technology type and application category, regional demand trends, competitive landscape, technological advancements in dewatering systems, automation innovation, energy efficiency development, and operational optimization

Dewatering Bin Market by Segments

Technology Type:

  • Gravity Sedimentation Type
  • Mechanical Filter Press Type
  • Others

Application:

  • Wastewater Treatment and Municipal Engineering
  • Mining & Metallurgy
  • Food & Pharmaceuticals
  • Others

Region:

  • North America
    • United States
    • Canada
    • Mexico
  • Europe
    • Germany
    • United Kingdom
    • France
    • Italy
    • Spain
    • Nordic
    • BENELUX
    • Rest of Europe
  • East Asia
    • China
    • Japan
    • South Korea
  • South Asia & Pacific
    • India
    • ASEAN
    • Australia & New Zealand
    • Rest of South Asia & Pacific
  • Latin America
    • Brazil
    • Chile
    • Rest of Latin America
  • Middle East & Africa
    • Kingdom of Saudi Arabia
    • Other GCC Countries
    • Turkiye
    • South Africa
    • Other African Union
    • Rest of Middle East & Africa

Table of Content

  1. Executive Summary
    • Global Market Outlook
    • Demand to side Trends
    • Supply to side Trends
    • Technology Roadmap Analysis
    • Analysis and Recommendations
  2. Market Overview
    • Market Coverage / Taxonomy
    • Market Definition / Scope / Limitations
  3. Market Background
    • Market Dynamics
      • Drivers
      • Restraints
      • Opportunity
      • Trends
    • Scenario Forecast
      • Demand in Optimistic Scenario
      • Demand in Likely Scenario
      • Demand in Conservative Scenario
    • Opportunity Map Analysis
    • Product Life Cycle Analysis
    • Supply Chain Analysis
    • Investment Feasibility Matrix
    • Value Chain Analysis
    • PESTLE and Porter’s Analysis
    • Regulatory Landscape
    • Regional Parent Market Outlook
    • Production and Consumption Statistics
    • Import and Export Statistics
  4. Global Market Analysis 2020 to 2024 and Forecast, 2025 to 2035
    • Historical Market Size Value (USD Million) Analysis, 2020 to 2024
    • Current and Future Market Size Value (USD Million) Projections, 2025 to 2035
      • Y to o to Y Growth Trend Analysis
      • Absolute $ Opportunity Analysis
  5. Global Market Pricing Analysis 2020 to 2024 and Forecast 2025 to 2035
  6. Global Market Analysis 2020 to 2024 and Forecast 2025 to 2035, By Classification
    • Introduction / Key Findings
    • Historical Market Size Value (USD Million) Analysis By Classification , 2020 to 2024
    • Current and Future Market Size Value (USD Million) Analysis and Forecast By Classification , 2025 to 2035
      • Gravity Sedimentation Type
      • Mechanical Filter Press Type
      • Others
    • Y to o to Y Growth Trend Analysis By Classification , 2020 to 2024
    • Absolute $ Opportunity Analysis By Classification , 2025 to 2035
  7. Global Market Analysis 2020 to 2024 and Forecast 2025 to 2035, By Application
    • Introduction / Key Findings
    • Historical Market Size Value (USD Million) Analysis By Application, 2020 to 2024
    • Current and Future Market Size Value (USD Million) Analysis and Forecast By Application, 2025 to 2035
      • Wastewater Treatment and Municipal Engineering
      • Mining & Metallurgy
      • Food & Pharmaceuticals
      • Others
    • Y to o to Y Growth Trend Analysis By Application, 2020 to 2024
    • Absolute $ Opportunity Analysis By Application, 2025 to 2035
  8. Global Market Analysis 2020 to 2024 and Forecast 2025 to 2035, By Region
    • Introduction
    • Historical Market Size Value (USD Million) Analysis By Region, 2020 to 2024
    • Current Market Size Value (USD Million) Analysis and Forecast By Region, 2025 to 2035
      • North America
      • Latin America
      • Western Europe
      • Eastern Europe
      • East Asia
      • South Asia and Pacific
      • Middle East & Africa
    • Market Attractiveness Analysis By Region
  9. North America Market Analysis 2020 to 2024 and Forecast 2025 to 2035, By Country
    • Historical Market Size Value (USD Million) Trend Analysis By Market Taxonomy, 2020 to 2024
    • Market Size Value (USD Million) Forecast By Market Taxonomy, 2025 to 2035
      • By Country
        • USA
        • Canada
        • Mexico
      • By Classification
      • By Application
    • Market Attractiveness Analysis
      • By Country
      • By Classification
      • By Application
    • Key Takeaways
  10. Latin America Market Analysis 2020 to 2024 and Forecast 2025 to 2035, By Country
    • Historical Market Size Value (USD Million) Trend Analysis By Market Taxonomy, 2020 to 2024
    • Market Size Value (USD Million) Forecast By Market Taxonomy, 2025 to 2035
      • By Country
        • Brazil
        • Chile
        • Rest of Latin America
      • By Classification
      • By Application
    • Market Attractiveness Analysis
      • By Country
      • By Classification
      • By Application
    • Key Takeaways
  11. Western Europe Market Analysis 2020 to 2024 and Forecast 2025 to 2035, By Country
    • Historical Market Size Value (USD Million) Trend Analysis By Market Taxonomy, 2020 to 2024
    • Market Size Value (USD Million) Forecast By Market Taxonomy, 2025 to 2035
      • By Country
        • Germany
        • UK
        • Italy
        • Spain
        • France
        • Nordic
        • BENELUX
        • Rest of Western Europe
      • By Classification
      • By Application
    • Market Attractiveness Analysis
      • By Country
      • By Classification
      • By Application
    • Key Takeaways
  12. Eastern Europe Market Analysis 2020 to 2024 and Forecast 2025 to 2035, By Country
    • Historical Market Size Value (USD Million) Trend Analysis By Market Taxonomy, 2020 to 2024
    • Market Size Value (USD Million) Forecast By Market Taxonomy, 2025 to 2035
      • By Country
        • Russia
        • Poland
        • Hungary
        • Balkan & Baltic
        • Rest of Eastern Europe
      • By Classification
      • By Application
    • Market Attractiveness Analysis
      • By Country
      • By Classification
      • By Application
    • Key Takeaways
  13. East Asia Market Analysis 2020 to 2024 and Forecast 2025 to 2035, By Country
    • Historical Market Size Value (USD Million) Trend Analysis By Market Taxonomy, 2020 to 2024
    • Market Size Value (USD Million) Forecast By Market Taxonomy, 2025 to 2035
      • By Country
        • China
        • Japan
        • South Korea
      • By Classification
      • By Application
    • Market Attractiveness Analysis
      • By Country
      • By Classification
      • By Application
    • Key Takeaways
  14. South Asia and Pacific Market Analysis 2020 to 2024 and Forecast 2025 to 2035, By Country
    • Historical Market Size Value (USD Million) Trend Analysis By Market Taxonomy, 2020 to 2024
    • Market Size Value (USD Million) Forecast By Market Taxonomy, 2025 to 2035
      • By Country
        • India
        • ASEAN
        • Australia & New Zealand
        • Rest of South Asia and Pacific
      • By Classification
      • By Application
    • Market Attractiveness Analysis
      • By Country
      • By Classification
      • By Application
    • Key Takeaways
  15. Middle East & Africa Market Analysis 2020 to 2024 and Forecast 2025 to 2035, By Country
    • Historical Market Size Value (USD Million) Trend Analysis By Market Taxonomy, 2020 to 2024
    • Market Size Value (USD Million) Forecast By Market Taxonomy, 2025 to 2035
      • By Country
        • Kingdom of Saudi Arabia
        • Other GCC Countries
        • Turkiye
        • South Africa
        • Other African Union
        • Rest of Middle East & Africa
      • By Classification
      • By Application
    • Market Attractiveness Analysis
      • By Country
      • By Classification
      • By Application
    • Key Takeaways
  16. Key Countries Market Analysis
    • USA
      • Pricing Analysis
      • Market Share Analysis, 2024
        • By Classification
        • By Application
    • Canada
      • Pricing Analysis
      • Market Share Analysis, 2024
        • By Classification
        • By Application
    • Mexico
      • Pricing Analysis
      • Market Share Analysis, 2024
        • By Classification
        • By Application
    • Brazil
      • Pricing Analysis
      • Market Share Analysis, 2024
        • By Classification
        • By Application
    • Chile
      • Pricing Analysis
      • Market Share Analysis, 2024
        • By Classification
        • By Application
    • Germany
      • Pricing Analysis
      • Market Share Analysis, 2024
        • By Classification
        • By Application
    • UK
      • Pricing Analysis
      • Market Share Analysis, 2024
        • By Classification
        • By Application
    • Italy
      • Pricing Analysis
      • Market Share Analysis, 2024
        • By Classification
        • By Application
    • Spain
      • Pricing Analysis
      • Market Share Analysis, 2024
        • By Classification
        • By Application
    • France
      • Pricing Analysis
      • Market Share Analysis, 2024
        • By Classification
        • By Application
    • India
      • Pricing Analysis
      • Market Share Analysis, 2024
        • By Classification
        • By Application
    • ASEAN
      • Pricing Analysis
      • Market Share Analysis, 2024
        • By Classification
        • By Application
    • Australia & New Zealand
      • Pricing Analysis
      • Market Share Analysis, 2024
        • By Classification
        • By Application
    • China
      • Pricing Analysis
      • Market Share Analysis, 2024
        • By Classification
        • By Application
    • Japan
      • Pricing Analysis
      • Market Share Analysis, 2024
        • By Classification
        • By Application
    • South Korea
      • Pricing Analysis
      • Market Share Analysis, 2024
        • By Classification
        • By Application
    • Russia
      • Pricing Analysis
      • Market Share Analysis, 2024
        • By Classification
        • By Application
    • Poland
      • Pricing Analysis
      • Market Share Analysis, 2024
        • By Classification
        • By Application
    • Hungary
      • Pricing Analysis
      • Market Share Analysis, 2024
        • By Classification
        • By Application
    • Kingdom of Saudi Arabia
      • Pricing Analysis
      • Market Share Analysis, 2024
        • By Classification
        • By Application
    • Turkiye
      • Pricing Analysis
      • Market Share Analysis, 2024
        • By Classification
        • By Application
    • South Africa
      • Pricing Analysis
      • Market Share Analysis, 2024
        • By Classification
        • By Application
  17. Market Structure Analysis
    • Competition Dashboard
    • Competition Benchmarking
    • Market Share Analysis of Top Players
      • By Regional
      • By Classification
      • By Application
  18. Competition Analysis
    • Competition Deep Dive
      • Babcock & Wilcox
        • Overview
        • Product Portfolio
        • Profitability by Market Segments (Product/Age /Sales Channel/Region)
        • Sales Footprint
        • Strategy Overview
          • Marketing Strategy
          • Product Strategy
          • Channel Strategy
      • UCC Environmental
      • Wastequip
      • Ironclad Environmental
      • ParkUSA (ParkProcess)
      • Con-Fab
      • Spectrum Water Technology
      • DumpsterLiners
      • Morrow Water Technologies
      • E-Pak Manufacturing
  19. Assumptions & Acronyms Used
  20. Research Methodology

List of Tables

  • Table 1: Global Market Value (USD Million) Forecast by Region, 2020 to 2035
  • Table 2: Global Market Value (USD Million) Forecast by Classification , 2020 to 2035
  • Table 3: Global Market Value (USD Million) Forecast by Application, 2020 to 2035
  • Table 4: North America Market Value (USD Million) Forecast by Country, 2020 to 2035
  • Table 5: North America Market Value (USD Million) Forecast by Classification , 2020 to 2035
  • Table 6: North America Market Value (USD Million) Forecast by Application, 2020 to 2035
  • Table 7: Latin America Market Value (USD Million) Forecast by Country, 2020 to 2035
  • Table 8: Latin America Market Value (USD Million) Forecast by Classification , 2020 to 2035
  • Table 9: Latin America Market Value (USD Million) Forecast by Application, 2020 to 2035
  • Table 10: Western Europe Market Value (USD Million) Forecast by Country, 2020 to 2035
  • Table 11: Western Europe Market Value (USD Million) Forecast by Classification , 2020 to 2035
  • Table 12: Western Europe Market Value (USD Million) Forecast by Application, 2020 to 2035
  • Table 13: Eastern Europe Market Value (USD Million) Forecast by Country, 2020 to 2035
  • Table 14: Eastern Europe Market Value (USD Million) Forecast by Classification , 2020 to 2035
  • Table 15: Eastern Europe Market Value (USD Million) Forecast by Application, 2020 to 2035
  • Table 16: East Asia Market Value (USD Million) Forecast by Country, 2020 to 2035
  • Table 17: East Asia Market Value (USD Million) Forecast by Classification , 2020 to 2035
  • Table 18: East Asia Market Value (USD Million) Forecast by Application, 2020 to 2035
  • Table 19: South Asia and Pacific Market Value (USD Million) Forecast by Country, 2020 to 2035
  • Table 20: South Asia and Pacific Market Value (USD Million) Forecast by Classification , 2020 to 2035
  • Table 21: South Asia and Pacific Market Value (USD Million) Forecast by Application, 2020 to 2035
  • Table 22: Middle East & Africa Market Value (USD Million) Forecast by Country, 2020 to 2035
  • Table 23: Middle East & Africa Market Value (USD Million) Forecast by Classification , 2020 to 2035
  • Table 24: Middle East & Africa Market Value (USD Million) Forecast by Application, 2020 to 2035

List of Figures

  • Figure 1: Global Market Pricing Analysis
  • Figure 2: Global Market Value (USD Million) Forecast 2020-2035
  • Figure 3: Global Market Value Share and BPS Analysis by Classification , 2025 and 2035
  • Figure 4: Global Market Y to o to Y Growth Comparison by Classification , 2025-2035
  • Figure 5: Global Market Attractiveness Analysis by Classification
  • Figure 6: Global Market Value Share and BPS Analysis by Application, 2025 and 2035
  • Figure 7: Global Market Y to o to Y Growth Comparison by Application, 2025-2035
  • Figure 8: Global Market Attractiveness Analysis by Application
  • Figure 9: Global Market Value (USD Million) Share and BPS Analysis by Region, 2025 and 2035
  • Figure 10: Global Market Y to o to Y Growth Comparison by Region, 2025-2035
  • Figure 11: Global Market Attractiveness Analysis by Region
  • Figure 12: North America Market Incremental Dollar Opportunity, 2025-2035
  • Figure 13: Latin America Market Incremental Dollar Opportunity, 2025-2035
  • Figure 14: Western Europe Market Incremental Dollar Opportunity, 2025-2035
  • Figure 15: Eastern Europe Market Incremental Dollar Opportunity, 2025-2035
  • Figure 16: East Asia Market Incremental Dollar Opportunity, 2025-2035
  • Figure 17: South Asia and Pacific Market Incremental Dollar Opportunity, 2025-2035
  • Figure 18: Middle East & Africa Market Incremental Dollar Opportunity, 2025-2035
  • Figure 19: North America Market Value Share and BPS Analysis by Country, 2025 and 2035
  • Figure 20: North America Market Value Share and BPS Analysis by Classification , 2025 and 2035
  • Figure 21: North America Market Y to o to Y Growth Comparison by Classification , 2025-2035
  • Figure 22: North America Market Attractiveness Analysis by Classification
  • Figure 23: North America Market Value Share and BPS Analysis by Application, 2025 and 2035
  • Figure 24: North America Market Y to o to Y Growth Comparison by Application, 2025-2035
  • Figure 25: North America Market Attractiveness Analysis by Application
  • Figure 26: Latin America Market Value Share and BPS Analysis by Country, 2025 and 2035
  • Figure 27: Latin America Market Value Share and BPS Analysis by Classification , 2025 and 2035
  • Figure 28: Latin America Market Y to o to Y Growth Comparison by Classification , 2025-2035
  • Figure 29: Latin America Market Attractiveness Analysis by Classification
  • Figure 30: Latin America Market Value Share and BPS Analysis by Application, 2025 and 2035
  • Figure 31: Latin America Market Y to o to Y Growth Comparison by Application, 2025-2035
  • Figure 32: Latin America Market Attractiveness Analysis by Application
  • Figure 33: Western Europe Market Value Share and BPS Analysis by Country, 2025 and 2035
  • Figure 34: Western Europe Market Value Share and BPS Analysis by Classification , 2025 and 2035
  • Figure 35: Western Europe Market Y to o to Y Growth Comparison by Classification , 2025-2035
  • Figure 36: Western Europe Market Attractiveness Analysis by Classification
  • Figure 37: Western Europe Market Value Share and BPS Analysis by Application, 2025 and 2035
  • Figure 38: Western Europe Market Y to o to Y Growth Comparison by Application, 2025-2035
  • Figure 39: Western Europe Market Attractiveness Analysis by Application
  • Figure 40: Eastern Europe Market Value Share and BPS Analysis by Country, 2025 and 2035
  • Figure 41: Eastern Europe Market Value Share and BPS Analysis by Classification , 2025 and 2035
  • Figure 42: Eastern Europe Market Y to o to Y Growth Comparison by Classification , 2025-2035
  • Figure 43: Eastern Europe Market Attractiveness Analysis by Classification
  • Figure 44: Eastern Europe Market Value Share and BPS Analysis by Application, 2025 and 2035
  • Figure 45: Eastern Europe Market Y to o to Y Growth Comparison by Application, 2025-2035
  • Figure 46: Eastern Europe Market Attractiveness Analysis by Application
  • Figure 47: East Asia Market Value Share and BPS Analysis by Country, 2025 and 2035
  • Figure 48: East Asia Market Value Share and BPS Analysis by Classification , 2025 and 2035
  • Figure 49: East Asia Market Y to o to Y Growth Comparison by Classification , 2025-2035
  • Figure 50: East Asia Market Attractiveness Analysis by Classification
  • Figure 51: East Asia Market Value Share and BPS Analysis by Application, 2025 and 2035
  • Figure 52: East Asia Market Y to o to Y Growth Comparison by Application, 2025-2035
  • Figure 53: East Asia Market Attractiveness Analysis by Application
  • Figure 54: South Asia and Pacific Market Value Share and BPS Analysis by Country, 2025 and 2035
  • Figure 55: South Asia and Pacific Market Value Share and BPS Analysis by Classification , 2025 and 2035
  • Figure 56: South Asia and Pacific Market Y to o to Y Growth Comparison by Classification , 2025-2035
  • Figure 57: South Asia and Pacific Market Attractiveness Analysis by Classification
  • Figure 58: South Asia and Pacific Market Value Share and BPS Analysis by Application, 2025 and 2035
  • Figure 59: South Asia and Pacific Market Y to o to Y Growth Comparison by Application, 2025-2035
  • Figure 60: South Asia and Pacific Market Attractiveness Analysis by Application
  • Figure 61: Middle East & Africa Market Value Share and BPS Analysis by Country, 2025 and 2035
  • Figure 62: Middle East & Africa Market Value Share and BPS Analysis by Classification , 2025 and 2035
  • Figure 63: Middle East & Africa Market Y to o to Y Growth Comparison by Classification , 2025-2035
  • Figure 64: Middle East & Africa Market Attractiveness Analysis by Classification
  • Figure 65: Middle East & Africa Market Value Share and BPS Analysis by Application, 2025 and 2035
  • Figure 66: Middle East & Africa Market Y to o to Y Growth Comparison by Application, 2025-2035
  • Figure 67: Middle East & Africa Market Attractiveness Analysis by Application
  • Figure 68: Global Market - Tier Structure Analysis
  • Figure 69: Global Market - Company Share Analysis

Frequently Asked Questions

How big is the dewatering bin market in 2025?

The global dewatering bin market is estimated to be valued at USD 125.9 million in 2025.

What will be the size of dewatering bin market in 2035?

The market size for the dewatering bin market is projected to reach USD 193.6 million by 2035.

How much will be the dewatering bin market growth between 2025 and 2035?

The dewatering bin market is expected to grow at a 4.4% CAGR between 2025 and 2035.

What are the key product types in the dewatering bin market?

The key product types in dewatering bin market are gravity sedimentation type, mechanical filter press type and others.

Which application segment to contribute significant share in the dewatering bin market in 2025?

In terms of application, wastewater treatment and municipal engineering segment to command 44.1% share in the dewatering bin market in 2025.

Explore Similar Insights

Future Market Insights

Dewatering Bin Market

Chat With MaRIA

Chat With

MaRIA

Hi There, I am MaRIA, Your Market Research Intelligence Assistant. How may I help you?