The binoculars and mounting solutions market will be growing at CAGR of 3.5% and is expected to reach USD 10,790.8 Million by 2035. In addition, the increasing popularity of adventure tourism and ecological monitoring, along with the availability of small-sized, high-performance optical devices in the market, is another factor that drives the consumer acceptance.
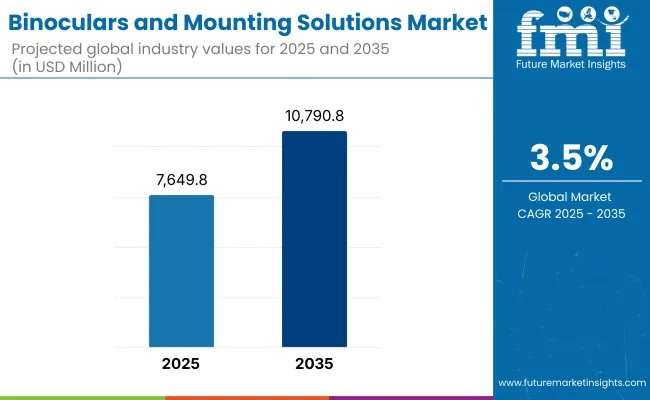
The binoculars and mounting solutions market is set to see strong growth from 2025 to 2035. This growth is driven by more demand for military use, wildlife watching, outdoor fun, and sports. New tech in lenses, a rise in birdwatching and stargazing fans, and higher defense spending around the globe are pushing the market ahead. Also, new light materials, better image stability, and links with digital tech are making binoculars and their mounts more useful and attractive.
The demand for binoculars is particularly on the rise in the defense sector, with words and contracts seeing increased usage of binoculars for land survey, space exploration as well as maritime navigation acts as a prime growth driver of the binoculars and mounting solutions market. The market is also advantageous for modernisation of optical technologies, image stabilisation and robust and weather resistant mounting solutions that are well suited in rough conditions.
Defense Segment Dominates with Demand for Tactical and Long-Range Vision Systems
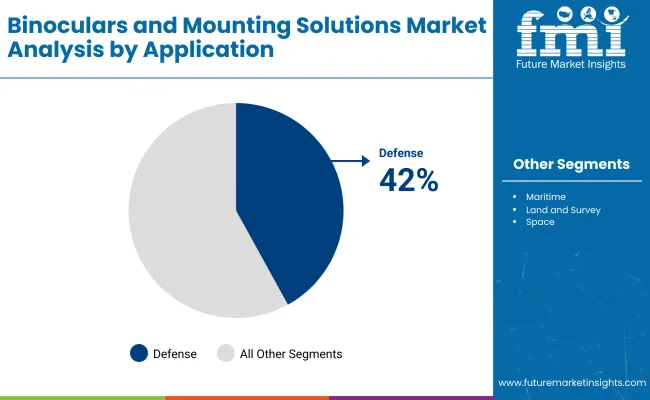
The largest segment is defense, assisted by increasing investments in border monitoring, reconnaissance missions, and binoculars mounted with night vision. Military militaries worldwide are increasingly adopting tripod or combat-type binocular systems mounted either on legs only or on vehicles to improve day and night operational efficiency.
Increasing defense modernization programs in various regions including North America, Europe and Asia-Pacific are continuously promoting the market for high-performance optics and mounting accessories.
High-Magnification (4X+) Binoculars Lead with Precision and Long-Distance Capability
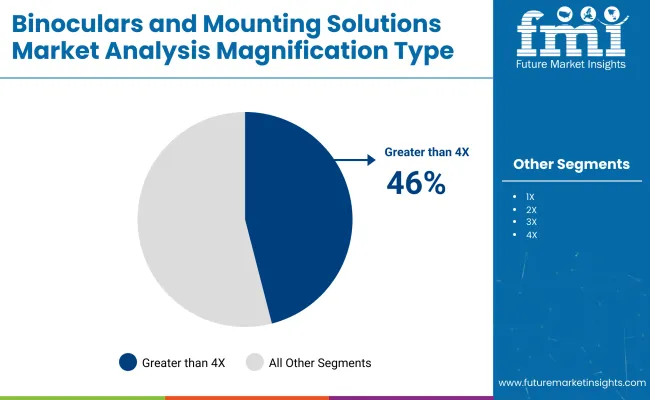
The greater than 4X magnification segment accounted for the largest market share owing to their application in long-range surveillance, marine spotting as well as astronomical viewing. Binoculars with high magnification, often with gyroscopic stabilizers and laser rangefinders, are critical for both military reconnaissance and for observation of outer space.
Technological innovations such as multi-coated lenses, thermal imaging integration, and lightweight yet durable mounts are improving usability and driving adoption and usage in mission-critical applications.
Price Sensitivity and Market Fragmentation
Price sensitivity among consumers is one of the major challenges faced in the binoculars and mounting solutions market, especially in emerging markets. The high-end binoculars in the premium segment also boast of excellent functionality while a considerable percentage of people choose the economy type to suffer from poor construction. The market is further fragmented, with multiple local and international brands competing at different price levels, which can restrict profitability.
Integration of Smart Features and Customization
Smart technologies like augmented reality (AR), GPS tagging, and connectivity to mobile apps are starting to break new ground in the binoculars and mounting solutions market. These innovations are particularly appealing in the adventure and defence context, where improved situational awareness matters more than ever. Customizable options in design, lens configuration, and mounting features allow vendors to cater to niche user needs, driving brand loyalty and repeat purchases.
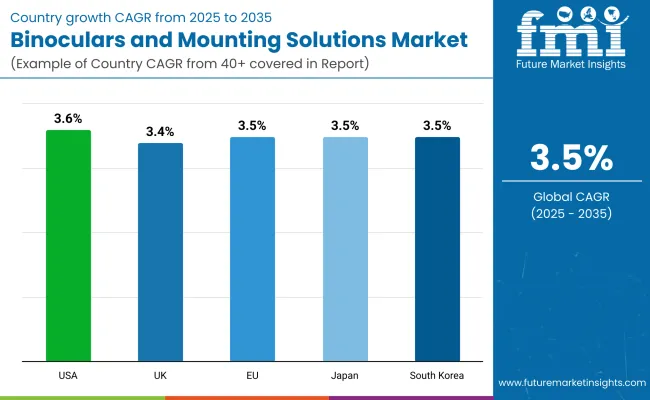
The binoculars and mounting solutions market in the USA is anticipated to grow at a considerable rate during the forecast period, between 2023 and 2028. People are more fond of outdoor activities such as birdwatching, hiking, and hunting. More of these products are also needed in the defense and security sectors. Agencies including the USA Fish and Wildlife Service and the Department of Defense help prop up demand by purchasing goods and tracking wildlife.
Among such trends is the increasing use of image-stabilized and night-vision binoculars, the willingness to pay more for robust but lightweight mounting systems and more people using binoculars for stargazing.
Country | CAGR (2025 to 2035) |
---|---|
USA | 3.6% |
In the UK, more people are buying binoculars. They use them for eco-trips, watching wildlife, and fun sports such as sailing and shooting. The Ministry of Defence and nature groups also help the market by updating gear and doing ecological surveys.
People want small, waterproof binoculars. They're also shopping more online. New ideas for binoculars include those that can stand on a tripod and hands-free sets.
Country | CAGR (2025 to 2035) |
---|---|
UK | 3.4% |
The market for binoculars and mounting solutions in the European Union is growing fast. People are more into nature walks, mountain sports, and there is rising demand for new military gear. Programs across the EU that help with studying the environment and watching over borders add to this demand.
Germany, France, and Italy are important spots for this market. We see new trends like a move toward easy-to-handle and high-zoom binoculars, more use in military practice, and a rise in using mounting kits that fit many optical tools.
Region | CAGR (2025 to 2035) |
---|---|
European Union | 3.5% |
Japan's market grows due to widespread use of binoculars at cultural events, marine sports, and nature watching. There is also more need in sea surveillance and defense. The Ministry of Defense, along with local outdoor gear brands, help expand the market.
Trends involve making better optics, more use of binoculars for stargazing and concerts, and creating mounts that adjust and resist shocks.
Country | CAGR (2025 to 2035) |
---|---|
Japan | 3.5% |
In South Korea, the market for binoculars and mounting solutions is growing quickly. This is because more people are traveling for fun, and there is a need for better border safety. There is also more money going into sports optics. Government groups and private safety firms are main users of new optical tools.
Key trends in the market are making high-power binoculars smaller, adding digital imaging, and creating modular mounting systems for fast use in the field.
Country | CAGR (2025 to 2035) |
---|---|
South Korea | 3.5% |
The binoculars and mounting solutions market is growing well. This growth comes from outdoor fun, birdwatching, stargazing, and defense uses. Big names like Nikon, Canon, Carl Zeiss, Leica, and Vortex Optics lead the charge. They use top-notch lens tech, picture stabilization, comfy designs, and strong mounts. These help both hobbyists and pros.
Companies aim to stand out, grow reach worldwide, and connect with Gen Z through social media about stars and nature. New ideas like waterproof, fog-proof, and good in low light have spread uses. Though big firms hold most of the market, local brands and new firms are rising with cheap but good products for outdoor and tactical needs. Growing wants in North America, Europe, and Asia-Pacific show a bright future for 2025 and later. Green practices, digital features, and easy-to-carry products are key to winning.
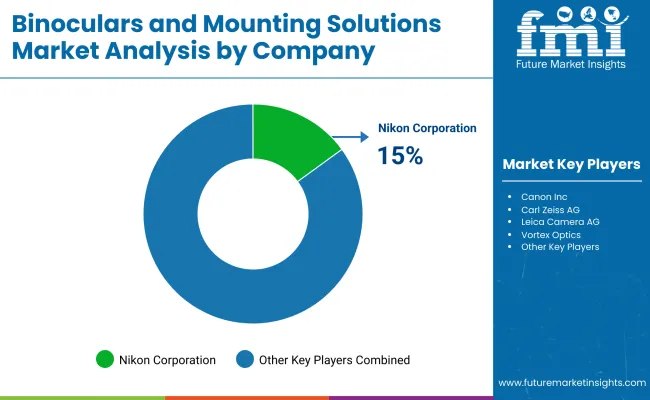
Nikon Corporation (15-18%)
Nikon leverages its extensive experience in optics to offer a diverse range of binoculars, focusing on durability and performance in various environmental conditions.
Canon Inc. (12-15%)
Canon integrates advanced image stabilization technologies into its binoculars, appealing to users requiring steady viewing experiences, such as in marine and astronomical observations.
Carl Zeiss AG (10-13%)
Carl Zeiss emphasizes precision engineering and optical clarity, catering to professional and enthusiast markets in birdwatching and nature observation.
Leica Camera AG (8-11%)
Leica focuses on premium craftsmanship and optical performance, attracting users seeking high-end binoculars for various applications.
Vortex Optics (6-9%)
Vortex targets the hunting and tactical markets with robust and reliable optics and mounting solutions, emphasizing customer service and warranty programs.
Other Key Players (35-49% Combined)
Several other companies contribute significantly to the binoculars and mounting solutions market:
Table 1: Global Binoculars and Mounting Solutions Market Value (US$ Mn) Forecast by Region, 2017-2032
Table 2: Global Binoculars and Mounting Solutions Market Volume (Units) Forecast by Region, 2017-2032
Table 3: Global Binoculars and Mounting Solutions Market Value (US$ Mn) Forecast by Product Type, 2017-2032
Table 4: Global Binoculars and Mounting Solutions Market Volume (Units) Forecast by Product Type, 2017-2032
Table 5: Global Binoculars and Mounting Solutions Market Value (US$ Mn) Forecast by Application, 2017-2032
Table 6: Global Binoculars and Mounting Solutions Market Volume (Units) Forecast by Application, 2017-2032
Table 7: Global Binoculars and Mounting Solutions Market Value (US$ Mn) Forecast by Sales Channel, 2017-2032
Table 8: Global Binoculars and Mounting Solutions Market Volume (Units) Forecast by Sales Channel, 2017-2032
Table 9: North America Binoculars and Mounting Solutions Market Value (US$ Mn) Forecast by Country, 2017-2032
Table 10: North America Binoculars and Mounting Solutions Market Volume (Units) Forecast by Country, 2017-2032
Table 11: North America Binoculars and Mounting Solutions Market Value (US$ Mn) Forecast by Product Type, 2017-2032
Table 12: North America Binoculars and Mounting Solutions Market Volume (Units) Forecast by Product Type, 2017-2032
Table 13: North America Binoculars and Mounting Solutions Market Value (US$ Mn) Forecast by Application, 2017-2032
Table 14: North America Binoculars and Mounting Solutions Market Volume (Units) Forecast by Application, 2017-2032
Table 15: North America Binoculars and Mounting Solutions Market Value (US$ Mn) Forecast by Sales Channel, 2017-2032
Table 16: North America Binoculars and Mounting Solutions Market Volume (Units) Forecast by Sales Channel, 2017-2032
Table 17: Latin America Binoculars and Mounting Solutions Market Value (US$ Mn) Forecast by Country, 2017-2032
Table 18: Latin America Binoculars and Mounting Solutions Market Volume (Units) Forecast by Country, 2017-2032
Table 19: Latin America Binoculars and Mounting Solutions Market Value (US$ Mn) Forecast by Product Type, 2017-2032
Table 20: Latin America Binoculars and Mounting Solutions Market Volume (Units) Forecast by Product Type, 2017-2032
Table 21: Latin America Binoculars and Mounting Solutions Market Value (US$ Mn) Forecast by Application, 2017-2032
Table 22: Latin America Binoculars and Mounting Solutions Market Volume (Units) Forecast by Application, 2017-2032
Table 23: Latin America Binoculars and Mounting Solutions Market Value (US$ Mn) Forecast by Sales Channel, 2017-2032
Table 24: Latin America Binoculars and Mounting Solutions Market Volume (Units) Forecast by Sales Channel, 2017-2032
Table 25: Europe Binoculars and Mounting Solutions Market Value (US$ Mn) Forecast by Country, 2017-2032
Table 26: Europe Binoculars and Mounting Solutions Market Volume (Units) Forecast by Country, 2017-2032
Table 27: Europe Binoculars and Mounting Solutions Market Value (US$ Mn) Forecast by Product Type, 2017-2032
Table 28: Europe Binoculars and Mounting Solutions Market Volume (Units) Forecast by Product Type, 2017-2032
Table 29: Europe Binoculars and Mounting Solutions Market Value (US$ Mn) Forecast by Application, 2017-2032
Table 30: Europe Binoculars and Mounting Solutions Market Volume (Units) Forecast by Application, 2017-2032
Table 31: Europe Binoculars and Mounting Solutions Market Value (US$ Mn) Forecast by Sales Channel, 2017-2032
Table 32: Europe Binoculars and Mounting Solutions Market Volume (Units) Forecast by Sales Channel, 2017-2032
Table 33: East Asia Binoculars and Mounting Solutions Market Value (US$ Mn) Forecast by Country, 2017-2032
Table 34: East Asia Binoculars and Mounting Solutions Market Volume (Units) Forecast by Country, 2017-2032
Table 35: East Asia Binoculars and Mounting Solutions Market Value (US$ Mn) Forecast by Product Type, 2017-2032
Table 36: East Asia Binoculars and Mounting Solutions Market Volume (Units) Forecast by Product Type, 2017-2032
Table 37: East Asia Binoculars and Mounting Solutions Market Value (US$ Mn) Forecast by Application, 2017-2032
Table 38: East Asia Binoculars and Mounting Solutions Market Volume (Units) Forecast by Application, 2017-2032
Table 39: East Asia Binoculars and Mounting Solutions Market Value (US$ Mn) Forecast by Sales Channel, 2017-2032
Table 40: East Asia Binoculars and Mounting Solutions Market Volume (Units) Forecast by Sales Channel, 2017-2032
Table 41: South Asia & Pacific Binoculars and Mounting Solutions Market Value (US$ Mn) Forecast by Country, 2017-2032
Table 42: South Asia & Pacific Binoculars and Mounting Solutions Market Volume (Units) Forecast by Country, 2017-2032
Table 43: South Asia & Pacific Binoculars and Mounting Solutions Market Value (US$ Mn) Forecast by Product Type, 2017-2032
Table 44: South Asia & Pacific Binoculars and Mounting Solutions Market Volume (Units) Forecast by Product Type, 2017-2032
Table 45: South Asia & Pacific Binoculars and Mounting Solutions Market Value (US$ Mn) Forecast by Application, 2017-2032
Table 46: South Asia & Pacific Binoculars and Mounting Solutions Market Volume (Units) Forecast by Application, 2017-2032
Table 47: South Asia & Pacific Binoculars and Mounting Solutions Market Value (US$ Mn) Forecast by Sales Channel, 2017-2032
Table 48: South Asia & Pacific Binoculars and Mounting Solutions Market Volume (Units) Forecast by Sales Channel, 2017-2032
Table 49: MEA Binoculars and Mounting Solutions Market Value (US$ Mn) Forecast by Country, 2017-2032
Table 50: MEA Binoculars and Mounting Solutions Market Volume (Units) Forecast by Country, 2017-2032
Table 51: MEA Binoculars and Mounting Solutions Market Value (US$ Mn) Forecast by Product Type, 2017-2032
Table 52: MEA Binoculars and Mounting Solutions Market Volume (Units) Forecast by Product Type, 2017-2032
Table 53: MEA Binoculars and Mounting Solutions Market Value (US$ Mn) Forecast by Application, 2017-2032
Table 54: MEA Binoculars and Mounting Solutions Market Volume (Units) Forecast by Application, 2017-2032
Table 55: MEA Binoculars and Mounting Solutions Market Value (US$ Mn) Forecast by Sales Channel, 2017-2032
Table 56: MEA Binoculars and Mounting Solutions Market Volume (Units) Forecast by Sales Channel, 2017-2032
Figure 1: Global Binoculars and Mounting Solutions Market Value (US$ Mn) by Product Type, 2022-2032
Figure 2: Global Binoculars and Mounting Solutions Market Value (US$ Mn) by Application, 2022-2032
Figure 3: Global Binoculars and Mounting Solutions Market Value (US$ Mn) by Sales Channel, 2022-2032
Figure 4: Global Binoculars and Mounting Solutions Market Value (US$ Mn) by Region, 2022-2032
Figure 5: Global Binoculars and Mounting Solutions Market Value (US$ Mn) Analysis by Region, 2017-2032
Figure 6: Global Binoculars and Mounting Solutions Market Volume (Units) Analysis by Region, 2017-2032
Figure 7: Global Binoculars and Mounting Solutions Market Value Share (%) and BPS Analysis by Region, 2022-2032
Figure 8: Global Binoculars and Mounting Solutions Market Y-o-Y Growth (%) Projections by Region, 2022-2032
Figure 9: Global Binoculars and Mounting Solutions Market Value (US$ Mn) Analysis by Product Type, 2017-2032
Figure 10: Global Binoculars and Mounting Solutions Market Volume (Units) Analysis by Product Type, 2017-2032
Figure 11: Global Binoculars and Mounting Solutions Market Value Share (%) and BPS Analysis by Product Type, 2022-2032
Figure 12: Global Binoculars and Mounting Solutions Market Y-o-Y Growth (%) Projections by Product Type, 2022-2032
Figure 13: Global Binoculars and Mounting Solutions Market Value (US$ Mn) Analysis by Application, 2017-2032
Figure 14: Global Binoculars and Mounting Solutions Market Volume (Units) Analysis by Application, 2017-2032
Figure 15: Global Binoculars and Mounting Solutions Market Value Share (%) and BPS Analysis by Application, 2022-2032
Figure 16: Global Binoculars and Mounting Solutions Market Y-o-Y Growth (%) Projections by Application, 2022-2032
Figure 17: Global Binoculars and Mounting Solutions Market Value (US$ Mn) Analysis by Sales Channel, 2017-2032
Figure 18: Global Binoculars and Mounting Solutions Market Volume (Units) Analysis by Sales Channel, 2017-2032
Figure 19: Global Binoculars and Mounting Solutions Market Value Share (%) and BPS Analysis by Sales Channel, 2022-2032
Figure 20: Global Binoculars and Mounting Solutions Market Y-o-Y Growth (%) Projections by Sales Channel, 2022-2032
Figure 21: Global Binoculars and Mounting Solutions Market Attractiveness by Product Type, 2022-2032
Figure 22: Global Binoculars and Mounting Solutions Market Attractiveness by Application, 2022-2032
Figure 23: Global Binoculars and Mounting Solutions Market Attractiveness by Sales Channel, 2022-2032
Figure 24: Global Binoculars and Mounting Solutions Market Attractiveness by Region, 2022-2032
Figure 25: North America Binoculars and Mounting Solutions Market Value (US$ Mn) by Product Type, 2022-2032
Figure 26: North America Binoculars and Mounting Solutions Market Value (US$ Mn) by Application, 2022-2032
Figure 27: North America Binoculars and Mounting Solutions Market Value (US$ Mn) by Sales Channel, 2022-2032
Figure 28: North America Binoculars and Mounting Solutions Market Value (US$ Mn) by Country, 2022-2032
Figure 29: North America Binoculars and Mounting Solutions Market Value (US$ Mn) Analysis by Country, 2017-2032
Figure 30: North America Binoculars and Mounting Solutions Market Volume (Units) Analysis by Country, 2017-2032
Figure 31: North America Binoculars and Mounting Solutions Market Value Share (%) and BPS Analysis by Country, 2022-2032
Figure 32: North America Binoculars and Mounting Solutions Market Y-o-Y Growth (%) Projections by Country, 2022-2032
Figure 33: North America Binoculars and Mounting Solutions Market Value (US$ Mn) Analysis by Product Type, 2017-2032
Figure 34: North America Binoculars and Mounting Solutions Market Volume (Units) Analysis by Product Type, 2017-2032
Figure 35: North America Binoculars and Mounting Solutions Market Value Share (%) and BPS Analysis by Product Type, 2022-2032
Figure 36: North America Binoculars and Mounting Solutions Market Y-o-Y Growth (%) Projections by Product Type, 2022-2032
Figure 37: North America Binoculars and Mounting Solutions Market Value (US$ Mn) Analysis by Application, 2017-2032
Figure 38: North America Binoculars and Mounting Solutions Market Volume (Units) Analysis by Application, 2017-2032
Figure 39: North America Binoculars and Mounting Solutions Market Value Share (%) and BPS Analysis by Application, 2022-2032
Figure 40: North America Binoculars and Mounting Solutions Market Y-o-Y Growth (%) Projections by Application, 2022-2032
Figure 41: North America Binoculars and Mounting Solutions Market Value (US$ Mn) Analysis by Sales Channel, 2017-2032
Figure 42: North America Binoculars and Mounting Solutions Market Volume (Units) Analysis by Sales Channel, 2017-2032
Figure 43: North America Binoculars and Mounting Solutions Market Value Share (%) and BPS Analysis by Sales Channel, 2022-2032
Figure 44: North America Binoculars and Mounting Solutions Market Y-o-Y Growth (%) Projections by Sales Channel, 2022-2032
Figure 45: North America Binoculars and Mounting Solutions Market Attractiveness by Product Type, 2022-2032
Figure 46: North America Binoculars and Mounting Solutions Market Attractiveness by Application, 2022-2032
Figure 47: North America Binoculars and Mounting Solutions Market Attractiveness by Sales Channel, 2022-2032
Figure 48: North America Binoculars and Mounting Solutions Market Attractiveness by Country, 2022-2032
Figure 49: Latin America Binoculars and Mounting Solutions Market Value (US$ Mn) by Product Type, 2022-2032
Figure 50: Latin America Binoculars and Mounting Solutions Market Value (US$ Mn) by Application, 2022-2032
Figure 51: Latin America Binoculars and Mounting Solutions Market Value (US$ Mn) by Sales Channel, 2022-2032
Figure 52: Latin America Binoculars and Mounting Solutions Market Value (US$ Mn) by Country, 2022-2032
Figure 53: Latin America Binoculars and Mounting Solutions Market Value (US$ Mn) Analysis by Country, 2017-2032
Figure 54: Latin America Binoculars and Mounting Solutions Market Volume (Units) Analysis by Country, 2017-2032
Figure 55: Latin America Binoculars and Mounting Solutions Market Value Share (%) and BPS Analysis by Country, 2022-2032
Figure 56: Latin America Binoculars and Mounting Solutions Market Y-o-Y Growth (%) Projections by Country, 2022-2032
Figure 57: Latin America Binoculars and Mounting Solutions Market Value (US$ Mn) Analysis by Product Type, 2017-2032
Figure 58: Latin America Binoculars and Mounting Solutions Market Volume (Units) Analysis by Product Type, 2017-2032
Figure 59: Latin America Binoculars and Mounting Solutions Market Value Share (%) and BPS Analysis by Product Type, 2022-2032
Figure 60: Latin America Binoculars and Mounting Solutions Market Y-o-Y Growth (%) Projections by Product Type, 2022-2032
Figure 61: Latin America Binoculars and Mounting Solutions Market Value (US$ Mn) Analysis by Application, 2017-2032
Figure 62: Latin America Binoculars and Mounting Solutions Market Volume (Units) Analysis by Application, 2017-2032
Figure 63: Latin America Binoculars and Mounting Solutions Market Value Share (%) and BPS Analysis by Application, 2022-2032
Figure 64: Latin America Binoculars and Mounting Solutions Market Y-o-Y Growth (%) Projections by Application, 2022-2032
Figure 65: Latin America Binoculars and Mounting Solutions Market Value (US$ Mn) Analysis by Sales Channel, 2017-2032
Figure 66: Latin America Binoculars and Mounting Solutions Market Volume (Units) Analysis by Sales Channel, 2017-2032
Figure 67: Latin America Binoculars and Mounting Solutions Market Value Share (%) and BPS Analysis by Sales Channel, 2022-2032
Figure 68: Latin America Binoculars and Mounting Solutions Market Y-o-Y Growth (%) Projections by Sales Channel, 2022-2032
Figure 69: Latin America Binoculars and Mounting Solutions Market Attractiveness by Product Type, 2022-2032
Figure 70: Latin America Binoculars and Mounting Solutions Market Attractiveness by Application, 2022-2032
Figure 71: Latin America Binoculars and Mounting Solutions Market Attractiveness by Sales Channel, 2022-2032
Figure 72: Latin America Binoculars and Mounting Solutions Market Attractiveness by Country, 2022-2032
Figure 73: Europe Binoculars and Mounting Solutions Market Value (US$ Mn) by Product Type, 2022-2032
Figure 74: Europe Binoculars and Mounting Solutions Market Value (US$ Mn) by Application, 2022-2032
Figure 75: Europe Binoculars and Mounting Solutions Market Value (US$ Mn) by Sales Channel, 2022-2032
Figure 76: Europe Binoculars and Mounting Solutions Market Value (US$ Mn) by Country, 2022-2032
Figure 77: Europe Binoculars and Mounting Solutions Market Value (US$ Mn) Analysis by Country, 2017-2032
Figure 78: Europe Binoculars and Mounting Solutions Market Volume (Units) Analysis by Country, 2017-2032
Figure 79: Europe Binoculars and Mounting Solutions Market Value Share (%) and BPS Analysis by Country, 2022-2032
Figure 80: Europe Binoculars and Mounting Solutions Market Y-o-Y Growth (%) Projections by Country, 2022-2032
Figure 81: Europe Binoculars and Mounting Solutions Market Value (US$ Mn) Analysis by Product Type, 2017-2032
Figure 82: Europe Binoculars and Mounting Solutions Market Volume (Units) Analysis by Product Type, 2017-2032
Figure 83: Europe Binoculars and Mounting Solutions Market Value Share (%) and BPS Analysis by Product Type, 2022-2032
Figure 84: Europe Binoculars and Mounting Solutions Market Y-o-Y Growth (%) Projections by Product Type, 2022-2032
Figure 85: Europe Binoculars and Mounting Solutions Market Value (US$ Mn) Analysis by Application, 2017-2032
Figure 86: Europe Binoculars and Mounting Solutions Market Volume (Units) Analysis by Application, 2017-2032
Figure 87: Europe Binoculars and Mounting Solutions Market Value Share (%) and BPS Analysis by Application, 2022-2032
Figure 88: Europe Binoculars and Mounting Solutions Market Y-o-Y Growth (%) Projections by Application, 2022-2032
Figure 89: Europe Binoculars and Mounting Solutions Market Value (US$ Mn) Analysis by Sales Channel, 2017-2032
Figure 90: Europe Binoculars and Mounting Solutions Market Volume (Units) Analysis by Sales Channel, 2017-2032
Figure 91: Europe Binoculars and Mounting Solutions Market Value Share (%) and BPS Analysis by Sales Channel, 2022-2032
Figure 92: Europe Binoculars and Mounting Solutions Market Y-o-Y Growth (%) Projections by Sales Channel, 2022-2032
Figure 93: Europe Binoculars and Mounting Solutions Market Attractiveness by Product Type, 2022-2032
Figure 94: Europe Binoculars and Mounting Solutions Market Attractiveness by Application, 2022-2032
Figure 95: Europe Binoculars and Mounting Solutions Market Attractiveness by Sales Channel, 2022-2032
Figure 96: Europe Binoculars and Mounting Solutions Market Attractiveness by Country, 2022-2032
Figure 97: East Asia Binoculars and Mounting Solutions Market Value (US$ Mn) by Product Type, 2022-2032
Figure 98: East Asia Binoculars and Mounting Solutions Market Value (US$ Mn) by Application, 2022-2032
Figure 99: East Asia Binoculars and Mounting Solutions Market Value (US$ Mn) by Sales Channel, 2022-2032
Figure 100: East Asia Binoculars and Mounting Solutions Market Value (US$ Mn) by Country, 2022-2032
Figure 101: East Asia Binoculars and Mounting Solutions Market Value (US$ Mn) Analysis by Country, 2017-2032
Figure 102: East Asia Binoculars and Mounting Solutions Market Volume (Units) Analysis by Country, 2017-2032
Figure 103: East Asia Binoculars and Mounting Solutions Market Value Share (%) and BPS Analysis by Country, 2022-2032
Figure 104: East Asia Binoculars and Mounting Solutions Market Y-o-Y Growth (%) Projections by Country, 2022-2032
Figure 105: East Asia Binoculars and Mounting Solutions Market Value (US$ Mn) Analysis by Product Type, 2017-2032
Figure 106: East Asia Binoculars and Mounting Solutions Market Volume (Units) Analysis by Product Type, 2017-2032
Figure 107: East Asia Binoculars and Mounting Solutions Market Value Share (%) and BPS Analysis by Product Type, 2022-2032
Figure 108: East Asia Binoculars and Mounting Solutions Market Y-o-Y Growth (%) Projections by Product Type, 2022-2032
Figure 109: East Asia Binoculars and Mounting Solutions Market Value (US$ Mn) Analysis by Application, 2017-2032
Figure 110: East Asia Binoculars and Mounting Solutions Market Volume (Units) Analysis by Application, 2017-2032
Figure 111: East Asia Binoculars and Mounting Solutions Market Value Share (%) and BPS Analysis by Application, 2022-2032
Figure 112: East Asia Binoculars and Mounting Solutions Market Y-o-Y Growth (%) Projections by Application, 2022-2032
Figure 113: East Asia Binoculars and Mounting Solutions Market Value (US$ Mn) Analysis by Sales Channel, 2017-2032
Figure 114: East Asia Binoculars and Mounting Solutions Market Volume (Units) Analysis by Sales Channel, 2017-2032
Figure 115: East Asia Binoculars and Mounting Solutions Market Value Share (%) and BPS Analysis by Sales Channel, 2022-2032
Figure 116: East Asia Binoculars and Mounting Solutions Market Y-o-Y Growth (%) Projections by Sales Channel, 2022-2032
Figure 117: East Asia Binoculars and Mounting Solutions Market Attractiveness by Product Type, 2022-2032
Figure 118: East Asia Binoculars and Mounting Solutions Market Attractiveness by Application, 2022-2032
Figure 119: East Asia Binoculars and Mounting Solutions Market Attractiveness by Sales Channel, 2022-2032
Figure 120: East Asia Binoculars and Mounting Solutions Market Attractiveness by Country, 2022-2032
Figure 121: South Asia & Pacific Binoculars and Mounting Solutions Market Value (US$ Mn) by Product Type, 2022-2032
Figure 122: South Asia & Pacific Binoculars and Mounting Solutions Market Value (US$ Mn) by Application, 2022-2032
Figure 123: South Asia & Pacific Binoculars and Mounting Solutions Market Value (US$ Mn) by Sales Channel, 2022-2032
Figure 124: South Asia & Pacific Binoculars and Mounting Solutions Market Value (US$ Mn) by Country, 2022-2032
Figure 125: South Asia & Pacific Binoculars and Mounting Solutions Market Value (US$ Mn) Analysis by Country, 2017-2032
Figure 126: South Asia & Pacific Binoculars and Mounting Solutions Market Volume (Units) Analysis by Country, 2017-2032
Figure 127: South Asia & Pacific Binoculars and Mounting Solutions Market Value Share (%) and BPS Analysis by Country, 2022-2032
Figure 128: South Asia & Pacific Binoculars and Mounting Solutions Market Y-o-Y Growth (%) Projections by Country, 2022-2032
Figure 129: South Asia & Pacific Binoculars and Mounting Solutions Market Value (US$ Mn) Analysis by Product Type, 2017-2032
Figure 130: South Asia & Pacific Binoculars and Mounting Solutions Market Volume (Units) Analysis by Product Type, 2017-2032
Figure 131: South Asia & Pacific Binoculars and Mounting Solutions Market Value Share (%) and BPS Analysis by Product Type, 2022-2032
Figure 132: South Asia & Pacific Binoculars and Mounting Solutions Market Y-o-Y Growth (%) Projections by Product Type, 2022-2032
Figure 133: South Asia & Pacific Binoculars and Mounting Solutions Market Value (US$ Mn) Analysis by Application, 2017-2032
Figure 134: South Asia & Pacific Binoculars and Mounting Solutions Market Volume (Units) Analysis by Application, 2017-2032
Figure 135: South Asia & Pacific Binoculars and Mounting Solutions Market Value Share (%) and BPS Analysis by Application, 2022-2032
Figure 136: South Asia & Pacific Binoculars and Mounting Solutions Market Y-o-Y Growth (%) Projections by Application, 2022-2032
Figure 137: South Asia & Pacific Binoculars and Mounting Solutions Market Value (US$ Mn) Analysis by Sales Channel, 2017-2032
Figure 138: South Asia & Pacific Binoculars and Mounting Solutions Market Volume (Units) Analysis by Sales Channel, 2017-2032
Figure 139: South Asia & Pacific Binoculars and Mounting Solutions Market Value Share (%) and BPS Analysis by Sales Channel, 2022-2032
Figure 140: South Asia & Pacific Binoculars and Mounting Solutions Market Y-o-Y Growth (%) Projections by Sales Channel, 2022-2032
Figure 141: South Asia & Pacific Binoculars and Mounting Solutions Market Attractiveness by Product Type, 2022-2032
Figure 142: South Asia & Pacific Binoculars and Mounting Solutions Market Attractiveness by Application, 2022-2032
Figure 143: South Asia & Pacific Binoculars and Mounting Solutions Market Attractiveness by Sales Channel, 2022-2032
Figure 144: South Asia & Pacific Binoculars and Mounting Solutions Market Attractiveness by Country, 2022-2032
Figure 145: MEA Binoculars and Mounting Solutions Market Value (US$ Mn) by Product Type, 2022-2032
Figure 146: MEA Binoculars and Mounting Solutions Market Value (US$ Mn) by Application, 2022-2032
Figure 147: MEA Binoculars and Mounting Solutions Market Value (US$ Mn) by Sales Channel, 2022-2032
Figure 148: MEA Binoculars and Mounting Solutions Market Value (US$ Mn) by Country, 2022-2032
Figure 149: MEA Binoculars and Mounting Solutions Market Value (US$ Mn) Analysis by Country, 2017-2032
Figure 150: MEA Binoculars and Mounting Solutions Market Volume (Units) Analysis by Country, 2017-2032
Figure 151: MEA Binoculars and Mounting Solutions Market Value Share (%) and BPS Analysis by Country, 2022-2032
Figure 152: MEA Binoculars and Mounting Solutions Market Y-o-Y Growth (%) Projections by Country, 2022-2032
Figure 153: MEA Binoculars and Mounting Solutions Market Value (US$ Mn) Analysis by Product Type, 2017-2032
Figure 154: MEA Binoculars and Mounting Solutions Market Volume (Units) Analysis by Product Type, 2017-2032
Figure 155: MEA Binoculars and Mounting Solutions Market Value Share (%) and BPS Analysis by Product Type, 2022-2032
Figure 156: MEA Binoculars and Mounting Solutions Market Y-o-Y Growth (%) Projections by Product Type, 2022-2032
Figure 157: MEA Binoculars and Mounting Solutions Market Value (US$ Mn) Analysis by Application, 2017-2032
Figure 158: MEA Binoculars and Mounting Solutions Market Volume (Units) Analysis by Application, 2017-2032
Figure 159: MEA Binoculars and Mounting Solutions Market Value Share (%) and BPS Analysis by Application, 2022-2032
Figure 160: MEA Binoculars and Mounting Solutions Market Y-o-Y Growth (%) Projections by Application, 2022-2032
Figure 161: MEA Binoculars and Mounting Solutions Market Value (US$ Mn) Analysis by Sales Channel, 2017-2032
Figure 162: MEA Binoculars and Mounting Solutions Market Volume (Units) Analysis by Sales Channel, 2017-2032
Figure 163: MEA Binoculars and Mounting Solutions Market Value Share (%) and BPS Analysis by Sales Channel, 2022-2032
Figure 164: MEA Binoculars and Mounting Solutions Market Y-o-Y Growth (%) Projections by Sales Channel, 2022-2032
Figure 165: MEA Binoculars and Mounting Solutions Market Attractiveness by Product Type, 2022-2032
Figure 166: MEA Binoculars and Mounting Solutions Market Attractiveness by Application, 2022-2032
Figure 167: MEA Binoculars and Mounting Solutions Market Attractiveness by Sales Channel, 2022-2032
Figure 168: MEA Binoculars and Mounting Solutions Market Attractiveness by Country, 2022-2032
The overall market size for the binoculars and mounting solutions market was approximately USD 7,649.8 Million in 2025.
The binoculars and mounting solutions market is projected to reach approximately USD 10,790.8 Million by 2035.
Increasing participation in outdoor recreational activities, advancements in optical technologies, and growing demand from military and defense sectors are expected to drive market growth.
The United States, China, Germany, Japan, and the United Kingdom are key contributors.
The roof prism binoculars segment is expected to lead due to their compact design and superior image quality.
Explore Automation Auxiliary Insights
Thank you!
You will receive an email from our Business Development Manager. Please be sure to check your SPAM/JUNK folder too.