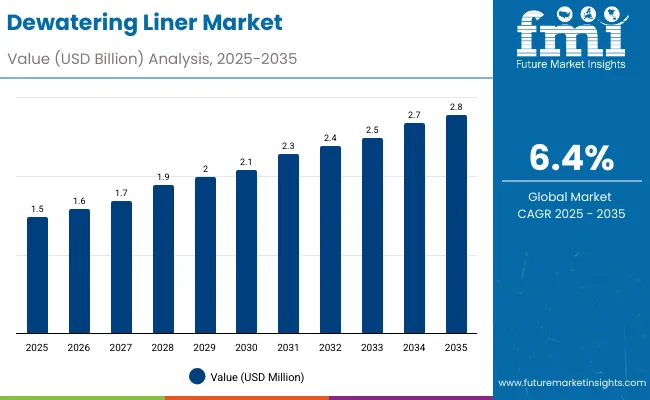
The dewatering liner market will grow from USD 1.5 billion in 2025 to USD 2.8 billion by 2035, expanding at a CAGR of 6.4%. Rising wastewater treatment infrastructure, mining expansion, and agricultural waste management initiatives are driving adoption. PP-based liners lead due to strength, permeability, and cost-effectiveness.
| Metric | Value |
|---|---|
| Industry Size (2025E) | USD 1.5 billion |
| Industry Value (2035F) | USD 2.8 billion |
| CAGR (2025 to 2035) | 6.4% |
Between 2025 and 2030, demand will increase by USD 0.6 billion, led by industrial and municipal wastewater projects. By 2035, wider use in mining, sludge processing, and agriculture will drive a USD 1.3 billion market. Asia-Pacific will remain the fastest-growing region, supported by government-funded water treatment programs.
From 2020 to 2024, the dewatering liner market grew steadily, driven by sludge management regulations and industrial effluent control mandates. Adoption expanded across wastewater, mining, and municipal waste applications. Polypropylene and geotextile liners gained prominence for durability and filtration performance.
By 2035, the market will reach USD 2.8 billion, with Asia-Pacific and North America leading adoption. Growth will be fuelled by municipal modernization projects and increased industrial wastewater treatment investments. Automation and composite liner technology will define the decade ahead.
Growth is fuelled by stricter environmental standards, industrial water recycling programs, and infrastructure development for sludge management. Dewatering liners enable efficient solids separation, reducing disposal costs and improving water recovery rates.
Urban wastewater treatment expansion and mining wastewater management are core growth areas. Polypropylene and woven geotextiles remain preferred for high load-bearing capacity, chemical resistance, and reusability.
The market is segmented by material, design type, capacity, application, end-use industry, and region. Materials include PP, PE, PET, nylon, non-woven geotextiles, and composite meshes. Design types include woven, non-woven, perforated, and composite liners. Applications span sludge dewatering, wastewater treatment, mining, agriculture, and industrial effluent management.
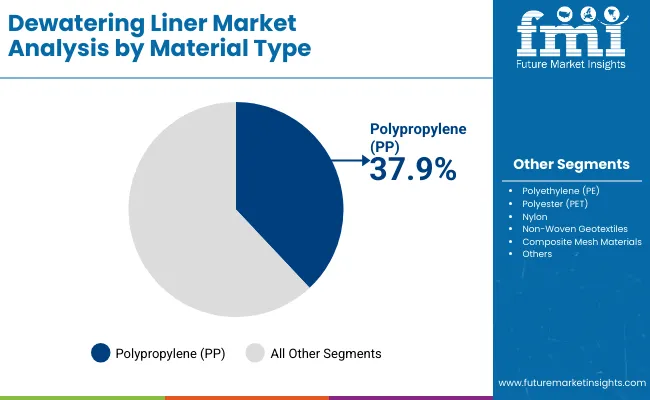
Polypropylene will hold 37.9% share in 2025, supported by superior tensile strength, cost efficiency, and compatibility with chemical waste. Its widespread use in mining and municipal sludge treatment drives market leadership.
Further advancements in UV-resistant and biodegradable PP fabrics will support future sustainability targets.
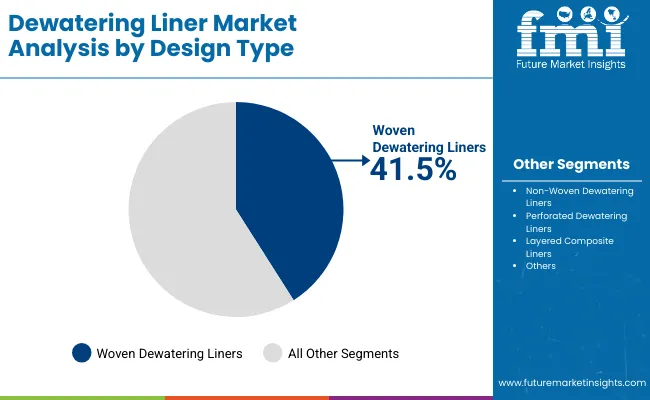
Woven liners will account for 41.5% share in 2025 due to high permeability and reusability. Their strength and drainage performance make them ideal for sediment and sludge handling.
By 2035, hybrid woven-composite liners integrating filtration meshes will further enhance efficiency.
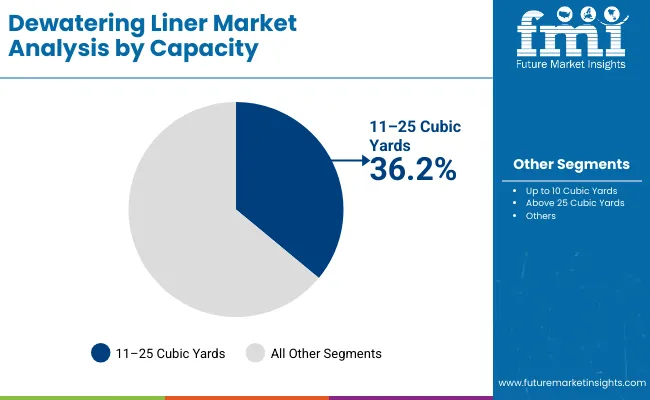
The 11-25 cubic yard capacity segment will represent 36.2% share in 2025, catering to mid-scale municipal and industrial uses. These liners optimize cost, volume, and transport logistics.
Future adoption will expand in compact sludge containment systems and modular dewatering units.
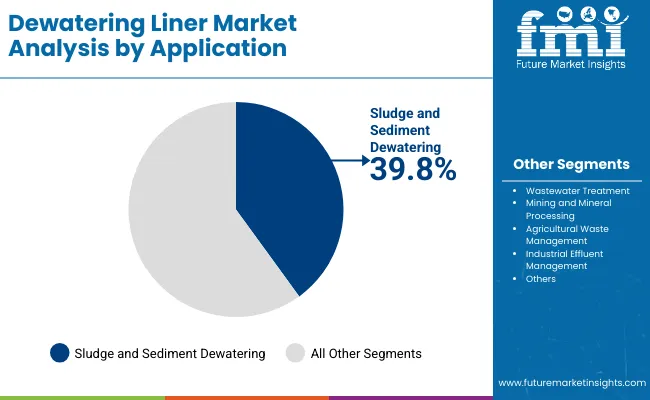
Sludge and sediment dewatering will capture 39.8% share in 2025, driven by wastewater treatment modernization and dredging projects.
By 2035, automation in sludge handling and use of liners with higher flow efficiency will accelerate growth.
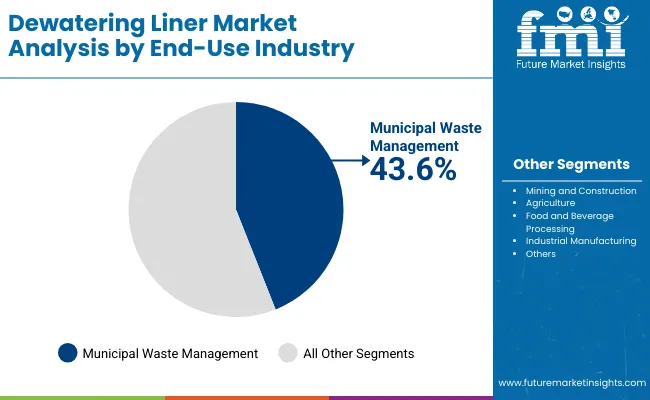
Municipal waste management will account for 43.6% share in 2025, supported by infrastructure upgrades in Asia-Pacific and North America.
By 2035, circular waste processing systems and smart monitoring will enhance liner lifecycle and sustainability.
Expansion of wastewater treatment facilities and stricter environmental norms drive liner adoption. Cost-efficient solid-liquid separation supports sustainable waste management.
High initial installation costs and limited liner reuse cycles restrict broader adoption, particularly in low-income regions.
Technological advancements in biodegradable liners and high-permeability fabrics open opportunities in circular waste management systems.
Trends include composite liners for faster drainage, IoT-based monitoring, and automation-integrated dewatering solutions. Sustainable PP blends and recycling initiatives are gaining traction.
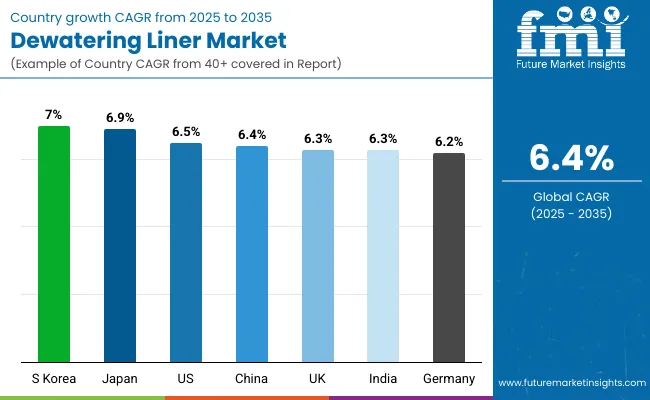
The global dewatering liner market is expanding steadily as wastewater recycling and sludge management become key priorities across industries. Asia-Pacific leads growth with large-scale municipal and industrial wastewater projects, while North America focuses on mining and environmental cleanup operations. Europe emphasizes circular waste management and the use of high-strength, sustainable geotextiles. Technological innovations, automation, and bio-based materials are driving the shift toward efficient, eco-friendly sludge dewatering and filtration solutions worldwide.
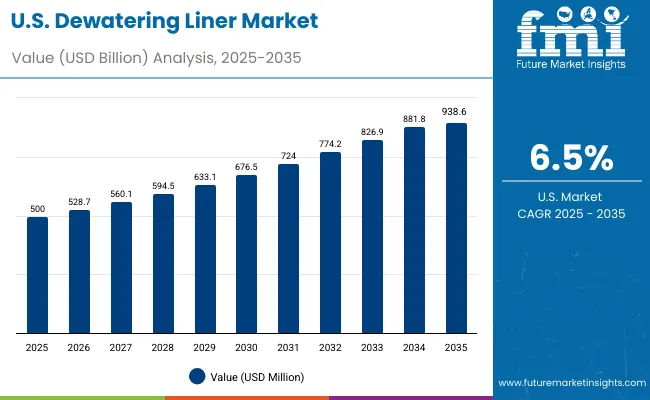
The USA market will grow at a CAGR of 6.5% from 2025 to 2035, driven by EPA-led wastewater treatment regulations. Municipal utilities are upgrading sludge handling systems to improve efficiency and reduce landfill dependence. Industrial effluent treatment applications are expanding across oil, chemical, and mining sectors. Geotextile liner innovations with higher permeability and tensile strength are being rapidly adopted for large-scale environmental and industrial projects.
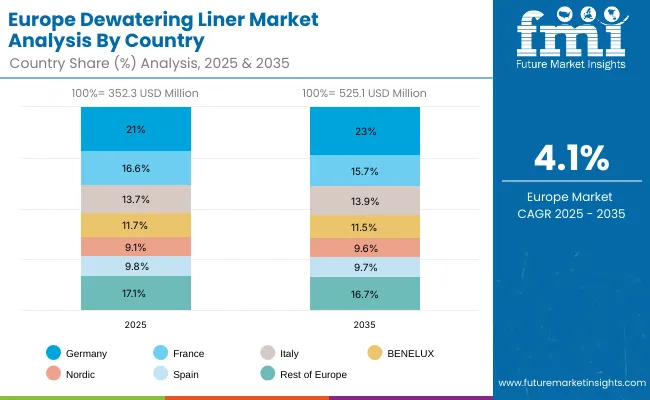
Germany will expand at a CAGR of 6.2%, supported by EU waste minimization policies and sustainable municipal projects. The country’s focus on environmental engineering is driving adoption of advanced geotextile liners in wastewater containment. High-performance filtration and reusable liner systems are gaining traction. Germany’s infrastructure modernization and emphasis on reducing waste-to-landfill ratios continue to position it as a leader in sustainable dewatering technologies.
The UK market will grow at a CAGR of 6.3%, driven by growing municipal contracts and infrastructure development in wastewater treatment. Compact and mobile dewatering systems are increasingly preferred by local councils and construction firms. Regulatory pressure to meet eco-compliance and landfill diversion targets is boosting adoption. The integration of smart monitoring and performance tracking is also enhancing operational efficiency across wastewater facilities.
China will grow at a CAGR of 6.4%, fueled by rapid industrialization and rising wastewater generation. Government investment in state-led sludge management projects is accelerating adoption of advanced liner systems. The mining and manufacturing sectors are key end users, utilizing liners for solid-liquid separation and waste reduction. Domestic manufacturers are scaling production of durable, cost-effective liners optimized for industrial and municipal applications.
India will grow at a CAGR of 6.3%, led by national initiatives such as Namami Gange and Smart City Mission projects. The expansion of wastewater recycling infrastructure and industrial parks is boosting adoption. Agricultural and small-scale industries are integrating dewatering liners for cost-effective sludge management. The focus on water reuse and cleaner industrial processes is driving consistent demand across diverse end-user segments.
Japan will grow at a CAGR of 6.9%, driven by automation and efficiency in wastewater management systems. High-tech dewatering facilities are adopting advanced polymer and geotextile liners to optimize sludge filtration. Recyclable liner solutions are gaining traction in line with Japan’s sustainability framework. Export opportunities are also growing, with Japanese firms supplying precision-engineered dewatering and filtration technologies across Asia-Pacific markets.
South Korea will lead with a CAGR of 7.0%, supported by national investments in advanced water treatment and sustainability. Urban wastewater and industrial projects are expanding rapidly, integrating smart monitoring technologies. The adoption of bio-based and recyclable liners aligns with the country’s green manufacturing policies. Innovation in multi-layer filtration systems is enhancing process efficiency and environmental compliance across wastewater treatment plants.
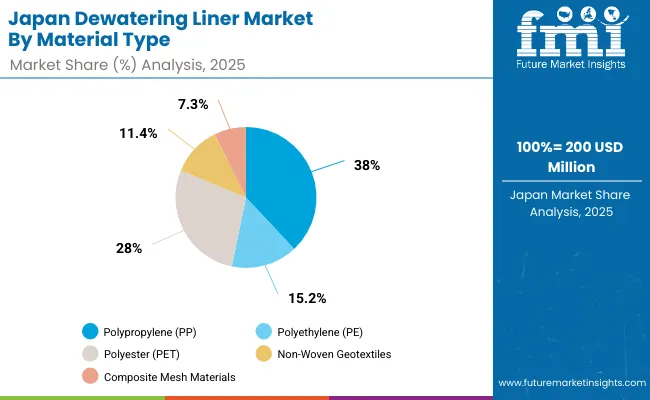
Japan’s dewatering liner market, valued at USD 200 million in 2025, is dominated by polypropylene (PP) with a 38.0% share due to its tensile strength and resistance to chemical degradation. Polyethylene (PE) holds 15.2%, offering lightweight flexibility for municipal wastewater treatment. Polyester (PET) and nylon collectively account for over 28%, favoured in high-pressure industrial applications. Non-woven geotextiles capture 11.4%, supporting efficient sludge filtration. Composite mesh materials, at 7.3%, serve niche filtration systems. Rising wastewater recycling initiatives, coupled with Japan’s stringent environmental norms, enhance adoption. The country’s focus on infrastructure rehabilitation and industrial waste management boosts demand for durable polymer-based liners.
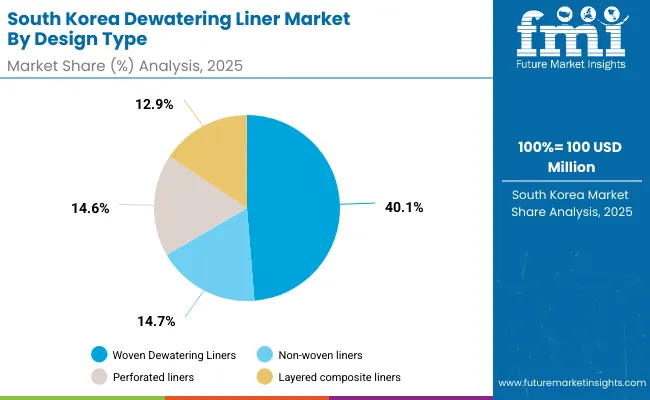
South Korea’s dewatering liner market, estimated at USD 100 million in 2025, is led by woven liners with a 40.1% share, driven by their structural rigidity and reusability in large sludge dewatering units. Non-woven liners hold 14.7%, catering to municipal and small-scale waste treatment. Perforated liners represent 14.6%, improving drainage rates and reducing cycle times. Layered composite liners at 12.9% offer balanced filtration and tensile strength, ideal for construction runoff applications. Rapid industrial expansion and environmental wastewater regulations accelerate product upgrades. South Korea’s technological adoption of filter-press compatible liners ensures operational efficiency, aligning with the nation’s sustainability-driven waste management goals.
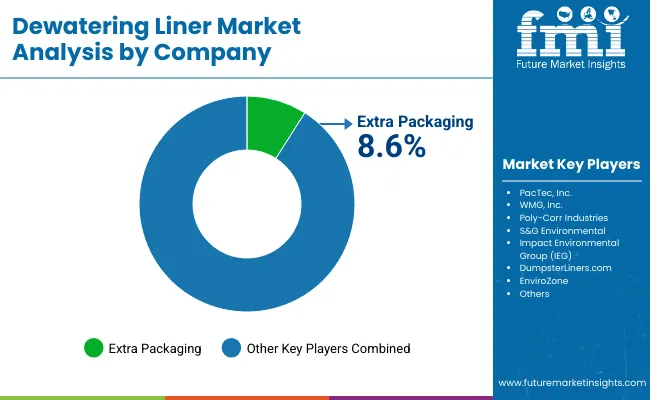
The market is moderately fragmented, featuring key players Extra Packaging, PacTec Inc., WMG Inc., Poly-Corr Industries, S&C Environmental, Impact Environmental Group (IEG), DumpsterLiners.com, and EnviroZone. These firms focus on enhancing liner strength, filtration efficiency, and environmental compliance.
PacTec and WMG lead in industrial applications, while Impact Environmental Group and EnviroZone emphasize custom wastewater containment. Innovation in layered and perforated designs defines competition through 2035.
Key Developments of Dewatering Liner Market
| Item | Value |
|---|---|
| Quantitative Units | USD 1.5 Billion |
| By Material | PP, PE, PET, Nylon, Non-Woven Geotextiles, Composite Mesh |
| By Design Type | Woven, Non-Woven, Perforated, Layered Composite |
| By Capacity | Up to 10, 11-25, Above 25 Cubic Yards |
| By Application | Sludge Dewatering, Wastewater, Mining, Agriculture, Effluent |
| By End-Use Industry | Municipal, Mining, Agriculture, Food & Beverage, Industrial |
| Key Companies Profiled | Extra Packaging, PacTec Inc., WMG Inc., Poly-Corr Industries, S&C Environmental, Impact Environmental Group (IEG), DumpsterLiners.com, EnviroZone |
| Additional Attributes | Growth driven by environmental compliance, sludge management innovation, and wastewater infrastructure expansion. |
The market will be valued at USD 1.5 billion in 2025.
The market will reach USD 2.8 billion by 2035.
The market will grow at a CAGR of 6.4% during 2025-2035.
Polypropylene will dominate with a 37.9% share in 2025.
Woven dewatering liners will lead with a 41.5% share in 2025.


Our Research Products

The "Full Research Suite" delivers actionable market intel, deep dives on markets or technologies, so clients act faster, cut risk, and unlock growth.

The Leaderboard benchmarks and ranks top vendors, classifying them as Established Leaders, Leading Challengers, or Disruptors & Challengers.

Locates where complements amplify value and substitutes erode it, forecasting net impact by horizon

We deliver granular, decision-grade intel: market sizing, 5-year forecasts, pricing, adoption, usage, revenue, and operational KPIs—plus competitor tracking, regulation, and value chains—across 60 countries broadly.

Spot the shifts before they hit your P&L. We track inflection points, adoption curves, pricing moves, and ecosystem plays to show where demand is heading, why it is changing, and what to do next across high-growth markets and disruptive tech

Real-time reads of user behavior. We track shifting priorities, perceptions of today’s and next-gen services, and provider experience, then pace how fast tech moves from trial to adoption, blending buyer, consumer, and channel inputs with social signals (#WhySwitch, #UX).

Partner with our analyst team to build a custom report designed around your business priorities. From analysing market trends to assessing competitors or crafting bespoke datasets, we tailor insights to your needs.
Supplier Intelligence
Discovery & Profiling
Capacity & Footprint
Performance & Risk
Compliance & Governance
Commercial Readiness
Who Supplies Whom
Scorecards & Shortlists
Playbooks & Docs
Category Intelligence
Definition & Scope
Demand & Use Cases
Cost Drivers
Market Structure
Supply Chain Map
Trade & Policy
Operating Norms
Deliverables
Buyer Intelligence
Account Basics
Spend & Scope
Procurement Model
Vendor Requirements
Terms & Policies
Entry Strategy
Pain Points & Triggers
Outputs
Pricing Analysis
Benchmarks
Trends
Should-Cost
Indexation
Landed Cost
Commercial Terms
Deliverables
Brand Analysis
Positioning & Value Prop
Share & Presence
Customer Evidence
Go-to-Market
Digital & Reputation
Compliance & Trust
KPIs & Gaps
Outputs
Full Research Suite comprises of:
Market outlook & trends analysis
Interviews & case studies
Strategic recommendations
Vendor profiles & capabilities analysis
5-year forecasts
8 regions and 60+ country-level data splits
Market segment data splits
12 months of continuous data updates
DELIVERED AS:
PDF EXCEL ONLINE
Linerless Label Market Size and Share Forecast Outlook 2025 to 2035
Dewatering Pump Market Size and Share Forecast Outlook 2025 to 2035
Dewatering Bin Market Size and Share Forecast Outlook 2025 to 2035
Dewatering Box Market Size and Share Forecast Outlook 2025 to 2035
Linerless Closures Market Size and Share Forecast Outlook 2025 to 2035
Market Share Breakdown of Dewatering Pump Manufacturers
Market Positioning & Share in Linerless Label Industry
Liner Bag Market Report – Key Trends & Forecast 2024-2034
Liner Hanger Market
Eyeliner and Kajal Sculpting Pencil Packaging Market Trends and Forecast 2025 to 2035
Evaluating Eyeliner and Kajal Sculpting Pencil Packaging Market Share & Provider Insights
Eyeliner Pen Market
Cap Liner Market Size and Share Forecast Outlook 2025 to 2035
Box Liners Market Size and Share Forecast Outlook 2025 to 2035
IBC Liner Market Size and Share Forecast Outlook 2025 to 2035
Pan Liner Market Insights – Demand, Growth & Industry Trends 2025-2035
EPE Liner Market Analysis – Size, Growth & Demand 2025 to 2035
Examining Market Share Trends in the Cap Liner Industry
Industry Share Analysis for Box Liners Companies
IBC Liner Market Share Insights & Industry Leaders

Thank you!
You will receive an email from our Business Development Manager. Please be sure to check your SPAM/JUNK folder too.
Chat With
MaRIA