Reports

- Global Locations -

Headquarters

Future Market Insights, Inc.

Christiana Corporate, 200
Continental Drive, Suite 401,
Newark, Delaware - 19713,
United States

T: +1-845-579-5705

Americas

Future Market Insights, Inc.

616 Corporate Way, Suite 2-9018,
Valley Cottage, NY 10989, United States

T: +1-347-918-3531

MEA

Future Market Insights

1602-6 Jumeirah Bay X2 Tower, Plot No: JLT-PH2-X2A,
Jumeirah Lakes Towers, Dubai,
United Arab Emirates

Europe

Future Market Insights

3rd Floor, 207 Regent Street,
W1B 3HH London
United Kingdom

T: + 44 (0) 20 8123 9659
D: +44 (0) 20 3287 4268

Asia Pacific

Future Market Insights

IndiaLand Global Tech Park, Unit UG-1, Behind Grand HighStreet, Phase 1, Hinjawadi, MH, Pune – 411057, India

Direct to Garment Printing Market Outlook for 2024 to 2034

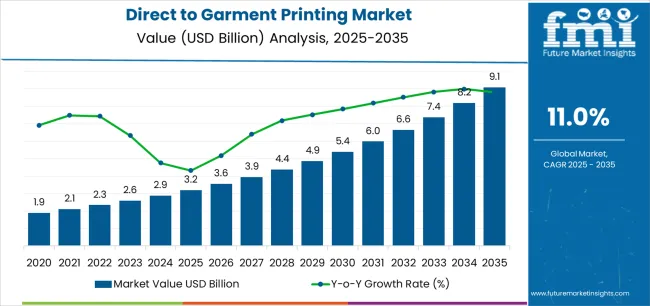
The direct to garment printing market is expected to be worth around US$ 861.2 million in 2024. The expansion of the market is linked to the quickly evolving fashion trends and the requirement for manufacturers to follow those trends to remain competitive. The direct to garment printing market is expected to rise at a 4.4% CAGR from 2024 to 2034, with a predicted market value of US$ 1.32 billion.

Attributes Details
Direct to Garment Printing Market Value for 2024 US$ 861.2 million
Projected Market Value for 2034 US$ 1.32 billion
CAGR for 2024 to 2034 4.4%

Don't pay for what you don't need

Customize your report by selecting specific countries or regions and save 30%!

Consumption Analysis of the Direct to Garment Printing Sector

  • The growing desire for distinctive, customized clothing with elaborate patterns and eye-catching colors is driving the growth of the direct to garment printing sector.
  • Innovation in printing technology, including improved print heads, ink formulations, and color management systems, enhances the quality and speed of direct to garment printing, drives demand for more efficient solutions, and provides novel product solutions for the market players.
  • The demand for direct garment printing solutions is rising due to consumers' growing awareness of environmental sustainability and preference for eco-friendly printing techniques, including digital processes and water-based inks.
  • The growth of e-commerce platforms and online marketplaces facilitate direct to garment printing in various industries outside of fashion, such as corporate apparel, personalized gifts, and promotional products.
  • The growing popularity of printed textiles in automotive interior decor and vehicle wrapping is expected to drive the direct to garment printing industry’s growth, encompassing soft signage, home decor, and various products like blankets, pillowcases, and furniture.

Historical Performance and Future Growth of the Direct to Garment Printing Market

The direct to garment printing industry has experienced a positive trend over the past five years, with a historical CAGR of 4.6%, and is projected to continue growing at a CAGR of 4.4% until 2034.

Historical CAGR (2019 to 2023) 4.6%

High initial investment costs and production constraints compared to traditional printing processes limit the demand for direct to garment printing; concerns about print quality and material compatibility further obstruct wider adoption in specific market sectors.

Crucial factors that are anticipated to impact the demand for direct to garment printing through 2034.

  • For smaller companies or startups, the substantial upfront expenditures connected with acquiring technology and equipment for direct to garment printing are expected to hinder market growth.
  • The usefulness of direct to garment printing for large-scale manufacturing or high-volume orders is affected by its slower production volume and speed than traditional printing processes' impending market expansion.
  • Demand for direct-to-garment printing is limited in some sectors when customers believe that alternative methods produce prints with better quality, especially when it comes to detailed designs or vivid colors.

Industry participants are going to desire to be wise and flexible over the anticipated period since these difficult attributes position the industry for success in subsequent decades.

Ismail Sutaria
Ismail Sutaria

Principal Consultant

Talk to Analyst

Find your sweet spots for generating winning opportunities in this market.

Key Trends Influencing the Direct to Garment Printing Market

Customization in Clothing Crafts the Demand for the Direct to Garment Printing

The growing demand for customized clothing and accessories has led to considerable growth in the direct to garment printing (DTG) industry. Technology has transformed the fashion industry by enabling consumers to make one-of-a-kind, custom clothing pieces, especially with 3D printing. DTG printing offers countless customization options by allowing the direct printing of detailed patterns, vivid colors, and high-resolution images into clothing.

DTG printing has made customization more accessible and affordable, drawing small companies, freelance designers, and individual customers. The environmentally friendly and ethically created fashion consumers are increasingly choosing is in line with the sustainability feature of DTG printing.

Technological progress, customer demand, and the environmental advantages of DTG printing have combined to make direct-to-garment printing a major force in the ever-evolving fashion industry.

Advancements in the Smart Direct to Garment Printing Technology Designs Demand from Fashion Industry

The integration of digital technology in the fashion supply chain, including virtual fashion shows, digital fittings, and online shopping experiences, is a shift in consumer behavior towards a more digitally-driven shopping experience.

This has led to a growing demand for unique and personalized fashion items as consumers increasingly engage with digital content, driving demand for the direct to garment printing.

Digital fittings, powered by augmented reality and virtual reality, allow consumers to try on clothing virtually, facilitating more informed purchasing decisions and reducing the need for physical store visits.

The rise of online shopping experiences has accelerated the demand for on-demand and customizable fashion solutions. By providing made-to-order and customized clothing and cutting waste and inventory expenses, DTG printing aids brands in satisfying consumer demand for distinctive and customized items.

Rise in Corporate Events Boosts the Demand for DTG Products

The rise in corporate events has boosted demand for direct to garment printing (DTG), allowing businesses to create personalized and branded apparel for their events. DTG printing is anticipated to enable companies to create high-quality, vibrant branded apparel that enhances brand visibility and recognition.

Customized apparel can instill a sense of belonging and pride among team members, promoting a cohesive corporate culture. It also allows businesses to engage with existing clients, prospects, and stakeholders, creating eye-catching and memorable promotional merchandise that drives brand engagement and recall. Customized apparel adds a professional touch to corporate events, enhancing brand image and perception.

DTG printing ensures consistent branding and quality across apparel, reinforcing a strong and reputable brand image. The demand for DTG printing is growing as businesses recognize its value in enhancing brand visibility, fostering team unity, driving marketing efforts, and projecting a professional brand image at events.

Comparative View of the Adjacent Direct to Garment Printing Market

The following section contrasts and compares the direct-to-garment printing market with the digital textile printing market and the custom t-shirt printing market. Focusing on each market's major trends, potential, and CAGR, the study covers the years from 2024 through 2034.

Direct to Garment Printing Market:

Attributes Direct to Garment Printing Market
CAGR (2024 to 2034) 4.4%
Opportunity Market players can integrate sustainable practices for the development of new product lines
Key Trends Rise in brand integration in corporate events

Custom T-shirt Printing Market:

Attributes Custom T-shirt Printing Market
CAGR (2023 to 2033) 9.7%
Opportunity Market players can develop customer base with the integration of the e-commerce websites
Key Trends Trend of personalized T-shirts with sensors

Digital Textile Printing Market:

Attributes Digital Textile Printing Market
CAGR (2024 to 2034) 12.1%
Opportunity Digital textile printing is expanding its market reach beyond fashion, gaining applications in home textiles, sportswear, signage, and interior decoration
Key Trends Technological advancement in garment printing

Get the data you need at a Fraction of the cost

Personalize your report by choosing insights you need
and save 40%!

Category-wise Insights

This section offers in-depth analyses of particular direct to garment (DTG) printing market. The research's two main topics are the cotton substrate segment and the clothing and apparel as an end-use segment. Through a comprehensive examination, this section attempts to provide a fuller knowledge of these segments and their relevance in the larger context of the DTG printing industry.

Cotton Material Captures 27.7% of the DTG Printing Market Share

Attributes Details
Top Substrate Cotton
Market share in 2024 27.7%

The demand for the cotton substrate is developing owing to its sustainability and affordability. Registering a market share of 27.7% in 2024, the following drives displays the growth of the demand for cotton for garment printing:

  • Cotton is a widely used textile material in the fashion and sportswear industry due to its exceptional moisture absorption properties and extended durability.
  • The high durability of cotton is attributed to its strong fiber structure, which can withstand frequent washings and wearings without losing its shape or strength, developing demand from multiple industries.
  • Cotton's excellent printability makes it an ideal choice for creating vibrant and intricate designs on garments, especially fashion wear, thus developing a high demand for DTG cotton materials.
  • Besides fashion and sportswear, cotton is also highly preferred for home décor items, such as bed sheets, curtains, cushion covers, and table covers. Cotton's softness, easy washability, and attractive appearance make it a top choice for home textiles.
  • Moreover, cotton is a breathable material that helps regulate body temperature, making it an excellent choice for bedding and other home textiles, fostering high demand for cotton in the garment printing market.

Clothing and Apparels Segment Provides Fertile Ground for Market Growth

Attributes Details
Top End Use Clothing and Apparels
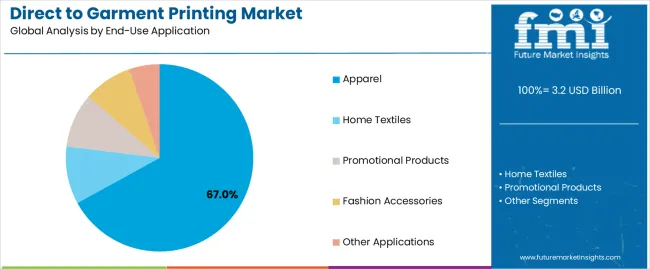
Market share in 2024 58.9%

Utilizing clothing and apparel is in high demand for direct-to-garment printing, acquiring almost 58.9% of the market share in 2024. The development of clothing and apparel in the DTG printing market is driven by the following aspects:

  • Customizing clothes and accessories with detailed patterns, vivid colors, and customized text on various materials is possible using direct-to-garment (DTG) printing.
  • With DTG printing, apparel businesses and merchants may produce garments on demand without placing big minimum orders, lowering their inventory expenses.
  • Customers who want distinctive and one-of-a-kind clothing alternatives are going to discover DTG printing intriguing since technology makes it possible to create personalized and bespoke garment products.
  • DTG printing provides faster turnaround times than traditional printing methods, enabling clothing brands to swiftly adapt to market trends and consumer demands for custom apparel production and delivery.
  • The fashion industry's growing environmental consciousness has fueled a surge in demand for eco-friendly printing methods like DTG, which utilize water-based inks and minimize waste.
  • DTG printing technology provides high precision and accuracy in reproducing intricate designs, allowing clothing designers to experiment with innovative and visually striking graphics on garments.

Country-wise Insights

The United States, China, Japan, India, and the United Kingdom are some of the most predominant nations on the global stage, and this section is anticipated to gaze at their direct to garment printing sectors. Examine the several aspects influencing these nations' need for, acceptance of, and interactions with DTG printing by a thorough investigation.

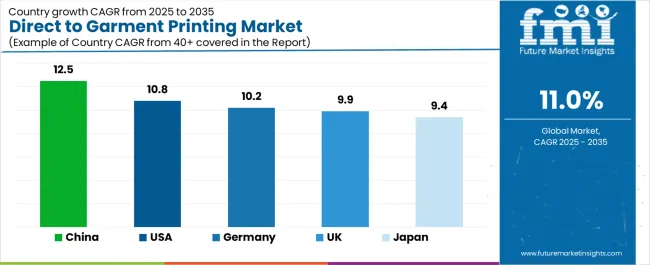
Countries CAGR from 2024 to 2034
United States 2.5%
United Kingdom 2.6%
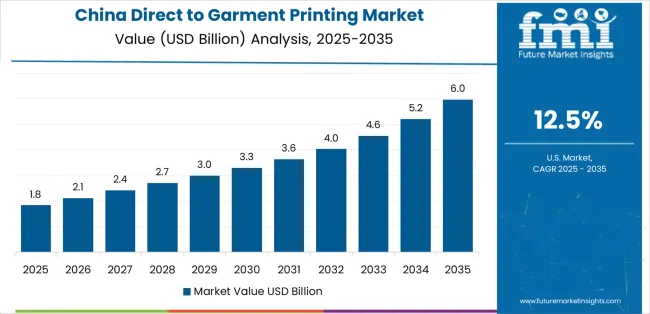
China 5.9%
Japan 2.6%
India 6.7%

United States Expands the Direct to Garment Printing Sector beyond Fashion Industry

The DTG printing market in the United States is expected to develop at a CAGR of 2.5% through 2034. A significant number of clothing brands and personalized clothing businesses in the United States are driving the industry. The following factors are propelling the industry's expansion:

  • Direct-to-garment (DTG) printing has penetrated the custom product market in the United States, offering branded merchandise, promotional items, and personalized gifts for companies and groups.
  • DTG printing is used in event marketing for custom-printed clothes and items for trade exhibitions, conferences, and corporate events to promote businesses and engage guests.
  • In the sports and athletics sector in the United States, DTG printing is used to create personalized designs and branding possibilities for team uniforms, fan gear, and athletic wear.
  • To create awareness and garner support, educational institutions and charitable organizations in the United States use DTG printing for fundraiser products and bespoke garments with personalized designs.

United Kingdom’s Home Décor Industry Propelling the Demand for DTG Printing

Due to rising environmental awareness and the industry's commitment to durability and reusability, the United Kingdom's home décor sector embraces customized decorations, particularly DTG printed products. The industry is developing with a CAGR of 2.6% from 2024 to 2034. Here are a few of the major trends:

  • The United Kingdom's home decor industry uses DTG printing to create personalized textiles like pillows, blankets, and towels, allowing consumers to personalize their living spaces with distinctive designs.
  • Custom wall art, including canvas prints, posters, and decals, is made possible by DTG printing, enabling customers to add artwork and photos to customize their walls.
  • In the United Kingdom, customers may use DTG printing to personalize upholstery, pillows, and other soft furnishings to fit their tastes and styles.
  • DTG printing enables customers to add personalized touches to their interior design by providing customization possibilities for home items such as carpets, table linens, and lampshades.
  • With DTG printing, customers in the United Kingdom may celebrate important life events and milestones by creating personalized home décor products for holidays, birthdays, and weddings.

China Cultivates Customized Cotton Items Catering Direct to Garment Printing

The manufacturing industry in China is adopting customized, fast fashion trends. The sector is predicted to grow at a CAGR of 5.9% through 2034. Some of the primary trends in the industry are:

  • China is a well-known center for producing bespoke cotton goods, such as clothing, fabrics, and accessories, and offers a wide range of direct to garment printing (DTG) choices.
  • China has significantly invested in cutting-edge DTG printing technology, allowing producers to create premium, personalized cotton products with exquisite patterns, vivid colors, and accurate artistry.
  • Customized cotton products fit for DTG printing may be produced affordably in China owing to its efficient production skills, enabling scalability and reasonable price.
  • Chinese producers meet different customer tastes and market niches by providing a wide range of cotton products for DTG printing, such as t-shirts, hoodies, tote bags, and more.

Vivid Pop Culture of Japan Shelters DTG Printing Revolution

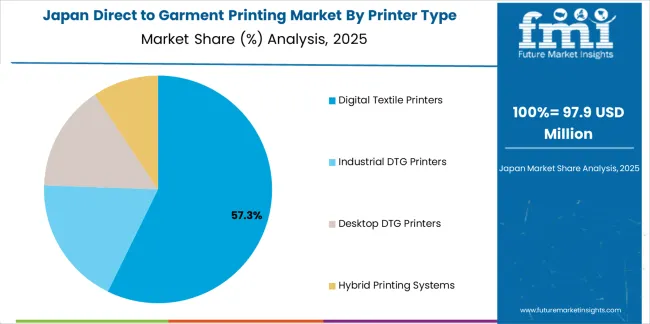
Japan's pop culture is boosting demand for direct to garment printing as consumers seek unique, artisanal products, where clothing brands highlight their latest apparels and experiment with innovative designs. The market is expected to register a CAGR of 2.6% through 2034. Among the primary drivers are:

  • Japan's pop culture, characterized by anime and manga, has sparked the DTG printing revolution, with fans seeking customized apparel featuring their favorite characters and quotes.
  • DTG printing adoption in Japan is driven by the demand for custom merchandise, such as anime-inspired t-shirts and accessories, which consumers appreciate for their unique and eye-catching graphics.
  • Japan's cosplay community, showcasing anime, manga, and video game characters, drives demand for custom costumes and accessories, utilizing DTG printing for detailed replicas.
  • DTG printing allows Japanese artists and designers to create custom apparel with original artwork, illustrations, and designs influenced by Japanese culture and aesthetics.
  • The collaboration between anime studios, manga publishers, and apparel brands enables the licensing and production of official merchandise through DTG printing, providing fans with authentic, high-quality products and developing high demand in Japan.

Indian Textile Screen Printing Factories Skyrockets the Demand for Direct to Garment Printing

The Indian textile industry is experiencing a surge due to rising demand for personalized and customized products, primarily crafted by direct to garment printing. The demand for direct to garment printing is expected to increase at a CAGR of approximately 6.7% from 2024 to 2034. Some of the primary trends are:

  • Indian textile screen printing factories are increasingly utilizing direct to garment (DTG) printing technology as an alternative to traditional screen printing due to its versatility and efficiency.
  • India's growing demand for personalized apparel is driven by consumer preferences for unique items, with DTG printing enabling textile factories to offer various customization options.
  • Compared to typical screen printing techniques, DTG printing lowers setup costs and turnaround times for small-batch manufacturing orders, increasing productivity in Indian textile companies.
  • DTG printing enables Indian textile factories to expand their product range beyond traditional screen-printed garments, offering a wider range of apparel items to cater to diverse market segments.
  • With the use of DTG printing technology, Indian textile companies are able to address the growing global demand for personalized clothes by producing high-quality, customized clothing for both home and international markets.

Market Players Shaping the Outlook of the Direct to Garment Printing Industry

Market players play a pivotal role in shaping the outlook of the direct to garment (DTG) printing industry through innovation, strategic partnerships, and market expansion initiatives. These players include manufacturers of DTG printing equipment, software developers, ink suppliers, and service providers. One key aspect of their influence lies in technological advancements.

Market leaders continually invest in research and development to enhance the performance, speed, and versatility of DTG printing machines. By introducing state-of-the-art features such as faster printing speeds, improved color accuracy, and compatibility with a wider range of fabrics, these companies drive the adoption of DTG printing across various sectors.

Market players are partnering with fashion brands, apparel manufacturers, and eCommerce platforms to integrate DTG printing into their supply chains, enabling them to meet consumer demand for personalized clothing items. They also engage in educational initiatives and training programs to empower designers, entrepreneurs, and printing professionals to utilize DTG printing effectively.

The fashion and printing industries are witnessing a shift towards sustainability, with market players focusing on eco-friendly solutions like water-based inks, energy-efficient printing processes, and recyclable materials, thereby meeting the growing demand for greener alternatives.

Through establishing distribution networks, service centers, and partnerships in emerging regions, market actors play a crucial role in increasing the global reach of DTG printing and improving access to DTG technology for businesses and entrepreneurs globally.

By pushing technical innovation, encouraging sustainability, extending market reach, and giving stakeholders the tools they need to succeed in a digital and personalized fashion, market participants have a substantial impact on the global DTG printing industry.

Recent Developments in the Direct to Garment Printing Industry

  • In February 2024, Brother is expected to showcase its innovative product portfolio at FESPA 2024, including the Latex Wide Format printer WF1-L640, which was chosen to produce original copies for Kunio Okawara's 50th-anniversary exhibition, demonstrating its role as a "one-stop solution provider" for the textile and printing industry.
  • In January 2024, Epson introduced the SureColor F-Series direct-to-garment (DTG) printer, a versatile entry-level device designed for various DTG and DTFilm printing applications. This hybrid printer offers excellent image quality, easy operation, and flexible performance.
  • In January 2024, Kornit Digital launched its Kornit Apollo direct-to-garment platform, offering high-throughput, automated digital production to brands, retailers, and screen printers, reducing lead times, total cost of ownership, and improving margins.
  • In June 2023, Stratasys showcased its 3DFashion direct-to-textile 3D printing technology at ITMA 2023, combining advanced materials with the J850 TechStyle 3D printer, allowing textile and apparel manufacturers to bond full-color, translucent, rigid, and flexible materials onto textiles.

Key Companies in the Direct to Garment Printing Market

  • Mimaki Engineering Co. Ltd.
  • ROQ International
  • Sawgrass Technologies Inc.
  • Seiko Epson Corporation
  • The M&R Companies
  • Durst Group
  • Aeoon Technologies GMBH
  • ColDesi Inc.
  • Scalable Press
  • Print Aura
  • Contract DTG
  • MKK Textile Co. Ltd.
  • HGS Machines Pvt. Ltd.
  • Brother Industries Ltd.
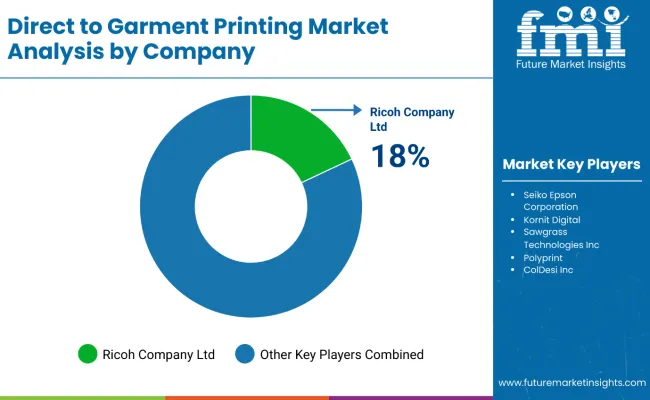
  • Ricoh Co. Ltd.

Key Coverage in the Direct to Garment Printing Market Report

  • Direct to Garment Printing Market Analysis for the United States
  • Growth Opportunity for the Direct-to-Shape Inkjet Printers Market in the United States
  • Top 10 Custom Printed Clothing Brands
  • Sales Assessment of Top-Coated Direct Thermal Printing Films
  • Price Analysis of the DTF and DTG Printing Processes
  • Development of Direct to Garment Printing innovations

Key Segments

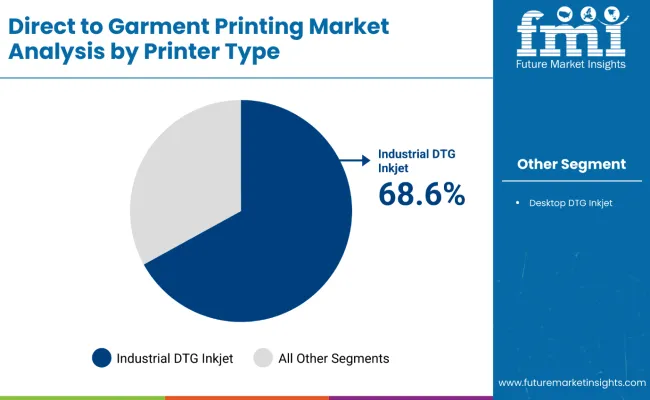
By Printer Type:

  • Industrial DTG Inkjet Printers
  • Desktop DTG Inkjet Printers

By Ink:

  • Reactive
  • Acid
  • Disperse
  • Pigment

By Substrate:

  • Cotton
  • Silk
  • Rayon
  • Linen
  • Polyester
  • Polyamide
  • Others (Wool, etc.)

By End Use:

  • Clothing & Apparels
    • T-shirts
    • Pants
    • Leggings
    • Caps
    • Sweatshirts
    • Hoodies
    • Shorts
    • Golf shirts
    • Others (Jackets, Tie, etc.)
  • Household
    • Bed Linens
    • Carpets & Curtains
    • Others
  • Technical Textiles
  • Others (Flag, Banners, etc.)

By Region:

  • North America
  • Latin America
  • Europe
  • East Asia
  • South Asia
  • Oceania
  • Middle East and Africa

Frequently Asked Questions

How Big is the DTG Printing Market?

The direct to garment printing market is valued at US$ 823.4 million in 2024.

What is the Expected Market Valuation by 2034?

By 2034, the global direct to garment printing market is expected to register at US$ 1.32 billion.

Which Industry Dominates the Market?

The clothing and apparel industry captures 58.9% of the direct to garment printing market share.

What is the Growth Potential of the Direct to Garment Printing Market?

The market is anticipated to expand at a CAGR of 4.4% from 2024 to 2034.

Which Type of Material Dominates the Direct to Garment Printing market?

The demand for cotton material dominates the market, with a market share of 27.7% in 2024.

Table of Content

1. Executive Summary

    1.1. Global Market Outlook

    1.2. Demand-side Trends

    1.3. Supply-side Trends

    1.4. Technology Roadmap Analysis

    1.5. Analysis and Recommendations

2. Market Overview

    2.1. Market Coverage / Taxonomy

    2.2. Market Definition / Scope / Limitations

3. Market Background

    3.1. Market Dynamics

        3.1.1. Drivers

        3.1.2. Restraints

        3.1.3. Opportunity

        3.1.4. Trends

    3.2. Scenario Forecast

        3.2.1. Demand in Optimistic Scenario

        3.2.2. Demand in Likely Scenario

        3.2.3. Demand in Conservative Scenario

    3.3. Opportunity Map Analysis

    3.4. Investment Feasibility Matrix

    3.5. PESTLE and Porter’s Analysis

    3.6. Regulatory Landscape

        3.6.1. By Key Regions

        3.6.2. By Key Countries

    3.7. Regional Parent Market Outlook

4. Global Market Analysis 2019 to 2023 and Forecast, 2024 to 2034

    4.1. Historical Market Size Value (US$ Million) Analysis, 2019 to 2023

    4.2. Current and Future Market Size Value (US$ Million) Projections, 2024 to 2034

        4.2.1. Y-o-Y Growth Trend Analysis

        4.2.2. Absolute $ Opportunity Analysis

5. Global Market Analysis 2019 to 2023 and Forecast 2024 to 2034, By Printer Type

    5.1. Introduction / Key Findings

    5.2. Historical Market Size Value (US$ Million) Analysis By Printer Type, 2019 to 2023

    5.3. Current and Future Market Size Value (US$ Million) Analysis and Forecast By Printer Type, 2024 to 2034

        5.3.1. Industrial DTG Inkjet Printers

        5.3.2. Desktop DTG Inkjet Printers

    5.4. Y-o-Y Growth Trend Analysis By Printer Type, 2019 to 2023

    5.5. Absolute $ Opportunity Analysis By Printer Type, 2024 to 2034

6. Global Market Analysis 2019 to 2023 and Forecast 2024 to 2034, By Ink

    6.1. Introduction / Key Findings

    6.2. Historical Market Size Value (US$ Million) Analysis By Ink, 2019 to 2023

    6.3. Current and Future Market Size Value (US$ Million) Analysis and Forecast By Ink, 2024 to 2034

        6.3.1. Reactive

        6.3.2. Acid

        6.3.3. Disperse

        6.3.4. Pigment

    6.4. Y-o-Y Growth Trend Analysis By Ink, 2019 to 2023

    6.5. Absolute $ Opportunity Analysis By Ink, 2024 to 2034

7. Global Market Analysis 2019 to 2023 and Forecast 2024 to 2034, By Substrate

    7.1. Introduction / Key Findings

    7.2. Historical Market Size Value (US$ Million) Analysis By Substrate, 2019 to 2023

    7.3. Current and Future Market Size Value (US$ Million) Analysis and Forecast By Substrate, 2024 to 2034

        7.3.1. Cotton

        7.3.2. Silk

        7.3.3. Rayon

        7.3.4. Linen

        7.3.5. Polyester

        7.3.6. Polyamide

    7.4. Y-o-Y Growth Trend Analysis By Substrate, 2019 to 2023

    7.5. Absolute $ Opportunity Analysis By Substrate, 2024 to 2034

8. Global Market Analysis 2019 to 2023 and Forecast 2024 to 2034, By End User

    8.1. Introduction / Key Findings

    8.2. Historical Market Size Value (US$ Million) Analysis By End User, 2019 to 2023

    8.3. Current and Future Market Size Value (US$ Million) Analysis and Forecast By End User, 2024 to 2034

        8.3.1. Clothing & Apparels

        8.3.2. Household

        8.3.3. Technical Textiles

    8.4. Y-o-Y Growth Trend Analysis By End User, 2019 to 2023

    8.5. Absolute $ Opportunity Analysis By End User, 2024 to 2034

9. Global Market Analysis 2019 to 2023 and Forecast 2024 to 2034, By Region

    9.1. Introduction

    9.2. Historical Market Size Value (US$ Million) Analysis By Region, 2019 to 2023

    9.3. Current Market Size Value (US$ Million) Analysis and Forecast By Region, 2024 to 2034

        9.3.1. North America

        9.3.2. Latin America

        9.3.3. Western Europe

        9.3.4. Eastern Europe

        9.3.5. South Asia and Pacific

        9.3.6. East Asia

        9.3.7. Middle East and Africa

    9.4. Market Attractiveness Analysis By Region

10. North America Market Analysis 2019 to 2023 and Forecast 2024 to 2034, By Country

    10.1. Historical Market Size Value (US$ Million) Trend Analysis By Market Taxonomy, 2019 to 2023

    10.2. Market Size Value (US$ Million) Forecast By Market Taxonomy, 2024 to 2034

        10.2.1. By Country

            10.2.1.1. USA

            10.2.1.2. Canada

        10.2.2. By Printer Type

        10.2.3. By Ink

        10.2.4. By Substrate

        10.2.5. By End User

    10.3. Market Attractiveness Analysis

        10.3.1. By Country

        10.3.2. By Printer Type

        10.3.3. By Ink

        10.3.4. By Substrate

        10.3.5. By End User

    10.4. Key Takeaways

11. Latin America Market Analysis 2019 to 2023 and Forecast 2024 to 2034, By Country

    11.1. Historical Market Size Value (US$ Million) Trend Analysis By Market Taxonomy, 2019 to 2023

    11.2. Market Size Value (US$ Million) Forecast By Market Taxonomy, 2024 to 2034

        11.2.1. By Country

            11.2.1.1. Brazil

            11.2.1.2. Mexico

            11.2.1.3. Rest of Latin America

        11.2.2. By Printer Type

        11.2.3. By Ink

        11.2.4. By Substrate

        11.2.5. By End User

    11.3. Market Attractiveness Analysis

        11.3.1. By Country

        11.3.2. By Printer Type

        11.3.3. By Ink

        11.3.4. By Substrate

        11.3.5. By End User

    11.4. Key Takeaways

12. Western Europe Market Analysis 2019 to 2023 and Forecast 2024 to 2034, By Country

    12.1. Historical Market Size Value (US$ Million) Trend Analysis By Market Taxonomy, 2019 to 2023

    12.2. Market Size Value (US$ Million) Forecast By Market Taxonomy, 2024 to 2034

        12.2.1. By Country

            12.2.1.1. Germany

            12.2.1.2. UK

            12.2.1.3. France

            12.2.1.4. Spain

            12.2.1.5. Italy

            12.2.1.6. Rest of Western Europe

        12.2.2. By Printer Type

        12.2.3. By Ink

        12.2.4. By Substrate

        12.2.5. By End User

    12.3. Market Attractiveness Analysis

        12.3.1. By Country

        12.3.2. By Printer Type

        12.3.3. By Ink

        12.3.4. By Substrate

        12.3.5. By End User

    12.4. Key Takeaways

13. Eastern Europe Market Analysis 2019 to 2023 and Forecast 2024 to 2034, By Country

    13.1. Historical Market Size Value (US$ Million) Trend Analysis By Market Taxonomy, 2019 to 2023

    13.2. Market Size Value (US$ Million) Forecast By Market Taxonomy, 2024 to 2034

        13.2.1. By Country

            13.2.1.1. Poland

            13.2.1.2. Russia

            13.2.1.3. Czech Republic

            13.2.1.4. Romania

            13.2.1.5. Rest of Eastern Europe

        13.2.2. By Printer Type

        13.2.3. By Ink

        13.2.4. By Substrate

        13.2.5. By End User

    13.3. Market Attractiveness Analysis

        13.3.1. By Country

        13.3.2. By Printer Type

        13.3.3. By Ink

        13.3.4. By Substrate

        13.3.5. By End User

    13.4. Key Takeaways

14. South Asia and Pacific Market Analysis 2019 to 2023 and Forecast 2024 to 2034, By Country

    14.1. Historical Market Size Value (US$ Million) Trend Analysis By Market Taxonomy, 2019 to 2023

    14.2. Market Size Value (US$ Million) Forecast By Market Taxonomy, 2024 to 2034

        14.2.1. By Country

            14.2.1.1. India

            14.2.1.2. Bangladesh

            14.2.1.3. Australia

            14.2.1.4. New Zealand

            14.2.1.5. Rest of South Asia and Pacific

        14.2.2. By Printer Type

        14.2.3. By Ink

        14.2.4. By Substrate

        14.2.5. By End User

    14.3. Market Attractiveness Analysis

        14.3.1. By Country

        14.3.2. By Printer Type

        14.3.3. By Ink

        14.3.4. By Substrate

        14.3.5. By End User

    14.4. Key Takeaways

15. East Asia Market Analysis 2019 to 2023 and Forecast 2024 to 2034, By Country

    15.1. Historical Market Size Value (US$ Million) Trend Analysis By Market Taxonomy, 2019 to 2023

    15.2. Market Size Value (US$ Million) Forecast By Market Taxonomy, 2024 to 2034

        15.2.1. By Country

            15.2.1.1. China

            15.2.1.2. Japan

            15.2.1.3. South Korea

        15.2.2. By Printer Type

        15.2.3. By Ink

        15.2.4. By Substrate

        15.2.5. By End User

    15.3. Market Attractiveness Analysis

        15.3.1. By Country

        15.3.2. By Printer Type

        15.3.3. By Ink

        15.3.4. By Substrate

        15.3.5. By End User

    15.4. Key Takeaways

16. Middle East and Africa Market Analysis 2019 to 2023 and Forecast 2024 to 2034, By Country

    16.1. Historical Market Size Value (US$ Million) Trend Analysis By Market Taxonomy, 2019 to 2023

    16.2. Market Size Value (US$ Million) Forecast By Market Taxonomy, 2024 to 2034

        16.2.1. By Country

            16.2.1.1. GCC Countries

            16.2.1.2. South Africa

            16.2.1.3. Israel

            16.2.1.4. Rest of MEA

        16.2.2. By Printer Type

        16.2.3. By Ink

        16.2.4. By Substrate

        16.2.5. By End User

    16.3. Market Attractiveness Analysis

        16.3.1. By Country

        16.3.2. By Printer Type

        16.3.3. By Ink

        16.3.4. By Substrate

        16.3.5. By End User

    16.4. Key Takeaways

17. Key Countries Market Analysis

    17.1. USA

        17.1.1. Market Share Analysis, 2023

            17.1.1.1. By Printer Type

            17.1.1.2. By Ink

            17.1.1.3. By Substrate

            17.1.1.4. By End User

    17.2. Canada

        17.2.1. Market Share Analysis, 2023

            17.2.1.1. By Printer Type

            17.2.1.2. By Ink

            17.2.1.3. By Substrate

            17.2.1.4. By End User

    17.3. Brazil

        17.3.1. Market Share Analysis, 2023

            17.3.1.1. By Printer Type

            17.3.1.2. By Ink

            17.3.1.3. By Substrate

            17.3.1.4. By End User

    17.4. Mexico

        17.4.1. Market Share Analysis, 2023

            17.4.1.1. By Printer Type

            17.4.1.2. By Ink

            17.4.1.3. By Substrate

            17.4.1.4. By End User

    17.5. Germany

        17.5.1. Market Share Analysis, 2023

            17.5.1.1. By Printer Type

            17.5.1.2. By Ink

            17.5.1.3. By Substrate

            17.5.1.4. By End User

    17.6. UK

        17.6.1. Market Share Analysis, 2023

            17.6.1.1. By Printer Type

            17.6.1.2. By Ink

            17.6.1.3. By Substrate

            17.6.1.4. By End User

    17.7. France

        17.7.1. Market Share Analysis, 2023

            17.7.1.1. By Printer Type

            17.7.1.2. By Ink

            17.7.1.3. By Substrate

            17.7.1.4. By End User

    17.8. Spain

        17.8.1. Market Share Analysis, 2023

            17.8.1.1. By Printer Type

            17.8.1.2. By Ink

            17.8.1.3. By Substrate

            17.8.1.4. By End User

    17.9. Italy

        17.9.1. Market Share Analysis, 2023

            17.9.1.1. By Printer Type

            17.9.1.2. By Ink

            17.9.1.3. By Substrate

            17.9.1.4. By End User

    17.10. Poland

        17.10.1. Market Share Analysis, 2023

            17.10.1.1. By Printer Type

            17.10.1.2. By Ink

            17.10.1.3. By Substrate

            17.10.1.4. By End User

    17.11. Russia

        17.11.1. Market Share Analysis, 2023

            17.11.1.1. By Printer Type

            17.11.1.2. By Ink

            17.11.1.3. By Substrate

            17.11.1.4. By End User

    17.12. Czech Republic

        17.12.1. Market Share Analysis, 2023

            17.12.1.1. By Printer Type

            17.12.1.2. By Ink

            17.12.1.3. By Substrate

            17.12.1.4. By End User

    17.13. Romania

        17.13.1. Market Share Analysis, 2023

            17.13.1.1. By Printer Type

            17.13.1.2. By Ink

            17.13.1.3. By Substrate

            17.13.1.4. By End User

    17.14. India

        17.14.1. Market Share Analysis, 2023

            17.14.1.1. By Printer Type

            17.14.1.2. By Ink

            17.14.1.3. By Substrate

            17.14.1.4. By End User

    17.15. Bangladesh

        17.15.1. Market Share Analysis, 2023

            17.15.1.1. By Printer Type

            17.15.1.2. By Ink

            17.15.1.3. By Substrate

            17.15.1.4. By End User

    17.16. Australia

        17.16.1. Market Share Analysis, 2023

            17.16.1.1. By Printer Type

            17.16.1.2. By Ink

            17.16.1.3. By Substrate

            17.16.1.4. By End User

    17.17. New Zealand

        17.17.1. Market Share Analysis, 2023

            17.17.1.1. By Printer Type

            17.17.1.2. By Ink

            17.17.1.3. By Substrate

            17.17.1.4. By End User

    17.18. China

        17.18.1. Market Share Analysis, 2023

            17.18.1.1. By Printer Type

            17.18.1.2. By Ink

            17.18.1.3. By Substrate

            17.18.1.4. By End User

    17.19. Japan

        17.19.1. Market Share Analysis, 2023

            17.19.1.1. By Printer Type

            17.19.1.2. By Ink

            17.19.1.3. By Substrate

            17.19.1.4. By End User

    17.20. South Korea

        17.20.1. Market Share Analysis, 2023

            17.20.1.1. By Printer Type

            17.20.1.2. By Ink

            17.20.1.3. By Substrate

            17.20.1.4. By End User

    17.21. GCC Countries

        17.21.1. Market Share Analysis, 2023

            17.21.1.1. By Printer Type

            17.21.1.2. By Ink

            17.21.1.3. By Substrate

            17.21.1.4. By End User

    17.22. South Africa

        17.22.1. Market Share Analysis, 2023

            17.22.1.1. By Printer Type

            17.22.1.2. By Ink

            17.22.1.3. By Substrate

            17.22.1.4. By End User

    17.23. Israel

        17.23.1. Market Share Analysis, 2023

            17.23.1.1. By Printer Type

            17.23.1.2. By Ink

            17.23.1.3. By Substrate

            17.23.1.4. By End User

18. Market Structure Analysis

    18.1. Competition Dashboard

    18.2. Competition Benchmarking

    18.3. Market Share Analysis of Top Players

        18.3.1. By Regional

        18.3.2. By Printer Type

        18.3.3. By Ink

        18.3.4. By Substrate

        18.3.5. By End User

19. Competition Analysis

    19.1. Competition Deep Dive

        19.1.1. Electronics For Imaging Inc

            19.1.1.1. Overview

            19.1.1.2. Product Portfolio

            19.1.1.3. Profitability by Market Segments

            19.1.1.4. Sales Footprint

            19.1.1.5. Strategy Overview

                19.1.1.5.1. Marketing Strategy

        19.1.2. Kornit Digital

            19.1.2.1. Overview

            19.1.2.2. Product Portfolio

            19.1.2.3. Profitability by Market Segments

            19.1.2.4. Sales Footprint

            19.1.2.5. Strategy Overview

                19.1.2.5.1. Marketing Strategy

        19.1.3. Bordeaux Digital PrintInk Ltd.

            19.1.3.1. Overview

            19.1.3.2. Product Portfolio

            19.1.3.3. Profitability by Market Segments

            19.1.3.4. Sales Footprint

            19.1.3.5. Strategy Overview

                19.1.3.5.1. Marketing Strategy

        19.1.4. SPGPrints Group

            19.1.4.1. Overview

            19.1.4.2. Product Portfolio

            19.1.4.3. Profitability by Market Segments

            19.1.4.4. Sales Footprint

            19.1.4.5. Strategy Overview

                19.1.4.5.1. Marketing Strategy

        19.1.5. Mimaki Engineering Co. Ltd

            19.1.5.1. Overview

            19.1.5.2. Product Portfolio

            19.1.5.3. Profitability by Market Segments

            19.1.5.4. Sales Footprint

            19.1.5.5. Strategy Overview

                19.1.5.5.1. Marketing Strategy

        19.1.6. ROQ International

            19.1.6.1. Overview

            19.1.6.2. Product Portfolio

            19.1.6.3. Profitability by Market Segments

            19.1.6.4. Sales Footprint

            19.1.6.5. Strategy Overview

                19.1.6.5.1. Marketing Strategy

        19.1.7. Sawgrass Technologies Inc

            19.1.7.1. Overview

            19.1.7.2. Product Portfolio

            19.1.7.3. Profitability by Market Segments

            19.1.7.4. Sales Footprint

            19.1.7.5. Strategy Overview

                19.1.7.5.1. Marketing Strategy

        19.1.8. Seiko Epson Corporation

            19.1.8.1. Overview

            19.1.8.2. Product Portfolio

            19.1.8.3. Profitability by Market Segments

            19.1.8.4. Sales Footprint

            19.1.8.5. Strategy Overview

                19.1.8.5.1. Marketing Strategy

        19.1.9. The M&R Companies

            19.1.9.1. Overview

            19.1.9.2. Product Portfolio

            19.1.9.3. Profitability by Market Segments

            19.1.9.4. Sales Footprint

            19.1.9.5. Strategy Overview

                19.1.9.5.1. Marketing Strategy

        19.1.10. Durst Group

            19.1.10.1. Overview

            19.1.10.2. Product Portfolio

            19.1.10.3. Profitability by Market Segments

            19.1.10.4. Sales Footprint

            19.1.10.5. Strategy Overview

                19.1.10.5.1. Marketing Strategy

20. Assumptions & Acronyms Used

21. Research Methodology

List of Tables

Table 1: Global Market Value (US$ Million) Forecast by Region, 2019 to 2034

Table 2: Global Market Value (US$ Million) Forecast by Printer Type, 2019 to 2034

Table 3: Global Market Value (US$ Million) Forecast by Ink, 2019 to 2034

Table 4: Global Market Value (US$ Million) Forecast by Substrate, 2019 to 2034

Table 5: Global Market Value (US$ Million) Forecast by End User, 2019 to 2034

Table 6: North America Market Value (US$ Million) Forecast by Country, 2019 to 2034

Table 7: North America Market Value (US$ Million) Forecast by Printer Type, 2019 to 2034

Table 8: North America Market Value (US$ Million) Forecast by Ink, 2019 to 2034

Table 9: North America Market Value (US$ Million) Forecast by Substrate, 2019 to 2034

Table 10: North America Market Value (US$ Million) Forecast by End User, 2019 to 2034

Table 11: Latin America Market Value (US$ Million) Forecast by Country, 2019 to 2034

Table 12: Latin America Market Value (US$ Million) Forecast by Printer Type, 2019 to 2034

Table 13: Latin America Market Value (US$ Million) Forecast by Ink, 2019 to 2034

Table 14: Latin America Market Value (US$ Million) Forecast by Substrate, 2019 to 2034

Table 15: Latin America Market Value (US$ Million) Forecast by End User, 2019 to 2034

Table 16: Western Europe Market Value (US$ Million) Forecast by Country, 2019 to 2034

Table 17: Western Europe Market Value (US$ Million) Forecast by Printer Type, 2019 to 2034

Table 18: Western Europe Market Value (US$ Million) Forecast by Ink, 2019 to 2034

Table 19: Western Europe Market Value (US$ Million) Forecast by Substrate, 2019 to 2034

Table 20: Western Europe Market Value (US$ Million) Forecast by End User, 2019 to 2034

Table 21: Eastern Europe Market Value (US$ Million) Forecast by Country, 2019 to 2034

Table 22: Eastern Europe Market Value (US$ Million) Forecast by Printer Type, 2019 to 2034

Table 23: Eastern Europe Market Value (US$ Million) Forecast by Ink, 2019 to 2034

Table 24: Eastern Europe Market Value (US$ Million) Forecast by Substrate, 2019 to 2034

Table 25: Eastern Europe Market Value (US$ Million) Forecast by End User, 2019 to 2034

Table 26: South Asia and Pacific Market Value (US$ Million) Forecast by Country, 2019 to 2034

Table 27: South Asia and Pacific Market Value (US$ Million) Forecast by Printer Type, 2019 to 2034

Table 28: South Asia and Pacific Market Value (US$ Million) Forecast by Ink, 2019 to 2034

Table 29: South Asia and Pacific Market Value (US$ Million) Forecast by Substrate, 2019 to 2034

Table 30: South Asia and Pacific Market Value (US$ Million) Forecast by End User, 2019 to 2034

Table 31: East Asia Market Value (US$ Million) Forecast by Country, 2019 to 2034

Table 32: East Asia Market Value (US$ Million) Forecast by Printer Type, 2019 to 2034

Table 33: East Asia Market Value (US$ Million) Forecast by Ink, 2019 to 2034

Table 34: East Asia Market Value (US$ Million) Forecast by Substrate, 2019 to 2034

Table 35: East Asia Market Value (US$ Million) Forecast by End User, 2019 to 2034

Table 36: Middle East and Africa Market Value (US$ Million) Forecast by Country, 2019 to 2034

Table 37: Middle East and Africa Market Value (US$ Million) Forecast by Printer Type, 2019 to 2034

Table 38: Middle East and Africa Market Value (US$ Million) Forecast by Ink, 2019 to 2034

Table 39: Middle East and Africa Market Value (US$ Million) Forecast by Substrate, 2019 to 2034

Table 40: Middle East and Africa Market Value (US$ Million) Forecast by End User, 2019 to 2034

List of Charts

Figure 1: Global Market Value (US$ Million) by Printer Type, 2024 to 2034

Figure 2: Global Market Value (US$ Million) by Ink, 2024 to 2034

Figure 3: Global Market Value (US$ Million) by Substrate, 2024 to 2034

Figure 4: Global Market Value (US$ Million) by End User, 2024 to 2034

Figure 5: Global Market Value (US$ Million) by Region, 2024 to 2034

Figure 6: Global Market Value (US$ Million) Analysis by Region, 2019 to 2034

Figure 7: Global Market Value Share (%) and BPS Analysis by Region, 2024 to 2034

Figure 8: Global Market Y-o-Y Growth (%) Projections by Region, 2024 to 2034

Figure 9: Global Market Value (US$ Million) Analysis by Printer Type, 2019 to 2034

Figure 10: Global Market Value Share (%) and BPS Analysis by Printer Type, 2024 to 2034

Figure 11: Global Market Y-o-Y Growth (%) Projections by Printer Type, 2024 to 2034

Figure 12: Global Market Value (US$ Million) Analysis by Ink, 2019 to 2034

Figure 13: Global Market Value Share (%) and BPS Analysis by Ink, 2024 to 2034

Figure 14: Global Market Y-o-Y Growth (%) Projections by Ink, 2024 to 2034

Figure 15: Global Market Value (US$ Million) Analysis by Substrate, 2019 to 2034

Figure 16: Global Market Value Share (%) and BPS Analysis by Substrate, 2024 to 2034

Figure 17: Global Market Y-o-Y Growth (%) Projections by Substrate, 2024 to 2034

Figure 18: Global Market Value (US$ Million) Analysis by End User, 2019 to 2034

Figure 19: Global Market Value Share (%) and BPS Analysis by End User, 2024 to 2034

Figure 20: Global Market Y-o-Y Growth (%) Projections by End User, 2024 to 2034

Figure 21: Global Market Attractiveness by Printer Type, 2024 to 2034

Figure 22: Global Market Attractiveness by Ink, 2024 to 2034

Figure 23: Global Market Attractiveness by Substrate, 2024 to 2034

Figure 24: Global Market Attractiveness by End User, 2024 to 2034

Figure 25: Global Market Attractiveness by Region, 2024 to 2034

Figure 26: North America Market Value (US$ Million) by Printer Type, 2024 to 2034

Figure 27: North America Market Value (US$ Million) by Ink, 2024 to 2034

Figure 28: North America Market Value (US$ Million) by Substrate, 2024 to 2034

Figure 29: North America Market Value (US$ Million) by End User, 2024 to 2034

Figure 30: North America Market Value (US$ Million) by Country, 2024 to 2034

Figure 31: North America Market Value (US$ Million) Analysis by Country, 2019 to 2034

Figure 32: North America Market Value Share (%) and BPS Analysis by Country, 2024 to 2034

Figure 33: North America Market Y-o-Y Growth (%) Projections by Country, 2024 to 2034

Figure 34: North America Market Value (US$ Million) Analysis by Printer Type, 2019 to 2034

Figure 35: North America Market Value Share (%) and BPS Analysis by Printer Type, 2024 to 2034

Figure 36: North America Market Y-o-Y Growth (%) Projections by Printer Type, 2024 to 2034

Figure 37: North America Market Value (US$ Million) Analysis by Ink, 2019 to 2034

Figure 38: North America Market Value Share (%) and BPS Analysis by Ink, 2024 to 2034

Figure 39: North America Market Y-o-Y Growth (%) Projections by Ink, 2024 to 2034

Figure 40: North America Market Value (US$ Million) Analysis by Substrate, 2019 to 2034

Figure 41: North America Market Value Share (%) and BPS Analysis by Substrate, 2024 to 2034

Figure 42: North America Market Y-o-Y Growth (%) Projections by Substrate, 2024 to 2034

Figure 43: North America Market Value (US$ Million) Analysis by End User, 2019 to 2034

Figure 44: North America Market Value Share (%) and BPS Analysis by End User, 2024 to 2034

Figure 45: North America Market Y-o-Y Growth (%) Projections by End User, 2024 to 2034

Figure 46: North America Market Attractiveness by Printer Type, 2024 to 2034

Figure 47: North America Market Attractiveness by Ink, 2024 to 2034

Figure 48: North America Market Attractiveness by Substrate, 2024 to 2034

Figure 49: North America Market Attractiveness by End User, 2024 to 2034

Figure 50: North America Market Attractiveness by Country, 2024 to 2034

Figure 51: Latin America Market Value (US$ Million) by Printer Type, 2024 to 2034

Figure 52: Latin America Market Value (US$ Million) by Ink, 2024 to 2034

Figure 53: Latin America Market Value (US$ Million) by Substrate, 2024 to 2034

Figure 54: Latin America Market Value (US$ Million) by End User, 2024 to 2034

Figure 55: Latin America Market Value (US$ Million) by Country, 2024 to 2034

Figure 56: Latin America Market Value (US$ Million) Analysis by Country, 2019 to 2034

Figure 57: Latin America Market Value Share (%) and BPS Analysis by Country, 2024 to 2034

Figure 58: Latin America Market Y-o-Y Growth (%) Projections by Country, 2024 to 2034

Figure 59: Latin America Market Value (US$ Million) Analysis by Printer Type, 2019 to 2034

Figure 60: Latin America Market Value Share (%) and BPS Analysis by Printer Type, 2024 to 2034

Figure 61: Latin America Market Y-o-Y Growth (%) Projections by Printer Type, 2024 to 2034

Figure 62: Latin America Market Value (US$ Million) Analysis by Ink, 2019 to 2034

Figure 63: Latin America Market Value Share (%) and BPS Analysis by Ink, 2024 to 2034

Figure 64: Latin America Market Y-o-Y Growth (%) Projections by Ink, 2024 to 2034

Figure 65: Latin America Market Value (US$ Million) Analysis by Substrate, 2019 to 2034

Figure 66: Latin America Market Value Share (%) and BPS Analysis by Substrate, 2024 to 2034

Figure 67: Latin America Market Y-o-Y Growth (%) Projections by Substrate, 2024 to 2034

Figure 68: Latin America Market Value (US$ Million) Analysis by End User, 2019 to 2034

Figure 69: Latin America Market Value Share (%) and BPS Analysis by End User, 2024 to 2034

Figure 70: Latin America Market Y-o-Y Growth (%) Projections by End User, 2024 to 2034

Figure 71: Latin America Market Attractiveness by Printer Type, 2024 to 2034

Figure 72: Latin America Market Attractiveness by Ink, 2024 to 2034

Figure 73: Latin America Market Attractiveness by Substrate, 2024 to 2034

Figure 74: Latin America Market Attractiveness by End User, 2024 to 2034

Figure 75: Latin America Market Attractiveness by Country, 2024 to 2034

Figure 76: Western Europe Market Value (US$ Million) by Printer Type, 2024 to 2034

Figure 77: Western Europe Market Value (US$ Million) by Ink, 2024 to 2034

Figure 78: Western Europe Market Value (US$ Million) by Substrate, 2024 to 2034

Figure 79: Western Europe Market Value (US$ Million) by End User, 2024 to 2034

Figure 80: Western Europe Market Value (US$ Million) by Country, 2024 to 2034

Figure 81: Western Europe Market Value (US$ Million) Analysis by Country, 2019 to 2034

Figure 82: Western Europe Market Value Share (%) and BPS Analysis by Country, 2024 to 2034

Figure 83: Western Europe Market Y-o-Y Growth (%) Projections by Country, 2024 to 2034

Figure 84: Western Europe Market Value (US$ Million) Analysis by Printer Type, 2019 to 2034

Figure 85: Western Europe Market Value Share (%) and BPS Analysis by Printer Type, 2024 to 2034

Figure 86: Western Europe Market Y-o-Y Growth (%) Projections by Printer Type, 2024 to 2034

Figure 87: Western Europe Market Value (US$ Million) Analysis by Ink, 2019 to 2034

Figure 88: Western Europe Market Value Share (%) and BPS Analysis by Ink, 2024 to 2034

Figure 89: Western Europe Market Y-o-Y Growth (%) Projections by Ink, 2024 to 2034

Figure 90: Western Europe Market Value (US$ Million) Analysis by Substrate, 2019 to 2034

Figure 91: Western Europe Market Value Share (%) and BPS Analysis by Substrate, 2024 to 2034

Figure 92: Western Europe Market Y-o-Y Growth (%) Projections by Substrate, 2024 to 2034

Figure 93: Western Europe Market Value (US$ Million) Analysis by End User, 2019 to 2034

Figure 94: Western Europe Market Value Share (%) and BPS Analysis by End User, 2024 to 2034

Figure 95: Western Europe Market Y-o-Y Growth (%) Projections by End User, 2024 to 2034

Figure 96: Western Europe Market Attractiveness by Printer Type, 2024 to 2034

Figure 97: Western Europe Market Attractiveness by Ink, 2024 to 2034

Figure 98: Western Europe Market Attractiveness by Substrate, 2024 to 2034

Figure 99: Western Europe Market Attractiveness by End User, 2024 to 2034

Figure 100: Western Europe Market Attractiveness by Country, 2024 to 2034

Figure 101: Eastern Europe Market Value (US$ Million) by Printer Type, 2024 to 2034

Figure 102: Eastern Europe Market Value (US$ Million) by Ink, 2024 to 2034

Figure 103: Eastern Europe Market Value (US$ Million) by Substrate, 2024 to 2034

Figure 104: Eastern Europe Market Value (US$ Million) by End User, 2024 to 2034

Figure 105: Eastern Europe Market Value (US$ Million) by Country, 2024 to 2034

Figure 106: Eastern Europe Market Value (US$ Million) Analysis by Country, 2019 to 2034

Figure 107: Eastern Europe Market Value Share (%) and BPS Analysis by Country, 2024 to 2034

Figure 108: Eastern Europe Market Y-o-Y Growth (%) Projections by Country, 2024 to 2034

Figure 109: Eastern Europe Market Value (US$ Million) Analysis by Printer Type, 2019 to 2034

Figure 110: Eastern Europe Market Value Share (%) and BPS Analysis by Printer Type, 2024 to 2034

Figure 111: Eastern Europe Market Y-o-Y Growth (%) Projections by Printer Type, 2024 to 2034

Figure 112: Eastern Europe Market Value (US$ Million) Analysis by Ink, 2019 to 2034

Figure 113: Eastern Europe Market Value Share (%) and BPS Analysis by Ink, 2024 to 2034

Figure 114: Eastern Europe Market Y-o-Y Growth (%) Projections by Ink, 2024 to 2034

Figure 115: Eastern Europe Market Value (US$ Million) Analysis by Substrate, 2019 to 2034

Figure 116: Eastern Europe Market Value Share (%) and BPS Analysis by Substrate, 2024 to 2034

Figure 117: Eastern Europe Market Y-o-Y Growth (%) Projections by Substrate, 2024 to 2034

Figure 118: Eastern Europe Market Value (US$ Million) Analysis by End User, 2019 to 2034

Figure 119: Eastern Europe Market Value Share (%) and BPS Analysis by End User, 2024 to 2034

Figure 120: Eastern Europe Market Y-o-Y Growth (%) Projections by End User, 2024 to 2034

Figure 121: Eastern Europe Market Attractiveness by Printer Type, 2024 to 2034

Figure 122: Eastern Europe Market Attractiveness by Ink, 2024 to 2034

Figure 123: Eastern Europe Market Attractiveness by Substrate, 2024 to 2034

Figure 124: Eastern Europe Market Attractiveness by End User, 2024 to 2034

Figure 125: Eastern Europe Market Attractiveness by Country, 2024 to 2034

Figure 126: South Asia and Pacific Market Value (US$ Million) by Printer Type, 2024 to 2034

Figure 127: South Asia and Pacific Market Value (US$ Million) by Ink, 2024 to 2034

Figure 128: South Asia and Pacific Market Value (US$ Million) by Substrate, 2024 to 2034

Figure 129: South Asia and Pacific Market Value (US$ Million) by End User, 2024 to 2034

Figure 130: South Asia and Pacific Market Value (US$ Million) by Country, 2024 to 2034

Figure 131: South Asia and Pacific Market Value (US$ Million) Analysis by Country, 2019 to 2034

Figure 132: South Asia and Pacific Market Value Share (%) and BPS Analysis by Country, 2024 to 2034

Figure 133: South Asia and Pacific Market Y-o-Y Growth (%) Projections by Country, 2024 to 2034

Figure 134: South Asia and Pacific Market Value (US$ Million) Analysis by Printer Type, 2019 to 2034

Figure 135: South Asia and Pacific Market Value Share (%) and BPS Analysis by Printer Type, 2024 to 2034

Figure 136: South Asia and Pacific Market Y-o-Y Growth (%) Projections by Printer Type, 2024 to 2034

Figure 137: South Asia and Pacific Market Value (US$ Million) Analysis by Ink, 2019 to 2034

Figure 138: South Asia and Pacific Market Value Share (%) and BPS Analysis by Ink, 2024 to 2034

Figure 139: South Asia and Pacific Market Y-o-Y Growth (%) Projections by Ink, 2024 to 2034

Figure 140: South Asia and Pacific Market Value (US$ Million) Analysis by Substrate, 2019 to 2034

Figure 141: South Asia and Pacific Market Value Share (%) and BPS Analysis by Substrate, 2024 to 2034

Figure 142: South Asia and Pacific Market Y-o-Y Growth (%) Projections by Substrate, 2024 to 2034

Figure 143: South Asia and Pacific Market Value (US$ Million) Analysis by End User, 2019 to 2034

Figure 144: South Asia and Pacific Market Value Share (%) and BPS Analysis by End User, 2024 to 2034

Figure 145: South Asia and Pacific Market Y-o-Y Growth (%) Projections by End User, 2024 to 2034

Figure 146: South Asia and Pacific Market Attractiveness by Printer Type, 2024 to 2034

Figure 147: South Asia and Pacific Market Attractiveness by Ink, 2024 to 2034

Figure 148: South Asia and Pacific Market Attractiveness by Substrate, 2024 to 2034

Figure 149: South Asia and Pacific Market Attractiveness by End User, 2024 to 2034

Figure 150: South Asia and Pacific Market Attractiveness by Country, 2024 to 2034

Figure 151: East Asia Market Value (US$ Million) by Printer Type, 2024 to 2034

Figure 152: East Asia Market Value (US$ Million) by Ink, 2024 to 2034

Figure 153: East Asia Market Value (US$ Million) by Substrate, 2024 to 2034

Figure 154: East Asia Market Value (US$ Million) by End User, 2024 to 2034

Figure 155: East Asia Market Value (US$ Million) by Country, 2024 to 2034

Figure 156: East Asia Market Value (US$ Million) Analysis by Country, 2019 to 2034

Figure 157: East Asia Market Value Share (%) and BPS Analysis by Country, 2024 to 2034

Figure 158: East Asia Market Y-o-Y Growth (%) Projections by Country, 2024 to 2034

Figure 159: East Asia Market Value (US$ Million) Analysis by Printer Type, 2019 to 2034

Figure 160: East Asia Market Value Share (%) and BPS Analysis by Printer Type, 2024 to 2034

Figure 161: East Asia Market Y-o-Y Growth (%) Projections by Printer Type, 2024 to 2034

Figure 162: East Asia Market Value (US$ Million) Analysis by Ink, 2019 to 2034

Figure 163: East Asia Market Value Share (%) and BPS Analysis by Ink, 2024 to 2034

Figure 164: East Asia Market Y-o-Y Growth (%) Projections by Ink, 2024 to 2034

Figure 165: East Asia Market Value (US$ Million) Analysis by Substrate, 2019 to 2034

Figure 166: East Asia Market Value Share (%) and BPS Analysis by Substrate, 2024 to 2034

Figure 167: East Asia Market Y-o-Y Growth (%) Projections by Substrate, 2024 to 2034

Figure 168: East Asia Market Value (US$ Million) Analysis by End User, 2019 to 2034

Figure 169: East Asia Market Value Share (%) and BPS Analysis by End User, 2024 to 2034

Figure 170: East Asia Market Y-o-Y Growth (%) Projections by End User, 2024 to 2034

Figure 171: East Asia Market Attractiveness by Printer Type, 2024 to 2034

Figure 172: East Asia Market Attractiveness by Ink, 2024 to 2034

Figure 173: East Asia Market Attractiveness by Substrate, 2024 to 2034

Figure 174: East Asia Market Attractiveness by End User, 2024 to 2034

Figure 175: East Asia Market Attractiveness by Country, 2024 to 2034

Figure 176: Middle East and Africa Market Value (US$ Million) by Printer Type, 2024 to 2034

Figure 177: Middle East and Africa Market Value (US$ Million) by Ink, 2024 to 2034

Figure 178: Middle East and Africa Market Value (US$ Million) by Substrate, 2024 to 2034

Figure 179: Middle East and Africa Market Value (US$ Million) by End User, 2024 to 2034

Figure 180: Middle East and Africa Market Value (US$ Million) by Country, 2024 to 2034

Figure 181: Middle East and Africa Market Value (US$ Million) Analysis by Country, 2019 to 2034

Figure 182: Middle East and Africa Market Value Share (%) and BPS Analysis by Country, 2024 to 2034

Figure 183: Middle East and Africa Market Y-o-Y Growth (%) Projections by Country, 2024 to 2034

Figure 184: Middle East and Africa Market Value (US$ Million) Analysis by Printer Type, 2019 to 2034

Figure 185: Middle East and Africa Market Value Share (%) and BPS Analysis by Printer Type, 2024 to 2034

Figure 186: Middle East and Africa Market Y-o-Y Growth (%) Projections by Printer Type, 2024 to 2034

Figure 187: Middle East and Africa Market Value (US$ Million) Analysis by Ink, 2019 to 2034

Figure 188: Middle East and Africa Market Value Share (%) and BPS Analysis by Ink, 2024 to 2034

Figure 189: Middle East and Africa Market Y-o-Y Growth (%) Projections by Ink, 2024 to 2034

Figure 190: Middle East and Africa Market Value (US$ Million) Analysis by Substrate, 2019 to 2034

Figure 191: Middle East and Africa Market Value Share (%) and BPS Analysis by Substrate, 2024 to 2034

Figure 192: Middle East and Africa Market Y-o-Y Growth (%) Projections by Substrate, 2024 to 2034

Figure 193: Middle East and Africa Market Value (US$ Million) Analysis by End User, 2019 to 2034

Figure 194: Middle East and Africa Market Value Share (%) and BPS Analysis by End User, 2024 to 2034

Figure 195: Middle East and Africa Market Y-o-Y Growth (%) Projections by End User, 2024 to 2034

Figure 196: Middle East and Africa Market Attractiveness by Printer Type, 2024 to 2034

Figure 197: Middle East and Africa Market Attractiveness by Ink, 2024 to 2034

Figure 198: Middle East and Africa Market Attractiveness by Substrate, 2024 to 2034

Figure 199: Middle East and Africa Market Attractiveness by End User, 2024 to 2034

Figure 200: Middle East and Africa Market Attractiveness by Country, 2024 to 2034

Recommendations

Packaging

Direct-to-shape Inkjet Printer Market

Published : February 2024

Packaging

Inkjet Printers Market

Published : June 2023

Explore Packaging Insights

View Reports

Direct to Garment Printing Market