The direct methanol fuel cell (DMFC) market is witnessing accelerating growth driven by increasing demand for efficient, lightweight, and portable power generation solutions. DMFC systems offer high energy density and quick refueling capabilities, making them ideal for off-grid and backup power applications.
Rising adoption in consumer electronics, defense, and transportation sectors has strengthened market penetration. Environmental concerns and the need for low-emission alternatives to conventional batteries have further boosted interest in methanol-based systems.
Technological improvements in catalysts, membranes, and fuel reforming efficiency are enhancing performance and reducing production costs. With ongoing R&D investments and government initiatives promoting clean energy technologies, the DMFC market is positioned for significant expansion across portable and stationary energy sectors.
.webp)
| Metric | Value |
|---|---|
| Direct Methanol Fuel Cell Market Estimated Value in (2025 E) | USD 3.9 billion |
| Direct Methanol Fuel Cell Market Forecast Value in (2035 F) | USD 9.0 billion |
| Forecast CAGR (2025 to 2035) | 8.8% |
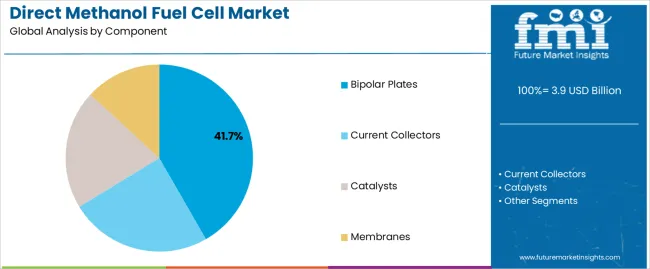
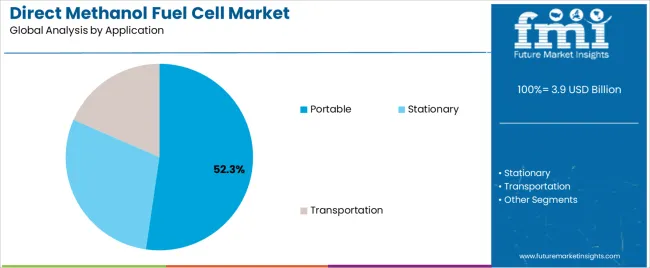
The market is segmented by Component and Application and region. By Component, the market is divided into Bipolar Plates, Current Collectors, Catalysts, and Membranes. In terms of Application, the market is classified into Portable, Stationary, and Transportation. Regionally, the market is classified into North America, Latin America, Western Europe, Eastern Europe, Balkan & Baltic Countries, Russia & Belarus, Central Asia, East Asia, South Asia & Pacific, and the Middle East & Africa.

The bipolar plates segment leads the component category with approximately 41.7% share, driven by their essential role in ensuring uniform fuel distribution, electrical conductivity, and structural integrity within fuel cells. Advanced materials such as graphite composites and coated metals are increasingly being used to improve corrosion resistance and reduce weight.
Manufacturing innovations have lowered production costs and increased durability, enabling wider adoption. The segment’s dominance is also attributed to its scalability across both portable and stationary DMFC systems.
As demand for compact and high-performance fuel cells grows, bipolar plates are expected to remain a core component supporting overall efficiency and system longevity.

The portable segment dominates the application category with approximately 52.3% share, reflecting the growing utilization of DMFC technology in mobile and off-grid devices. Its advantages include rapid refueling, long operational runtime, and superior energy density compared to traditional batteries.
The segment benefits from increasing demand in military, consumer electronics, and remote monitoring applications, where reliability and autonomy are critical. The rising popularity of environmentally sustainable power sources in outdoor and field-based operations has further driven adoption.
As miniaturization and cost optimization continue, the portable segment is expected to maintain its leadership, establishing DMFC systems as a preferred solution for next-generation portable energy applications.
Rising Focus on Renewable Energy Boosts Expansions in the Market
Sustainability is more than just a catchphrase in today's corporate environment, it's a strategic need. The direct methanol fuel cell (DMFC) industry is expected to expand as businesses aim to satisfy customers' desires for eco-friendly products and environmental restrictions.
In line with government measures to reduce carbon emissions and company sustainability goals, DMFCs provide a clean energy alternative. Businesses can establish themselves as industry leaders in environmental responsibility by investing in direct methanol fuel cell technology. This gives them a competitive edge and helps to create a more sustainable future.
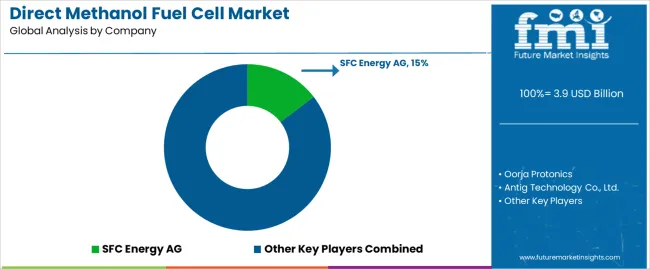
Considering the rapid growth of the Indian renewable energy sector, in July 2025, SFC Energy AG, a leading provider of hydrogen and methanol fuel cells for stationary and mobile hybrid power systems, began the production of hydrogen and methanol fuel cells at its New Delhi/Gurgaon plant in India in the presence of Federal Minister Dr. Robert Habeck.
Trend Toward Hybrid Energy System Integration Surges in the Market
Businesses are trying to maximize power generation by combining traditional grids with renewable sources, and this is changing the energy landscape with the shift toward hybrid energy systems integration. Direct methanol fuel cells, or DMFCs, are becoming crucial parts of modern hybrid systems because of their adaptability and ability to support other renewable energy sources.
Businesses specializing in DMFC integration into hybrid systems can benefit from the synergy between different energy sources, offering dependable and all-encompassing energy solutions. In addition to meeting the growing need for sustainable energy, this strategic approach establishes companies as industry leaders in optimizing various energy portfolios.
Emergence of Urban Air Mobility Solutions Unlocks New Opportunities in the Market
Modern power solutions are becoming increasingly necessary as urban air mobility (UAM) options, electric vertical takeoff, and landing, or eVTOL, proliferate. With their energy density, quick refilling times, and small size, direct methanol fuel cells (DMFCs) are starting to appear as a smart choice for UAM power needs.
Enterprises venturing into this domain deliberately coordinate with the revolutionary developments in transportation, portraying DMFC technology as a facilitator of sustainable and effective urban aviation. This calculated approach places companies as leaders at the nexus of renewable energy and aerial mobility while capitalizing on the expanding UAM industry.
| Trends |
|
|---|---|
| Opportunities |
|
| Challenges |
|
| Segment | Bipolar Plates (Component) |
|---|---|
| Value CAGR (2025 to 2035) | 13.6% |
Based on components, the bipolar plates segment is anticipated to expand at a 13.6% CAGR through 2035.
| Segment | Portable (Application) |
|---|---|
| Value CAGR (2025 to 2035) | 13.4% |
Based on application, the portable segment is projected to thrive at a 13.4% CAGR through 2035.
| Countries | Value CAGR (2025 to 2035) |
|---|---|
| United States | 14.2% |
| United Kingdom | 15.4% |
| China | 14.6% |
| Japan | 15.1% |
| South Korea | 16.0% |
The demand for direct methanol fuel cells in the United States is projected to rise at a 14.2% CAGR through 2035.
The sales of direct methanol fuel cells in the United Kingdom are anticipated to surge at a 15.4% CAGR through 2035.
The direct methanol fuel cell market growth in China is estimated at a 14.6% CAGR through 2035.
The demand for direct methanol fuel cells in Japan is predicted to increase at a 15.1% CAGR through 2035.
The sales of direct methanol fuel cells in South Korea are anticipated to rise at a 16.0% CAGR through 2035.

In the direct methanol fuel cell market, existing businesses, up-and-coming startups, and strategic alliances interact dynamically to create a competitive landscape. Principal players in the market include SFC Energy AG, Ballard Power Systems Inc., and Samsung SDI Co., Ltd.
These well-established companies have a global footprint and provide a wide range of products. To keep a competitive edge and promote innovation in DMFC technology, these top companies frequently participate in strategic partnerships with governmental organizations and academic institutions.
Recent Developments
The global direct methanol fuel cell market is estimated to be valued at USD 3.9 billion in 2025.
The market size for the direct methanol fuel cell market is projected to reach USD 9.0 billion by 2035.
The direct methanol fuel cell market is expected to grow at a 8.8% CAGR between 2025 and 2035.
The key product types in direct methanol fuel cell market are bipolar plates, current collectors, catalysts and membranes.
In terms of application, portable segment to command 52.3% share in the direct methanol fuel cell market in 2025.


Our Research Products

The "Full Research Suite" delivers actionable market intel, deep dives on markets or technologies, so clients act faster, cut risk, and unlock growth.

The Leaderboard benchmarks and ranks top vendors, classifying them as Established Leaders, Leading Challengers, or Disruptors & Challengers.

Locates where complements amplify value and substitutes erode it, forecasting net impact by horizon

We deliver granular, decision-grade intel: market sizing, 5-year forecasts, pricing, adoption, usage, revenue, and operational KPIs—plus competitor tracking, regulation, and value chains—across 60 countries broadly.

Spot the shifts before they hit your P&L. We track inflection points, adoption curves, pricing moves, and ecosystem plays to show where demand is heading, why it is changing, and what to do next across high-growth markets and disruptive tech

Real-time reads of user behavior. We track shifting priorities, perceptions of today’s and next-gen services, and provider experience, then pace how fast tech moves from trial to adoption, blending buyer, consumer, and channel inputs with social signals (#WhySwitch, #UX).

Partner with our analyst team to build a custom report designed around your business priorities. From analysing market trends to assessing competitors or crafting bespoke datasets, we tailor insights to your needs.
Supplier Intelligence
Discovery & Profiling
Capacity & Footprint
Performance & Risk
Compliance & Governance
Commercial Readiness
Who Supplies Whom
Scorecards & Shortlists
Playbooks & Docs
Category Intelligence
Definition & Scope
Demand & Use Cases
Cost Drivers
Market Structure
Supply Chain Map
Trade & Policy
Operating Norms
Deliverables
Buyer Intelligence
Account Basics
Spend & Scope
Procurement Model
Vendor Requirements
Terms & Policies
Entry Strategy
Pain Points & Triggers
Outputs
Pricing Analysis
Benchmarks
Trends
Should-Cost
Indexation
Landed Cost
Commercial Terms
Deliverables
Brand Analysis
Positioning & Value Prop
Share & Presence
Customer Evidence
Go-to-Market
Digital & Reputation
Compliance & Trust
KPIs & Gaps
Outputs
Full Research Suite comprises of:
Market outlook & trends analysis
Interviews & case studies
Strategic recommendations
Vendor profiles & capabilities analysis
5-year forecasts
8 regions and 60+ country-level data splits
Market segment data splits
12 months of continuous data updates
DELIVERED AS:
PDF EXCEL ONLINE
Fuel Cell Powertrain Market Size and Share Forecast Outlook 2025 to 2035
Fuel Cell UAV Market Size and Share Forecast Outlook 2025 to 2035
Fuel Cell Stack Market Size and Share Forecast Outlook 2025 to 2035
Fuel Cell Electric Vehicle Market Size and Share Forecast Outlook 2025 to 2035
Fuel Cell Commercial Vehicle Market Size and Share Forecast Outlook 2025 to 2035
Fuel Cell Market Growth – Trends & Forecast 2025 to 2035
Fuel Cell for Data Center Market - Trends & Forecast 2025 to 2035
Fuel Cell for Stationary Power Market Growth - Trends & Forecast 2025 to 2035
PEM Fuel Cell Market Size and Share Forecast Outlook 2025 to 2035
Hydrogen Fuel Cell Vehicle Market Size and Share Forecast Outlook 2025 to 2035
Portable Fuel Cells Market
Transport Fuel Cell Market Size and Share Forecast Outlook 2025 to 2035
Solid Oxide Fuel Cell Market
Bipolar Plate Market Growth – Trends & Forecast 2024-2034
Perfluorosulfonic Acid Fuel Cell Proton Membrane Market Size and Share Forecast Outlook 2025 to 2035
Large Capacity Stationary Fuel Cell Market Size and Share Forecast Outlook 2025 to 2035
Direct Liquid Cooling IGBT Module Market Size and Share Forecast Outlook 2025 to 2035
Cellulose Diacetate Film Market Size and Share Forecast Outlook 2025 to 2035
Direct Fast Dyes Market Size and Share Forecast Outlook 2025 to 2035
Fuel rail for CNG Systems Market Size and Share Forecast Outlook 2025 to 2035

Thank you!
You will receive an email from our Business Development Manager. Please be sure to check your SPAM/JUNK folder too.
Chat With
MaRIA