

- Market Size (2026)
- USD 2460.7 Mn
- Forecast (2036)
- USD 4795.5 Mn
- CAGR (2026 to 2036)
- 6.9%
How big is the Dissolved Air Flotation Unit Market in 2026?
USD 2,460.7 million in 2026 and USD 4,795.5 million by 2036 at a 6.9% CAGR.
Dissolved Air Flotation Unit Market demand is tied to uptime pressure and the cost of delayed maintenance. Buyer groups such as plant engineers, project owners and maintenance teams are paying closer attention to downtime and equipment reliability. System integrators remain part of the same procurement check. Safety and lifecycle cost also affect supplier qualification. Poor product fit can still create waste, delay or approval risk. The purchase case for the market is stronger when the product reduces avoidable service work or outage risk. Infrastructure and safety references help frame demand, but buyer approval still depends on operating evidence and service coverage. The senior-buyer test in the market is whether the product reduces downtime risk without raising service burden. Procurement teams need proof that effluent compliance and solids-removal uptime survives local operating conditions.
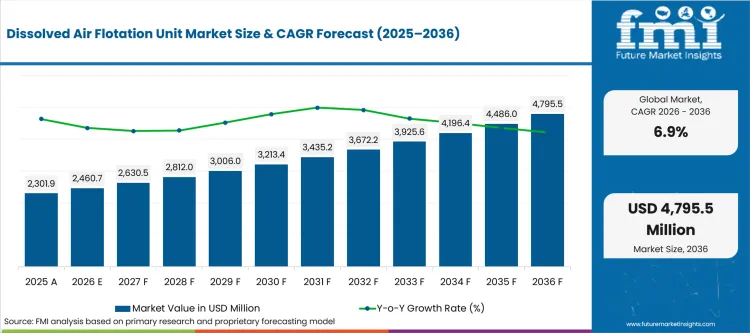
| Metric | Value |
|---|---|
| 2025 Market Size | USD 2,301.9 million |
| 2026 Market Size | USD 2,460.7 million |
| 2036 Market Size | USD 4,795.5 million |
| Forecast CAGR (2026-2036) | 6.9% |
| Leading Sales Channel | Direct OEM |
| Direct OEM Share (2026) | 60.9% |
| Leading Flow Capacity | <100 m³/hr |
| <100 m³/hr Share (2026) | 46.0% |
| Leading Application | Industrial Wastewater |
| Industrial Wastewater Share (2026) | 40.9% |
Summary of the Dissolved Air Flotation Unit Market
| Market Signal | Commercial Impact |
|---|---|
| Demand and Growth Drivers | Demand for dissolved air flotation (DAF) units is increasing as industrial facilities prioritize wastewater compliance, equipment reliability, and lifecycle cost optimization while minimizing operational downtime.
|
| Product and Segment View | Direct OEM sales, lower-capacity systems, and industrial wastewater applications continue to represent the leading commercial opportunities across the dissolved air flotation unit market.
|
| Geography and Growth Outlook | North America and Asia continue to drive market expansion through increasing industrial wastewater treatment investment and stricter environmental compliance requirements.
|
| Competitive Landscape | Competition increasingly focuses on equipment reliability, application expertise, documentation quality, and responsive technical service.
|
| Analyst Perspective | Dissolved air flotation systems are evolving from standalone wastewater treatment equipment into performance-driven process solutions that improve operational efficiency, regulatory compliance, and long-term plant reliability.
|
How is the Dissolved Air Flotation Unit Market segmented?
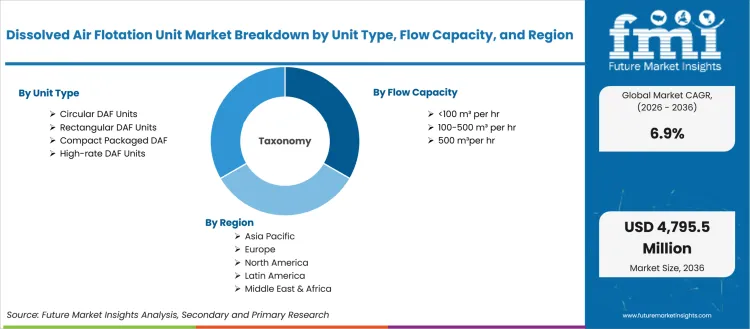
The Dissolved Air Flotation Unit Market industry is segmented by Unit Type, By Flow Capacity and By Application; End Use and By Sales Channel complete the forecast structure.
In Dissolved Air Flotation Unit Market, segmentation starts with By Unit Type, By Flow Capacity and By Application. By End Use and By Sales Channel then show where use case, channel role, and geography change the buying case. Shares stay in the segment questions, so this view stays focused on how the market is organized.
How does Direct OEM influence Dissolved Air Flotation Unit Market buying within By Sales Channel?
Direct OEM should be read through buying route and support control in Dissolved Air Flotation Unit Market. The channel matters when it can protect effluent compliance and solids-removal uptime after purchase.
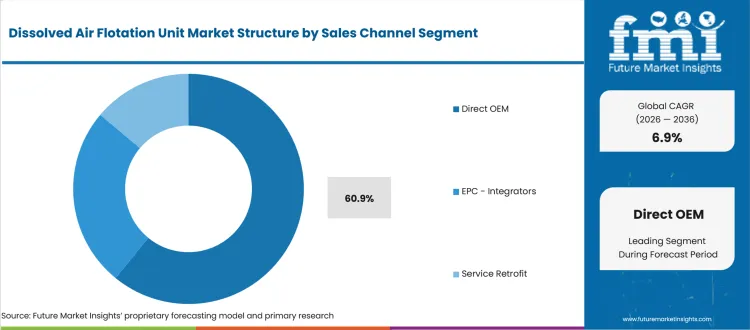
- Direct OEM represents 60.9% of By Sales Channel in 2026, equal to USD 1,498.6 million. The segment rises from USD 1,401.9 million in 2025 to USD 2,920.4 million by 2036. The number matters when the buying route can support service response.
- The executive question is service control in Dissolved Air Flotation Unit Market. Buyers need a route that supports effluent compliance and solids-removal uptime without slowing adoption.
Where does <100 m³/hr create value in the By Flow Capacity category?
<100 m³/hr matters within By Flow Capacity when technical performance matches the specification buyers must defend. The segment is useful only when suppliers can keep that fit stable.
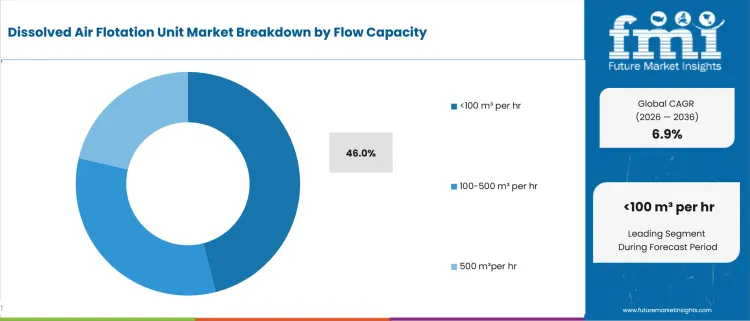
- At USD 1,131.9 million in 2026, <100 m³/hr holds 46% of By Flow Capacity. The value moves from USD 1,058.9 million in 2025 to USD 2,205.9 million by 2036. The number matters when technical performance matches buyer specification.
- Management teams should test whether the segment changes Dissolved Air Flotation Unit Market risk or cost. Share alone is weak guidance unless it connects to effluent compliance and solids-removal uptime.
What keeps Industrial Wastewater relevant within By Application?
Industrial Wastewater should be read through application fit. Buyers compare the segment with the problem it solves in daily operations, with the support needed after approval.
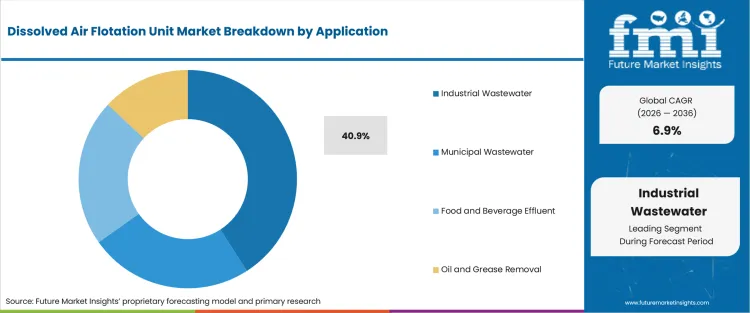
- Industrial Wastewater contributes USD 1,006.4 million in 2026, or 40.9% of By Application, after a 2025 base of USD 941.5 million. By 2036, the segment is projected at USD 1,961.4 million. Commercial value depends on whether the application supports a repeatable use case.
- Procurement should ask what changes for the Dissolved Air Flotation Unit Market user after adoption. Supplier advantage is clearer when effluent compliance and solids-removal uptime reduces a specific burden.
How should buyers read Circular DAF Units demand within By Unit Type?
Circular DAF Units matters within By Unit Type when product performance matches the specification buyers must defend. The segment is useful only when the supplier can keep that fit stable.
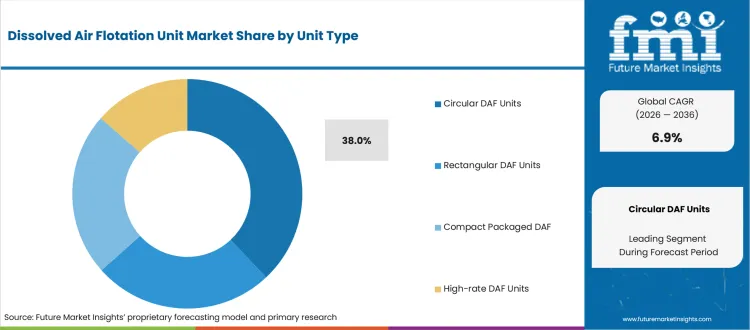
- Circular DAF Units accounts for 38% of By Unit Type in 2026. Its value increases from USD 874.7 million in 2025 to USD 935.1 million in 2026. By 2036, the value is projected at USD 1,822.3 million. The number matters when product performance matches buyer specification.
- The executive question is specification control in Dissolved Air Flotation Unit Market. Buyers need confidence that effluent compliance and solids-removal uptime stays stable across repeat orders.
Why is Food and Beverage still important in By End Use?
Food and Beverage matters within By End Use because the buyer group decides how the product must perform in use. Procurement depends on operating risk and service support after approval.
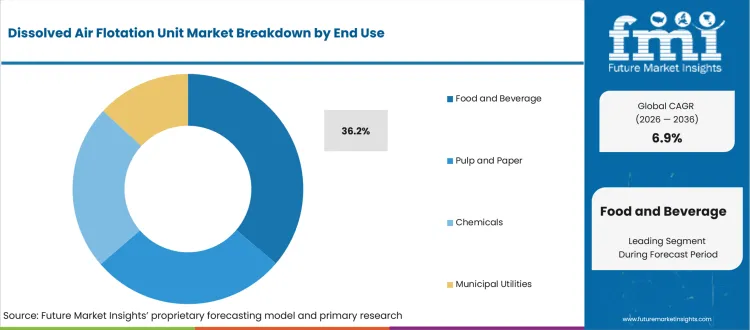
- Food and Beverage stands at USD 890.8 million in 2026, equal to 36.2% of By End Use. It moves from USD 833.3 million in 2025 to USD 1,736.0 million by 2036. The number matters when the buyer group has a clear operating reason to shift spend.
- Management teams should test whether the segment changes Dissolved Air Flotation Unit Market risk or cost. Share alone is weak guidance unless it connects to effluent compliance and solids-removal uptime.
What factors shape the Dissolved Air Flotation Unit Market?
Dissolved Air Flotation Unit Market purchases are being shaped by uptime risk, compliance pressure, lifecycle cost; and integration burden.
- Driver: effluent compliance and solids-removal uptime. Demand strengthens when buyers can connect the purchase to a measurable operating, formulation, compliance; or cost outcome in Dissolved Air Flotation Unit Market.
- Restraint: proof burden and implementation risk. Adoption slows when Dissolved Air Flotation Unit Market buyers cannot validate effluent compliance and solids-removal uptime under their own operating conditions.
- Opportunity: supplier programs built around effluent compliance and solids-removal uptime. The better opening is with vendors that make approval easier through field support, clear proof, and repeatable execution.
Dissolved Air Flotation Unit Market demand is strongest where the product reduces an operating risk that buyers can measure. Engineering and procurement teams need proof that the system improves uptime, compliance, inspection; data accuracy; or service cost before it becomes a standard purchase.
Supplier pressure is strongest where Dissolved Air Flotation Unit Market buyers need proof before changing an approved route. Evidence quality and service response decide whether the first order becomes recurring spend.
Adoption can still slow when Dissolved Air Flotation Unit Market buyers do not know who owns rollout support. Vendors that define responsibility early have a cleaner path to repeat orders.
Which country CAGRs are profiled in the Dissolved Air Flotation Unit Market?
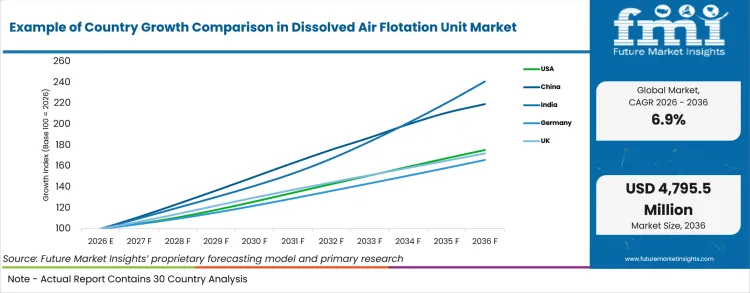
| Country | CAGR |
|---|---|
| United States | 5.78% |
| China | 8.18% |
| India | 9.18% |
| Germany | 5.18% |
| United Kingdom | 5.58% |
| Japan | 4.98% |
| South Korea | 6.38% |
| Rest of World | 7.58% |
How do country-level CAGRs compare in the Dissolved Air Flotation Unit Market?
Dissolved Air Flotation Unit Market country growth differs by infrastructure maturity, regulatory pressure, installed-base age; and service capability. Mature markets place more weight on specification control and lifecycle cost. Faster-growth markets still need local partners and reliable implementation support.
- United States rises from USD 552.4 million in 2025 to USD 590.6 million in 2026. By 2036, it is projected at USD 1,035.8 million at a 5.78% CAGR. United States buyers treat Dissolved Air Flotation Unit Market as a effluent compliance and solids-removal uptime decision. Approval usually needs measurable operating proof before volume moves from existing suppliers.
- For Dissolved Air Flotation Unit Market, China moves from USD 460.4 million in 2025 to USD 492.1 million in 2026. The 2036 value is USD 1,080.4 million, supported by an 8.18% CAGR. China's buying condition is scale plus execution discipline in Dissolved Air Flotation Unit Market. Suppliers need availability, channel control, and proof that effluent compliance and solids-removal uptime can hold across fast-ramping accounts.
- For Dissolved Air Flotation Unit Market, India is estimated at USD 184.1 million in 2025 and USD 196.9 million in 2026. It is projected at USD 473.9 million by 2036, with a 9.18% CAGR. India demand is tied to formal procurement and wider production activity in Dissolved Air Flotation Unit Market. Cost remains a hard filter, so suppliers need a price case that still supports effluent compliance and solids-removal uptime.
- Germany stands at USD 207.2 million in 2025 and USD 221.5 million in 2026. By 2036, the value is projected at USD 366.9 million at a 5.18% CAGR. Germany is qualification-led for Dissolved Air Flotation Unit Market. Technical review focuses on whether effluent compliance and solids-removal uptime can be proven before commercial negotiation.
- United Kingdom rises from USD 115.1 million in 2025 to USD 123.0 million in 2026. By 2036, it is projected at USD 211.7 million at a 5.58% CAGR. United Kingdom buyers in Dissolved Air Flotation Unit Market place more weight on vendor accountability and delivery reliability. Switching costs rise when effluent compliance and solids-removal uptime is not supported after purchase.
- Japan moves from USD 184.1 million in 2025 to USD 196.9 million in 2026. The 2036 value is USD 320.0 million, supported by an 4.98% CAGR. Japan's approval cycle for Dissolved Air Flotation Unit Market favors suppliers that reduce inspection work and keep effluent compliance and solids-removal uptime consistent across repeat orders.
- South Korea is estimated at USD 92.07 million in 2025 and USD 98.43 million in 2026. It is projected at USD 182.7 million by 2036, with a 6.38% CAGR. South Korea's compact supply chains make Dissolved Air Flotation Unit Market feedback fast. Suppliers need responsive support because weak execution on effluent compliance and solids-removal uptime can affect production schedules.
- Rest of World stands at USD 506.4 million in 2025 and USD 541.4 million in 2026. By 2036, the value is projected at USD 1,124.1 million at a 7.58% CAGR. Rest of World demand for Dissolved Air Flotation Unit Market is uneven. Local service access and import reliability matter where buyers need help proving effluent compliance and solids-removal uptime without mature support networks.
Who are the notable companies in the Dissolved Air Flotation Unit Market?
Xylem; Veolia Water Technologies; WesTech Engineering; DAF Corporation; Toro Equipment; KWI Group; FRC Systems; Nijhuis Saur Industries; Ecologix and Hydroflux are the notable companies assessed in this market.
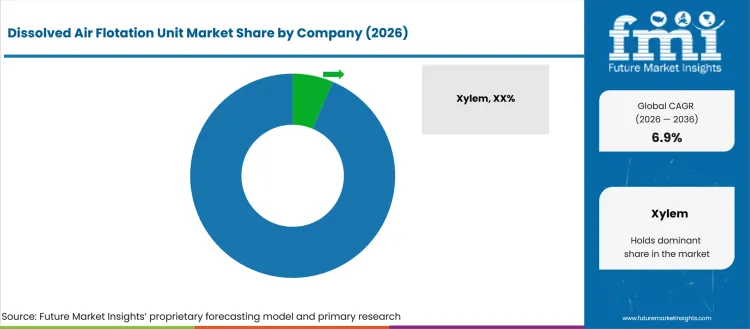
Dissolved Air Flotation Unit Market competition is strongest where suppliers can connect technical performance with operating accountability. Buyers compare who can reduce downtime, compliance exposure, inspection burden; or integration risk after purchase.
- Water technology suppliers such as Xylem, Veolia Water Technologies, WesTech Engineering and DAF Corporation matter when buyers compare supplier fit against the approval burden. Their value depends on evidence quality and service response after selection.
- DAF equipment specialists such as Toro Equipment, KWI Group, FRC Systems and Nijhuis Saur Industries are useful where procurement needs a supplier role that is clear before volume expands. Buyers check whether the group can support the use case after approval.
- Regional system integrators such as Ecologix and Hydroflux matter when buyers need local support and order continuity. They help when field issues must be resolved close to the operating site.
Competitive Benchmarking: Dissolved Air Flotation Unit Market
| Company | Specification Fit | Service Capability | Project Support | Geographic Footprint |
|---|---|---|---|---|
| Xylem | High | High | Strong | Global |
| Veolia Water Technologies | High | Medium | Strong | Global |
| WesTech Engineering | Strong | High | Medium | Global or regional |
| DAF Corporation | Medium | High | Medium | Regional |
| Toro Equipment | Strong | Medium | Medium | Regional or global |
| KWI Group | High | High | Strong | Global |
| FRC Systems | High | Medium | Strong | Global |
| Nijhuis Saur Industries | Strong | High | Medium | Global or regional |
| Ecologix | Medium | High | Medium | Regional |
| Hydroflux | Strong | Medium | Medium | Regional or global |
Source: Future Market Insights competitive analysis, 2026. Ratings for Dissolved Air Flotation Unit Market reflect specification fit, implementation support, lifecycle service capability; channel reach; and relevance to operating-risk reduction.
Key Players in the Dissolved Air Flotation Unit Market
Water technology suppliers
- Xylem
- Veolia Water Technologies
- WesTech Engineering
- DAF Corporation
DAF equipment specialists
- Toro Equipment
- KWI Group
- FRC Systems
- Nijhuis Saur Industries
Regional system integrators
- Ecologix
- Hydroflux
Dissolved Air Flotation Unit Market - Report Scope
| Coverage field | Report scope |
|---|---|
| Market breakdown | Dissolved Air Flotation Unit Market Breakdown By Unit Type, By Flow Capacity and By Application; End Use and By Sales Channel |
| Market Definition | Commercial demand for products; services covered under Dissolved Air Flotation Unit Market; including country demand; segment demand; and supplier-selection context |
| Regions Covered | North America; Latin America; Europe; East Asia; South Asia and Pacific; Middle East and Africa |
| Countries Covered | United States; United Kingdom; Germany; France; Japan; China; South Korea; India; and 30+ countries |
| Key Companies Profiled | Xylem; Veolia Water Technologies; WesTech Engineering; DAF Corporation; Toro Equipment; KWI Group; FRC Systems; Nijhuis Saur Industries; Ecologix; and Hydroflux |
| Forecast Period | 2026 to 2036 |
| Approach | Dissolved Air Flotation Unit Market: Installed-base demand, project and replacement cycles, country infrastructure context; segment shares; and supplier relevance were used to build the sizing approach. |
Dissolved Air Flotation Unit Market - Research Methodology
| Method | Approach |
|---|---|
| Primary Research | FMI analysts reviewed Dissolved Air Flotation Unit Market inputs from plant engineers, project owners, maintenance teams; and system integrators. Discussions focused on procurement need and specification fit. Service expectations and adoption barriers were also reviewed. |
| Desk Research | EPA NPDES; EPA Water Research; World Bank Water Data; official company sources |
| Market Sizing and Forecasting | The Dissolved Air Flotation Unit Market estimate combines global value, country demand allocation, segment shares; and replacement or project-use cases. Forecast assumptions are checked against compliance pressure, uptime risk, service depth; and implementation maturity. |
| Data Validation | Dissolved Air Flotation Unit Market values are checked across unit, application, end-use; sales-channel; and country totals. Company relevance is reviewed against technical fit and service capability, not generic industrial presence. |
Dissolved Air Flotation Unit Market by Segments
Dissolved Air Flotation Unit Market segmented by Unit Type:
- Circular DAF Units
- Rectangular DAF Units
- Compact Packaged DAF
- High-rate DAF Units
Dissolved Air Flotation Unit Market segmented by Flow Capacity:
- <100 m³/hr
- 100-500 m³/hr
- >500 m³/hr
Dissolved Air Flotation Unit Market segmented by Application:
- Industrial Wastewater
- Municipal Wastewater
- Food and Beverage Effluent
- Oil and Grease Removal
Dissolved Air Flotation Unit Market segmented by End Use:
- Food and Beverage
- Pulp and Paper
- Chemicals
- Municipal Utilities
Dissolved Air Flotation Unit Market segmented by Sales Channel:
- Direct OEM
- EPC / Integrators
- Service Retrofit
Research Sources and Bibliography
Secondary validation for Dissolved Air Flotation Unit Market uses air-quality evidence, environmental monitoring, mining exposure and trade references together. WHO, EPA and EEA sources explain why monitoring matters. World Bank and trade data help test where industrial exposure can support demand.
- 1. WHO Air Pollution. https://www.who.int/health-topics/air-pollution. Public-health context used to frame air-quality monitoring need.
- 2. USA EPA AirData. https://www.epa.gov/outdoor-air-quality-data. Monitoring data context used to ground pollutant and measurement references.
- 3. European Environment Agency Air Quality. https://www.eea.europa.eu/en/topics/in-depth/air-pollution. Regional air-quality evidence used to compare monitoring pressure.
- 4. UNEP Pollution Action. https://www.unep.org/explore-topics/chemicals-waste/what-we-do/pollution-action. Environmental policy context used to avoid narrow equipment-only framing.
- 5. World Bank Data. https://data.worldbank.org/. Industrial and urban indicators used to test country exposure.
- 6. UN Comtrade. https://comtradeplus.un.org/. Trade flows used to test monitoring-equipment and industrial-demand exposure.
- 7. Xylem. https://www.xylem.com/. Official company and product portfolio information used for competitive context.
- 8. Veolia Water Technologies. https://www.veoliawatertechnologies.com/. Official company and product portfolio information used for competitive context.
- 9. WesTech Engineering. https://www.westech-inc.com/. Official company and product portfolio information used for competitive context.
- 10. DAF Corporation. https://www.dafcorp.com/. Official company and product portfolio information used for competitive context.
- 11. Toro Equipment. https://www.toroequipment.com/. Official company and product portfolio information used for competitive context.
- 12. KWI Group. https://www.kwi-group.com/. Official company and product portfolio information used for competitive context.
- 13. FRC Systems. https://frcsystems.com/. Official company and product portfolio information used for competitive context.
This Report Answers
- What value is forecast for the Dissolved Air Flotation Unit Market in 2026 and by 2036?
- What CAGR is forecast for the Dissolved Air Flotation Unit Market during the 2026 to 2036 period?
- Which segment groups are used to assess demand across Dissolved Air Flotation Unit Market?
- Which buyer problems are creating procurement interest in Dissolved Air Flotation Unit Market?
- How do the main segment shares shape Dissolved Air Flotation Unit Market decisions in the 2026 base?
- Which countries are profiled in the Dissolved Air Flotation Unit Market forecast and how do their CAGRs differ?
- Which companies are assessed in this market?
- What should Dissolved Air Flotation Unit Market buyers evaluate before changing suppliers?
- How does FMI size and validate Dissolved Air Flotation Unit Market country and segment demand?
- What risks could delay Dissolved Air Flotation Unit Market adoption, qualification, or repeat purchasing?
Frequently Asked Questions
Why should executives track the Dissolved Air Flotation Unit Market?
Executives should track Dissolved Air Flotation Unit Market because effluent compliance and solids-removal uptime affects procurement risk and operating performance. The value is in knowing where the purchase can reduce cost, avoid disruption, or improve buyer confidence.
What business problem does the Dissolved Air Flotation Unit Market address?
The market addresses downtime, equipment reliability, safety; and lifecycle cost. Buyers use the category when routine procurement is no longer enough to manage performance and documentation. Service and continuity expectations also shape the decision.
What should Dissolved Air Flotation Unit Market procurement leaders evaluate before selecting suppliers?
Dissolved Air Flotation Unit Market procurement leaders should test specification fit, installation burden, service coverage; lifecycle cost; and integration risk. A lower unit price is weak if downtime, commissioning, or maintenance cost rises after purchase.
What can limit return on investment for buyers?
Dissolved Air Flotation Unit Market payback depends on whether the product lowers downtime, inspection effort, compliance exposure; rework; or lifecycle cost. Buyers reduce risk by setting acceptance tests and service responsibilities before rollout.
How can suppliers build executive confidence?
Dissolved Air Flotation Unit Market suppliers build confidence when they can support specification review, installation, commissioning; and service response after approval. Buyers value partners that keep the system usable in the field.
Preview the report firsthand - request a free sample
Get SampleGet the brochure for pricing and purchase details.
Get PDFTable of Content
- Key Takeaways
- Market Size and CAGR
- Top Growth Driver
- Fastest Growing Segment
- Leading Region
- Key Companies
- Emerging Opportunities
- Executive Summary
- Global Market Outlook
- Demand-side Trends
- Supply-side Trends
- Technology Roadmap Analysis
- Analysis and Recommendations
- Analyst Perspective (What is happening? Why now? What should investors know?)
- Key Questions Answered
- How large is the market?
- What is the CAGR?
- What are key trends?
- Which region dominates?
- Who are the leaders?
- Market Overview
- Market Coverage / Taxonomy
- Market Definition / Scope / Limitations
- Research Methodology
- Chapter Orientation
- Analytical Lens and Working Hypotheses
- Market Structure, Signals, and Trend Drivers
- Benchmarking and Cross-market Comparability
- Market Sizing, Forecasting, and Opportunity Mapping
- Research Design and Evidence Framework
- Desk Research Programme (Secondary Evidence)
- Expert Input and Fieldwork (Primary Evidence)
- Tooling, Models, and Reference Databases
- Data Engineering and Model Build
- Quality Assurance and Audit Trail
- Market Background
- Market Dynamics (Drivers, Restraints, Opportunity, Trends)
- Scenario Forecast (Optimistic, Likely, Conservative)
- Impact Analysis
- AI Impact
- Sustainability Impact
- Regulatory Impact
- Technology Impact
- Consumer / Buyer Analysis
- Purchase Drivers
- Adoption Barriers
- Buyer Journey
- Opportunity Map Analysis
- Product Life Cycle Analysis
- Supply Chain Analysis
- Investment Feasibility Matrix
- Value Chain Analysis
- PESTLE and Porter's Analysis
- Regulatory Landscape
- Regional Parent Market Outlook
- Production and Consumption Statistics
- Import and Export Statistics
- Global Market Analysis and Forecast, 2021 to 2036
- Historical Market Size Value (USD Million) Analysis, 2021 to 2025
- Current and Future Market Size Value (USD Million) Projections, 2026 to 2036
- Y-o-Y Growth Trend Analysis
- Absolute $ Opportunity Analysis
- Global Market Pricing Analysis, 2021 to 2036
- Global Market Analysis and Forecast, By Value (USD Million) Type, 2021 to 2036
- Introduction / Key Findings
- Historical Market Size Value (USD Million) Analysis By Value (USD Million) Type, 2021 to 2025
- Current and Future Market Size Value (USD Million) Analysis and Forecast By Value (USD Million) Type, 2026 to 2036
- Circular DAF Units
- Rectangular DAF Units
- Compact Packaged DAF
- High-rate DAF Units
- Circular DAF Units
- Y-o-Y Growth Trend Analysis By Value (USD Million) Type, 2021 to 2025
- Absolute $ Opportunity Analysis By Value (USD Million) Type, 2026 to 2036
- Global Market Analysis and Forecast, By Flow Capacity, 2021 to 2036
- Introduction / Key Findings
- Historical Market Size Value (USD Million) Analysis By Flow Capacity, 2021 to 2025
- Current and Future Market Size Value (USD Million) Analysis and Forecast By Flow Capacity, 2026 to 2036
- <100 m³ per hr
- 100-500 m³ per hr
- 500 m³per hr
- <100 m³ per hr
- Y-o-Y Growth Trend Analysis By Flow Capacity, 2021 to 2025
- Absolute $ Opportunity Analysis By Flow Capacity, 2026 to 2036
- Global Market Analysis and Forecast, By Application, 2021 to 2036
- Introduction / Key Findings
- Historical Market Size Value (USD Million) Analysis By Application, 2021 to 2025
- Current and Future Market Size Value (USD Million) Analysis and Forecast By Application, 2026 to 2036
- Industrial Wastewater
- Municipal Wastewater
- Food and Beverage Effluent
- Oil and Grease Removal
- Industrial Wastewater
- Y-o-Y Growth Trend Analysis By Application, 2021 to 2025
- Absolute $ Opportunity Analysis By Application, 2026 to 2036
- Global Market Analysis and Forecast, By End Use, 2021 to 2036
- Introduction / Key Findings
- Historical Market Size Value (USD Million) Analysis By End Use, 2021 to 2025
- Current and Future Market Size Value (USD Million) Analysis and Forecast By End Use, 2026 to 2036
- Food and Beverage
- Pulp and Paper
- Chemicals
- Municipal Utilities
- Food and Beverage
- Y-o-Y Growth Trend Analysis By End Use, 2021 to 2025
- Absolute $ Opportunity Analysis By End Use, 2026 to 2036
- Global Market Analysis and Forecast, By Sales Channel, 2021 to 2036
- Introduction / Key Findings
- Historical Market Size Value (USD Million) Analysis By Sales Channel, 2021 to 2025
- Current and Future Market Size Value (USD Million) Analysis and Forecast By Sales Channel, 2026 to 2036
- Direct OEM
- EPC - Integrators
- Service Retrofit
- Direct OEM
- Y-o-Y Growth Trend Analysis By Sales Channel, 2021 to 2025
- Absolute $ Opportunity Analysis By Sales Channel, 2026 to 2036
- Global Market Analysis and Forecast, By Region, 2021 to 2036
- Introduction
- Historical Market Size Value (USD Million) Analysis By Region, 2021 to 2025
- Current Market Size Value (USD Million) Analysis and Forecast By Region, 2026 to 2036
- North America
- Latin America
- Western Europe
- Eastern Europe
- East Asia
- South Asia and Pacific
- Middle East & Africa
- Market Attractiveness Analysis By Region
- North America Market Analysis and Forecast, By Country, 2021 to 2036
- Historical Market Size Value (USD Million) Trend Analysis By Market Taxonomy, 2021 to 2025
- Market Size Value (USD Million) Forecast By Market Taxonomy, 2026 to 2036
- By Country
- USA
- Canada
- By Value (USD Million) Type
- By Flow Capacity
- By Application
- By End Use
- By Sales Channel
- By Country
- Market Attractiveness Analysis
- By Country
- By Value (USD Million) Type
- By Flow Capacity
- By Application
- By End Use
- By Sales Channel
- Key Takeaways
- Latin America Market Analysis and Forecast, By Country
- Historical Market Size Value (USD Million) Trend Analysis By Market Taxonomy, 2021 to 2025
- Market Size Value (USD Million) Forecast By Market Taxonomy, 2026 to 2036
- By Country
- Brazil
- Mexico
- Chile
- Rest of Latin America
- By Value (USD Million) Type
- By Flow Capacity
- By Application
- By End Use
- By Sales Channel
- By Country
- Market Attractiveness Analysis
- By Country
- By Value (USD Million) Type
- By Flow Capacity
- By Application
- By End Use
- By Sales Channel
- Key Takeaways
- Western Europe Market Analysis and Forecast, By Country
- Historical Market Size Value (USD Million) Trend Analysis By Market Taxonomy, 2021 to 2025
- Market Size Value (USD Million) Forecast By Market Taxonomy, 2026 to 2036
- By Country
- Germany
- UK
- Italy
- Spain
- France
- Nordic
- BENELUX
- Rest of Western Europe
- By Value (USD Million) Type
- By Flow Capacity
- By Application
- By End Use
- By Sales Channel
- By Country
- Market Attractiveness Analysis
- By Country
- By Value (USD Million) Type
- By Flow Capacity
- By Application
- By End Use
- By Sales Channel
- Key Takeaways
- Eastern Europe Market Analysis and Forecast, By Country
- Historical Market Size Value (USD Million) Trend Analysis By Market Taxonomy, 2021 to 2025
- Market Size Value (USD Million) Forecast By Market Taxonomy, 2026 to 2036
- By Country
- Russia
- Poland
- Hungary
- Balkan & Baltic
- Rest of Eastern Europe
- By Value (USD Million) Type
- By Flow Capacity
- By Application
- By End Use
- By Sales Channel
- By Country
- Market Attractiveness Analysis
- By Country
- By Value (USD Million) Type
- By Flow Capacity
- By Application
- By End Use
- By Sales Channel
- Key Takeaways
- East Asia Market Analysis and Forecast, By Country
- Historical Market Size Value (USD Million) Trend Analysis By Market Taxonomy, 2021 to 2025
- Market Size Value (USD Million) Forecast By Market Taxonomy, 2026 to 2036
- By Country
- China
- Japan
- South Korea
- By Value (USD Million) Type
- By Flow Capacity
- By Application
- By End Use
- By Sales Channel
- By Country
- Market Attractiveness Analysis
- By Country
- By Value (USD Million) Type
- By Flow Capacity
- By Application
- By End Use
- By Sales Channel
- Key Takeaways
- South Asia and Pacific Market Analysis and Forecast, By Country
- Historical Market Size Value (USD Million) Trend Analysis By Market Taxonomy, 2021 to 2025
- Market Size Value (USD Million) Forecast By Market Taxonomy, 2026 to 2036
- By Country
- India
- ASEAN
- Australia & New Zealand
- Rest of South Asia and Pacific
- By Value (USD Million) Type
- By Flow Capacity
- By Application
- By End Use
- By Sales Channel
- By Country
- Market Attractiveness Analysis
- By Country
- By Value (USD Million) Type
- By Flow Capacity
- By Application
- By End Use
- By Sales Channel
- Key Takeaways
- Middle East & Africa Market Analysis and Forecast, By Country
- Historical Market Size Value (USD Million) Trend Analysis By Market Taxonomy, 2021 to 2025
- Market Size Value (USD Million) Forecast By Market Taxonomy, 2026 to 2036
- By Country
- Kingdom of Saudi Arabia
- Other GCC Countries
- Türkiye
- South Africa
- Other African Union
- Rest of Middle East & Africa
- By Value (USD Million) Type
- By Flow Capacity
- By Application
- By End Use
- By Sales Channel
- By Country
- Market Attractiveness Analysis
- By Country
- By Value (USD Million) Type
- By Flow Capacity
- By Application
- By End Use
- By Sales Channel
- Key Takeaways
- Key Countries Market Analysis
- USA
- Pricing Analysis
- Market Share Analysis, 2025
- By Value (USD Million) Type
- By Flow Capacity
- By Application
- By End Use
- By Sales Channel
- Canada
- Pricing Analysis
- Market Share Analysis, 2025
- By Value (USD Million) Type
- By Flow Capacity
- By Application
- By End Use
- By Sales Channel
- Mexico
- Pricing Analysis
- Market Share Analysis, 2025
- By Value (USD Million) Type
- By Flow Capacity
- By Application
- By End Use
- By Sales Channel
- Brazil
- Pricing Analysis
- Market Share Analysis, 2025
- By Value (USD Million) Type
- By Flow Capacity
- By Application
- By End Use
- By Sales Channel
- Chile
- Pricing Analysis
- Market Share Analysis, 2025
- By Value (USD Million) Type
- By Flow Capacity
- By Application
- By End Use
- By Sales Channel
- Germany
- Pricing Analysis
- Market Share Analysis, 2025
- By Value (USD Million) Type
- By Flow Capacity
- By Application
- By End Use
- By Sales Channel
- UK
- Pricing Analysis
- Market Share Analysis, 2025
- By Value (USD Million) Type
- By Flow Capacity
- By Application
- By End Use
- By Sales Channel
- Italy
- Pricing Analysis
- Market Share Analysis, 2025
- By Value (USD Million) Type
- By Flow Capacity
- By Application
- By End Use
- By Sales Channel
- Spain
- Pricing Analysis
- Market Share Analysis, 2025
- By Value (USD Million) Type
- By Flow Capacity
- By Application
- By End Use
- By Sales Channel
- France
- Pricing Analysis
- Market Share Analysis, 2025
- By Value (USD Million) Type
- By Flow Capacity
- By Application
- By End Use
- By Sales Channel
- India
- Pricing Analysis
- Market Share Analysis, 2025
- By Value (USD Million) Type
- By Flow Capacity
- By Application
- By End Use
- By Sales Channel
- ASEAN
- Pricing Analysis
- Market Share Analysis, 2025
- By Value (USD Million) Type
- By Flow Capacity
- By Application
- By End Use
- By Sales Channel
- Australia & New Zealand
- Pricing Analysis
- Market Share Analysis, 2025
- By Value (USD Million) Type
- By Flow Capacity
- By Application
- By End Use
- By Sales Channel
- China
- Pricing Analysis
- Market Share Analysis, 2025
- By Value (USD Million) Type
- By Flow Capacity
- By Application
- By End Use
- By Sales Channel
- Japan
- Pricing Analysis
- Market Share Analysis, 2025
- By Value (USD Million) Type
- By Flow Capacity
- By Application
- By End Use
- By Sales Channel
- South Korea
- Pricing Analysis
- Market Share Analysis, 2025
- By Value (USD Million) Type
- By Flow Capacity
- By Application
- By End Use
- By Sales Channel
- Russia
- Pricing Analysis
- Market Share Analysis, 2025
- By Value (USD Million) Type
- By Flow Capacity
- By Application
- By End Use
- By Sales Channel
- Poland
- Pricing Analysis
- Market Share Analysis, 2025
- By Value (USD Million) Type
- By Flow Capacity
- By Application
- By End Use
- By Sales Channel
- Hungary
- Pricing Analysis
- Market Share Analysis, 2025
- By Value (USD Million) Type
- By Flow Capacity
- By Application
- By End Use
- By Sales Channel
- Kingdom of Saudi Arabia
- Pricing Analysis
- Market Share Analysis, 2025
- By Value (USD Million) Type
- By Flow Capacity
- By Application
- By End Use
- By Sales Channel
- Türkiye
- Pricing Analysis
- Market Share Analysis, 2025
- By Value (USD Million) Type
- By Flow Capacity
- By Application
- By End Use
- By Sales Channel
- South Africa
- Pricing Analysis
- Market Share Analysis, 2025
- By Value (USD Million) Type
- By Flow Capacity
- By Application
- By End Use
- By Sales Channel
- USA
- Market Structure Analysis
- Competition Dashboard
- Competition Benchmarking
- Market Share Analysis of Top Players
- By Regional
- By Value (USD Million) Type
- By Flow Capacity
- By Application
- By End Use
- By Sales Channel
- Emerging Startups
- Innovation Benchmarking
- Competition Analysis
- Competition Deep Dive
- Xylem
- Overview
- Product Portfolio
- Profitability by Market Segments
- Sales Footprint
- Strategy Overview
- Marketing Strategy
- Product Strategy
- Channel Strategy
- Veolia Water Technologies
- WesTech Engineering
- DAF Corporation
- Toro Equipment
- KWI Group
- FRC Systems
- Nijhuis Saur Industries
- Ecologix
- Hydroflux
- Xylem
- Case Studies
- Success Stories
- Recent Developments
- Competition Deep Dive
- Assumptions & Acronyms Used


