Reports

- Global Locations -

Headquarters

Future Market Insights, Inc.

Christiana Corporate, 200
Continental Drive, Suite 401,
Newark, Delaware - 19713,
United States

T: +1-845-579-5705

Americas

Future Market Insights, Inc.

616 Corporate Way, Suite 2-9018,
Valley Cottage, NY 10989, United States

T: +1-347-918-3531

MEA

Future Market Insights

1602-6 Jumeirah Bay X2 Tower, Plot No: JLT-PH2-X2A,
Jumeirah Lakes Towers, Dubai,
United Arab Emirates

Europe

Future Market Insights

3rd Floor, 207 Regent Street,
W1B 3HH London
United Kingdom

T: + 44 (0) 20 8123 9659
D: +44 (0) 20 3287 4268

Asia Pacific

Future Market Insights

IndiaLand Global Tech Park, Unit UG-1, Behind Grand HighStreet, Phase 1, Hinjawadi, MH, Pune – 411057, India

Distributed Antenna Systems Market Outlook (2022 to 2032)

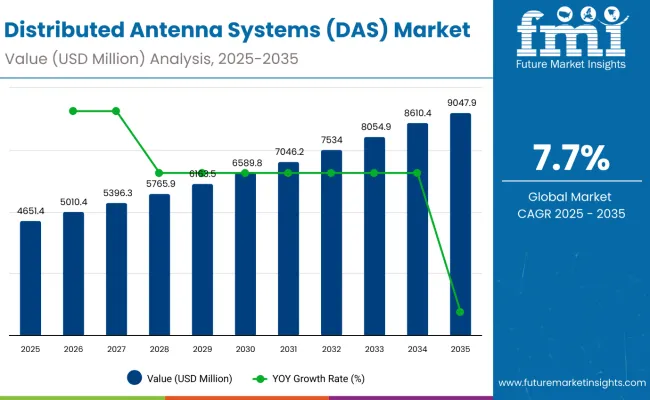
The distributed antenna systems market was estimated at US$ 10.8 Billion in 2021 and is expected to reach US$ 12 Billion in 2022, reflecting a Y-o-Y increase worth 11.1%. According to the analysis, the global distributed antenna systems market is anticipated to secure a value of US$ 29.7 Billion in 2032, while flourishing at a 9.5% CAGR from 2022 to 2032.

The developments in communication technology that have led to the evolution of high-speed connectivity, lesser power-consuming network devices, and more substantial connectivity, and others are projected to fuel the market. Also, the development of communication technology is projected to play a vital role in strengthening the market.

Attributes Details
Distributed Antenna Systems Market CAGR (2022 to 2032) 9.5%
Distributed Antenna Systems Market (2032) US$ 29.7 Billion
Distributed Antenna Systems Market Attraction Advancements in communication technology that have led to the evolution of high-speed connectivity, lesser power-consuming network devices, and more substantial connectivity, and others are projected to fuel the market. Also, the development of communication technology is projected to play a vital role in strengthening the market

Don't pay for what you don't need

Customize your report by selecting specific countries or regions and save 30%!

What are the Principal Factors Boosting the Global Distributed antenna systems Market?

The rise in smartphone users has led to the need for efficient cellular network coverage, which in turn results in the proliferation of the market. Another factor propelling the growth is the capacity of the system to support Different operators coupled with interconnectivity with other antenna modules is another factor aiding with market growth.

Many service providers are focusing on providing cost-effective and advanced services to subscribers using data-intensive applications such as video and audio streaming. This will drive the deployment of distributed antenna systems system.

Additional factors substantiating the market growth include the emergence of the next-generation wireless market and the rising demand for steady connectivity. On the other hand, factors such as the high installation cost of the distributed antenna systems system and lack of infrastructure are expected to obstruct market growth over the forecast period.

What are the Emerging Opportunities in the Global Distributed antenna systems Market?

The global distributed antenna systems market is expected to grow at a significant rate during the forecast period 2022 to 2032. The increase in higher bandwidth applications, the rising need for faster data transmission and in-building demand is contributing to the growth of the distributed antenna systems system market around the globe.

Rapid urbanization is leading to the development of metropolitan cities, and increasing the consumer demand for continuous and strong internet connectivity, thereby driving the demand for distributed antenna systems in forecasted years. Also, the capability of distributed antenna systems to support multiple operators and interconnectivity is expected to accelerate demand for distributed antenna systems during the forecast period.

DAS is a sequence of radio heads well positioned around a targeted place to fulfill the requirement of additional cellular coverage. Each of the radio heads within the DAS is then routed to a communication center through the fiber-optic cable to permit the cell signal to be managed by a cellular base station.

Sudip Saha
Sudip Saha

Principal Consultant

Talk to Analyst

Find your sweet spots for generating winning opportunities in this market.

What are the Factors Hampering the Global Distributed Antenna Systems Market?

The presence of stringent rules and regulations of various governments regarding the usage of satellites is expected to be the key factor hampering the market growth in the forecast period. Also, the high initial investment cost associated with the acquisition of a site for the installation of a telecom network is turning out to be the major challenge faced by most of the vendors in distributed antenna systems market.

High maintenance costs and complexity in the installation of distributed antenna systems may act as a restraint for the distributed antenna systems market. Moreover, new entrants in developing distributed antenna systems international market are also boosting the growth of distributed antenna systems market in a positive manner.

What is the Segmentation Analysis of the Global Distributed antenna systems Market?

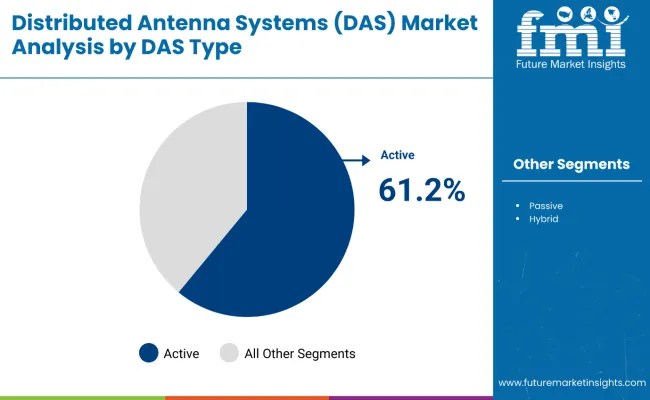
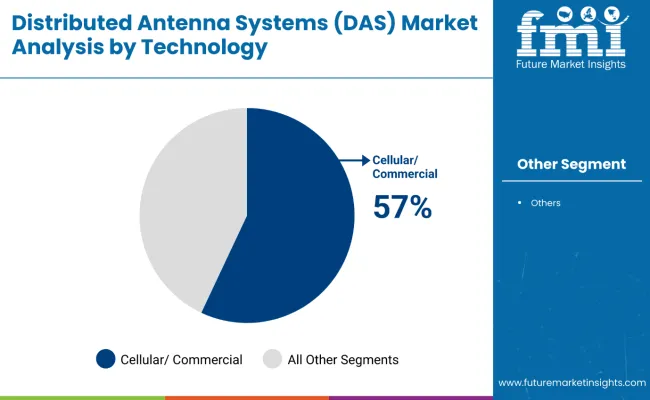
Distributed antenna systems market can be segmented on the basis of type, component, ownership model, application, and region. Based on components, the global distributed antenna systems market can be segmented into hardware and services, with the former registering a 9.7% value CAGR. Based on technology, the distributed antenna systems market can be segmented into Cellular/Commercial DAS and Public Safety DAS. The cellular/commercial segment is poised to document a CAGR worth 9.2% until 2032.

Based on application, the distributed antenna systems market can be segmented into entertainment venues, hospitals, shopping malls, educational institutions, offices, restaurants, hotels, residential, and others. On the basis of End-user, the market can be segmented into Offices/Corporate Campus, Hospitality, Health Care, Education, Transportation, Government, Industrial, Stadium and Arenas, and others.

Get the data you need at a Fraction of the cost

Personalize your report by choosing insights you need
and save 40%!

What is the Regional Analysis of the Global Distributed antenna Systems Market?

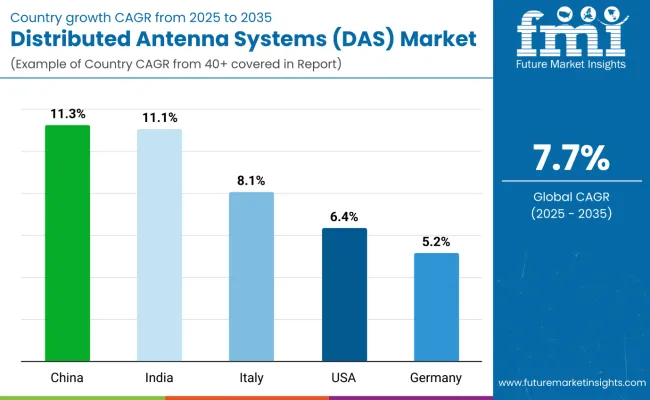
The USA is expected to expand at a considerable CAGR over the forecast period, documenting a CAGR worth 8.6% from 2022 to 2032. The growth of the market is attributed to the increasing use of smartphones and ever-growing wireless traffic expected to further drive regional expansion.

Even the government had intervened with the assurance that the telecommunication operators share DAS owned by them so that the customers of all operators can have the threshold bandwidth everywhere and these new technologies have wider adoption in the region. Also, increasing government involvement owing to rising national security concerns is anticipated to positively influence the market in the coming time.
Asia Pacific DAS market is expected to register the highest growth rate over the forecast period. Owing to the increasing infrastructural growth in India and China can be accredited to regional growth. Furthermore, the rising deployment of 4G/LTE connections along with the substantial presence of DAS providers is further contributing to the growth of the DAS market.

Asia Pacific as well as the Japan region is expected to witness significant growth in the distributed antenna systems market. The high growth of APEJ is attributed to the trends of 4G subscribers and the growing development of commercial buildings in the region. Eastern Europe and Latin America are expected to see a moderate growth rate in the distributed antenna systems market. The deployment of 4G/LTE technologies and infrastructural growth offers numerous opportunities for the deployment of the DAS solution. On the other hand, growth in Europe is majorly driven by increasing public venues and safety, healthcare, and the industrial sector.

In addition, Japan has been recognized as another potent player in the region. According to the analysis, the country is anticipated at US$ 1.2 Billion while recording a CAGR of 8.5% in the forecast period. The development of the regional market can be credited to the rapid development in the concerned field. South Korea is also estimated at US$ 1 Billion. The growth rate of South Korea is anticipated to be 10.5% while for China it is estimated at 8.2% from 2022 to 2032.

Country Estimated CAGR
USA 8.6%
UK 8.6%
Japan 8.5%
China 8.2%
South Korea 10.5%

Who are the Key Players of the Global Distributed antenna systems Market?

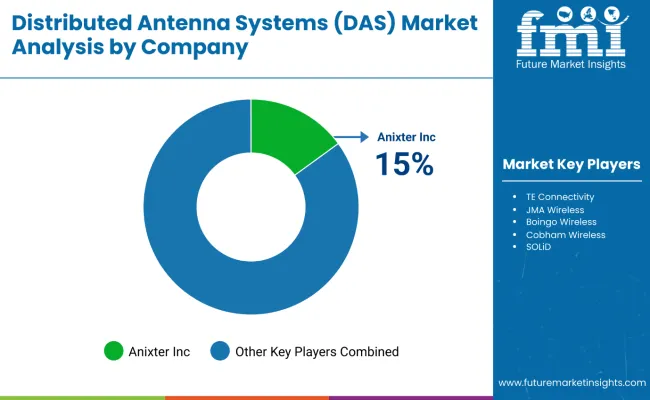
Eminent players in the global distributed antenna systems market include American Tower Corporation, AT&T Inc., Bird Technologies, Boingo Wireless Inc., and Cobham Wireless among players among others. Market players strive to provide combined open-source and industry-leading solutions irrespective of the deployment of the technology on- the cloud, and on-premises. Recent key developments among players include:

  • For instance, in October 2016, CommScope Holding Company, Inc. introduced Ultra-Wideband antennas for the USA and Europe regions, which support the latest spectrum of 1400 MHz and 600 MHz frequency bands for cellular network use. On the other hand, In January 2016, Advanced RF Technologies, Inc. a leading provider of wireless coverage and capacity solutions, launched ADX V, which is an upgraded version of distributed antenna systems and is designed to support both single carrier and neutral host applications.
  • August 25, 2018 - AT&T Inc. (USA), a leading global telecom company providing entertainment, mobile, and high-speed internet services announced an investment of over 6 Billion. USD in their Texas wireless and wired networks to boost reliability, coverage, speed, and overall performance for residents and businesses while improving critical services that support public safety and first responders.
  • The AT&T LTE network that covers Notable Detroit area network enhancements includes Distributed antenna systems Network (DAS) upgrades at Detroit Metro Airport and GM Renaissance Center and others.

Key Segments Covered in the Global Distributed Antenna Systems Market Report

Distributed Antenna Systems by Component:

  • Distributed Antenna Hardware
    • Active Hardware
      • Head-end Remotes
      • Trays
      • Antennas
      • Others
    • Passive Hardware
      • Donor Antennas
      • Trays
      • Repeaters
      • Others
    • Distributed Antenna Cabling
      • Coaxial
      • Optical Fiber
      • CAT-5
      • Others
    • Hybrid Distributed Antenna Systems
      • Head-End and Remotes
      • Repeaters
  • Distributed Antenna Services
    • Distributed Antenna Systems Design and Installation
    • Distributed Antenna Systems Maintenance

Distributed Antenna Systems by Technology:

  • Cellular/Commercial Distributed Antenna Systems
  • Public Safety Distributed Antenna Systems

Distributed Antenna Systems by End Users:

  • Distributed Antenna Systems for Offices/Corporate Campuses
  • Distributed Antenna Systems for Hospitality
  • Distributed Antenna Systems for Healthcare
  • Distributed Antenna Systems for Education
  • Distributed Antenna Systems for Transportation
  • Distributed Antenna Systems for Government
  • Distributed Antenna Systems for Industrial Use
  • Distributed Antenna Systems for Stadiums and Arenas
  • Distributed Antenna Systems for Other End Users

Distributed Antenna Systems by Region:

  • North America Distributed Antenna Systems Market
  • Europe Distributed Antenna Systems Market
  • Asia Pacific Distributed Antenna Systems Market
  • Middle East & Africa Distributed Antenna Systems Market
  • South America Distributed Antenna Systems Market

Frequently Asked Questions

What is the estimated market size of the distributed antenna systems market in 2021?

The distributed antenna systems market is estimated at US$ 10.8 Billion in 2021.

What is the projected market value of the distributed antenna systems market by 2032?

The distributed antenna systems market is expected to value US$ 29.7 Billion, recording a CAGR of 9.5% during the forecast period.

Who are the key players in the distributed antenna systems market?

American Tower Corporation, AT&T Inc., Bird Technologies, Boingo Wireless Inc., Cobham Wireless among others are some of the established players in the market.

What is the expected growth rate of the distributed antenna systems market in the USA?

The USA market is estimated to expand at 8.6% growth rate during the forecast period.

What is the estimated market value of the Japan market?

The Japan market is expected to garner US$ 1.2 Billion while expanding at an 8.5% CAGR from 2022 to 2032

Table of Content

1. Preface | Distributed Antenna Systems Market

    1.1. Market Definition and Scope

    1.2. Market Segmentation

    1.3. Key Research Objectives

    1.4. Research Highlights

2. Assumptions and Research Methodology

3. Executive Summary: Global Market

4. Market Overview

    4.1. Introduction

    4.2. Market Dynamics

        4.2.1. Drivers

        4.2.2. Restraints

        4.2.3. Opportunities

    4.3. Key Market Indicators

        4.3.1. Adoption of Portable Devices

    4.4. Global Market Analysis and Forecasts, 2016 to 2032

        4.4.1. Market Revenue Projections (US$ Million)

    4.5. Porter’s Five Force Analysis

    4.6. Value Chain Analysis

        4.6.1. List of Active Market Participants (Manufacturers/ Retailer/ Distributors/ Vendors)

        4.6.2. Forward-Backward Integration Scenario

    4.7. Market Outlook

5. Global Market Analysis and Forecasts, by Component

    5.1. Overview & Definitions

    5.2. Key Trends

    5.3. Market Size (US$ Million) Forecast by Component, 2016 to 2032

        5.3.1. Hardware

            5.3.1.1. Active

            5.3.1.2. Trays

            5.3.1.3. Others

            5.3.1.4. Donor Antennas

            5.3.1.5. Repeaters

            5.3.1.6. Others

            5.3.1.7. Cabling

            5.3.1.8. Coaxial

            5.3.1.9. Optical Fiber

            5.3.1.10. CAT5

            5.3.1.11. Others

            5.3.1.12. Hybrid

            5.3.1.13. Head-end, and Remotes

            5.3.1.14. Repeaters

        5.3.2. Service

            5.3.2.1. Design and Installation

            5.3.2.2. Maintenance

    5.4. Component Comparison Matrix

    5.5. Market Attractiveness by Component

6. Global Market Analysis and Forecasts, by Technology

    6.1. Overview & Definition

    6.2. Key Trends

    6.3. Market Size (US$ Million) Forecast by Technology, 2016 to 2032

        6.3.1. Cellular/Commercial DAS

        6.3.2. Public Safety DAS

    6.4. Technology Comparison Matrix

    6.5. Market Attractiveness by Technology

7. Global Market Analysis and Forecasts, by End-user

    7.1. Overview & Definition

    7.2. Key Trends

    7.3. Market Size (US$ Million) Forecast by End-user, 2016 to 2032

        7.3.1. Offices/Corporate Campus

        7.3.2. Hospitality

            7.3.2.1. Hotels/Resorts

            7.3.2.2. Retail/Shopping Malls

        7.3.3. Health Care

        7.3.4. Education

        7.3.5. Transportation

            7.3.5.1. Airport/Train Stations

            7.3.5.2. Parking Structures/Underground/ Tunnels

        7.3.6. Government

        7.3.7. Industrial

        7.3.8. Stadiums and Arenas

        7.3.9. Others

    7.4. End-user Comparison Matrix

    7.5. Market Attractiveness by End-user

8. Global Market Analysis and Forecasts, by Region

    8.1. Key Findings

    8.2. Policies and Regulations

    8.3. Market Size (US$ Million) Forecast by Region, 2016 to 2032

        8.3.1. North America

        8.3.2. Europe

        8.3.3. Asia Pacific

        8.3.4. Middle East & Africa

        8.3.5. South America

    8.4. Market Attractiveness by Country/Region

9. North America Market Analysis and Forecast

    9.1. Key Findings

    9.2. Key Trends

    9.3. Market Size (US$ Million) Forecast by Component, 2016 to 2032

        9.3.1. Hardware

            9.3.1.1. Active

                9.3.1.1.1. Head-end, and Remotes

                9.3.1.1.2. Trays

                9.3.1.1.3. Antennas

                9.3.1.1.4. Others

            9.3.1.2. Passive

                9.3.1.2.1. Donor Antennas

                9.3.1.2.2. Trays

                9.3.1.2.3. Repeaters

                9.3.1.2.4. Others

            9.3.1.3. Cabling

                9.3.1.3.1. Coaxial

                9.3.1.3.2. Optical Fiber

                9.3.1.3.3. CAT5

                9.3.1.3.4. Others

            9.3.1.4. Hybrid

                9.3.1.4.1. Head-end, and Remotes

                9.3.1.4.2. Repeaters

        9.3.2. Service

            9.3.2.1. Design and Installation

            9.3.2.2. Maintenance

    9.4. Market Size (US$ Million) Forecast by Technology, 2016 to 2032

        9.4.1. Cellular/Commercial DAS

        9.4.2. Public Safety DAS

    9.5. Market Size (US$ Million) Forecast by End-user, 2016 to 2032

        9.5.1. Offices/Corporate Campus

        9.5.2. Hospitality

            9.5.2.1. Hotels/Resorts

            9.5.2.2. Retail/Shopping Malls

        9.5.3. Health Care

        9.5.4. Education

        9.5.5. Transportation

            9.5.5.1. Airport/Train Stations

            9.5.5.2. Parking Structures/Underground/ Tunnels

        9.5.6. Government

        9.5.7. Industrial

        9.5.8. Stadiums and Arenas

        9.5.9. Others

    9.6. Market Size (US$ Million) Forecast by Country/Sub-region, 2016 to 2032

        9.6.1. United States of America

        9.6.2. Canada

        9.6.3. Rest of North America

    9.7. Market Attractiveness Analysis

        9.7.1. by Country

        9.7.2. by Component

        9.7.3. by Technology

        9.7.4. by End-user

10. Europe Market Analysis and Forecast

    10.1. Key Findings

    10.2. Key Trends

    10.3. Market Size (US$ Million) Forecast by Component, 2016 to 2032

        10.3.1. Hardware

            10.3.1.1. Active

                10.3.1.1.1. Head-end, and Remotes

                10.3.1.1.2. Trays

                10.3.1.1.3. Antennas

                10.3.1.1.4. Others

            10.3.1.2. Passive

                10.3.1.2.1. Donor Antennas

                10.3.1.2.2. Trays

                10.3.1.2.3. Repeaters

                10.3.1.2.4. Others

            10.3.1.3. Cabling

                10.3.1.3.1. Coaxial

                10.3.1.3.2. Optical Fiber

                10.3.1.3.3. CAT5

                10.3.1.3.4. Others

            10.3.1.4. Hybrid

                10.3.1.4.1. Head-end, and Remotes

                10.3.1.4.2. Repeaters

        10.3.2. Service

            10.3.2.1. Design and Installation

            10.3.2.2. Maintenance

    10.4. Market Size (US$ Million) Forecast by Technology, 2016 to 2032

        10.4.1. Cellular/Commercial DAS

        10.4.2. Public Safety DAS

    10.5. Market Size (US$ Million) Forecast by End-user, 2016 to 2032

        10.5.1. Offices/Corporate Campus

        10.5.2. Hospitality

            10.5.2.1. Hotels/Resorts

            10.5.2.2. Retail/Shopping Malls

        10.5.3. Health Care

        10.5.4. Education

        10.5.5. Transportation

            10.5.5.1. Airport/Train Stations

            10.5.5.2. Parking Structures/Underground/ Tunnels

        10.5.6. Government

        10.5.7. Industrial

        10.5.8. Stadiums and Arenas

        10.5.9. Others

    10.6. Market Size (US$ Million) Forecast by Country/Sub-region, 2016 to 2032

        10.6.1. Germany

        10.6.2. France

        10.6.3. United Kingdom

        10.6.4. Italy

        10.6.5. Rest of Europe

    10.7. Market Attractiveness Analysis

        10.7.1. by Country

        10.7.2. by Component

        10.7.3. by Technology

        10.7.4. by End-user

11. Asia Pacific Market Analysis and Forecast

    11.1. Key Findings

    11.2. Key Trends

    11.3. Market Size (US$ Million) Forecast by Component, 2016 to 2032

        11.3.1. Hardware

            11.3.1.1. Active

                11.3.1.1.1. Head-end, and Remotes

                11.3.1.1.2. Trays

                11.3.1.1.3. Antennas

                11.3.1.1.4. Others

            11.3.1.2. Passive

                11.3.1.2.1. Donor Antennas

                11.3.1.2.2. Trays

                11.3.1.2.3. Repeaters

                11.3.1.2.4. Others

            11.3.1.3. Cabling

                11.3.1.3.1. Coaxial

                11.3.1.3.2. Optical Fiber

                11.3.1.3.3. CAT5

                11.3.1.3.4. Others

            11.3.1.4. Hybrid

                11.3.1.4.1. Head-end, and Remotes

                11.3.1.4.2. Repeaters

        11.3.2. Service

            11.3.2.1. Design and Installation

            11.3.2.2. Maintenance

    11.4. Market Size (US$ Million) Forecast by Technology, 2016 to 2032

        11.4.1. Cellular/Commercial DAS

        11.4.2. Public Safety DAS

    11.5. Market Size (US$ Million) Forecast by End-user, 2016 to 2032

        11.5.1. Offices/Corporate Campus

        11.5.2. Hospitality

            11.5.2.1. Hotels/Resorts

            11.5.2.2. Retail/Shopping Malls

        11.5.3. Health Care

        11.5.4. Education

        11.5.5. Transportation

            11.5.5.1. Airport/Train Stations

            11.5.5.2. Parking Structures/Underground/ Tunnels

        11.5.6. Government

        11.5.7. Industrial

        11.5.8. Stadiums and Arenas

        11.5.9. Others

    11.6. Market Size (US$ Million) Forecast by Country/Sub-region, 2016 to 2032

        11.6.1. China

        11.6.2. Japan

        11.6.3. Australia

        11.6.4. South Korea

        11.6.5. India

        11.6.6. Indonesia

        11.6.7. New Zealand

        11.6.8. Singapore

        11.6.9. Rest of Asia Pacific

    11.7. Market Attractiveness Analysis

        11.7.1. by Country

        11.7.2. by Component

        11.7.3. by Technology

        11.7.4. by End-user

12. Middle East & Africa (MEA) Market Analysis and Forecast

    12.1. Key Findings

    12.2. Key Trends

    12.3. Market Size (US$ Million) Forecast by Component, 2016 to 2032

        12.3.1. Hardware

            12.3.1.1. Active

                12.3.1.1.1. Head-end, and Remotes

                12.3.1.1.2. Trays

                12.3.1.1.3. Antennas

                12.3.1.1.4. Others

            12.3.1.2. Passive

                12.3.1.2.1. Donor Antennas

                12.3.1.2.2. Trays

                12.3.1.2.3. Repeaters

                12.3.1.2.4. Others

            12.3.1.3. Cabling

                12.3.1.3.1. Coaxial

                12.3.1.3.2. Optical Fiber

                12.3.1.3.3. CAT5

                12.3.1.3.4. Others

            12.3.1.4. Hybrid

                12.3.1.4.1. Head-end, and Remotes

                12.3.1.4.2. Repeaters

        12.3.2. Service

            12.3.2.1. Design and Installation

            12.3.2.2. Maintenance

    12.4. Market Size (US$ Million) Forecast by Technology, 2016 to 2032

        12.4.1. Cellular/Commercial DAS

        12.4.2. Public Safety DAS

    12.5. Market Size (US$ Million) Forecast by End-user, 2016 to 2032

        12.5.1. Offices/Corporate Campus

        12.5.2. Hospitality

            12.5.2.1. Hotels/Resorts

            12.5.2.2. Retail/Shopping Malls

        12.5.3. Health Care

        12.5.4. Education

        12.5.5. Transportation

            12.5.5.1. Airport/Train Stations

            12.5.5.2. Parking Structures/Underground/ Tunnels

        12.5.6. Government

        12.5.7. Industrial

        12.5.8. Stadiums and Arenas

        12.5.9. Others

    12.6. Market Size (US$ Million) Forecast by Country/Sub-region, 2016 to 2032

        12.6.1. UAE

        12.6.2. Saudi Arabia

        12.6.3. South Africa

        12.6.4. Rest of MEA

    12.7. Market Attractiveness Analysis

        12.7.1. by Country

        12.7.2. by Component

        12.7.3. by Technology

        12.7.4. by End-user

13. South America Market Analysis and Forecast

    13.1. Key Findings

    13.2. Key Trends

    13.3. Market Size (US$ Million) Forecast by Component, 2016 to 2032

        13.3.1. Hardware

            13.3.1.1. Active

                13.3.1.1.1. Head-end, and Remotes

                13.3.1.1.2. Trays

                13.3.1.1.3. Antennas

                13.3.1.1.4. Others

            13.3.1.2. Passive

                13.3.1.2.1. Donor Antennas

                13.3.1.2.2. Trays

                13.3.1.2.3. Repeaters

                13.3.1.2.4. Others

            13.3.1.3. Cabling

                13.3.1.3.1. Coaxial

                13.3.1.3.2. Optical Fiber

                13.3.1.3.3. CAT5

                13.3.1.3.4. Others

            13.3.1.4. Hybrid

                13.3.1.4.1. Head-end, and Remotes

                13.3.1.4.2. Repeaters

        13.3.2. Service

            13.3.2.1. Design and Installation

            13.3.2.2. Maintenance

    13.4. Market Size (US$ Million) Forecast by Technology, 2016 to 2032

        13.4.1. Cellular/Commercial DAS

        13.4.2. Public Safety DAS

    13.5. Market Size (US$ Million) Forecast by End-user, 2016 to 2032

        13.5.1. Offices/Corporate Campus

        13.5.2. Hospitality

            13.5.2.1. Hotels/Resorts

            13.5.2.2. Retail/Shopping Malls

        13.5.3. Health Care

        13.5.4. Education

        13.5.5. Transportation

            13.5.5.1. Airport/Train Stations

            13.5.5.2. Parking Structures/Underground/ Tunnels

        13.5.6. Government

        13.5.7. Industrial

        13.5.8. Stadiums and Arenas

        13.5.9. Others

    13.6. Market Size (US$ Million) Forecast by Country/Sub-region, 2016 to 2032

        13.6.1. Brazil

        13.6.2. Rest of South America

    13.7. Market Attractiveness Analysis

        13.7.1. by Country

        13.7.2. by Component

        13.7.3. by Technology

        13.7.4. by End-user

14. Competition Landscape

    14.1. Market Player - Competition Matrix

    14.2. Market Share Analysis by Company (2022)

    14.3. Company Profiles (Details - Overview, Financials, SWOT Analysis, Strategy)

        14.3.1. American Tower Corporation

            14.3.1.1. Market Presence, by Segment and Geography

            14.3.1.2. Revenue and Operating Profits

            14.3.1.3. Strategy and Historical Roadmap

            14.3.1.4. SWOT Analysis

        14.3.2. AT&T Inc.

            14.3.2.1. Market Presence, by Segment and Geography

            14.3.2.2. Revenue and Operating Profits

            14.3.2.3. Strategy and Historical Roadmap

            14.3.2.4. SWOT Analysis

        14.3.3. Bird Technologies

            14.3.3.1. Market Presence, by Segment and Geography

            14.3.3.2. Revenue and Operating Profits

            14.3.3.3. Strategy and Historical Roadmap

            14.3.3.4. SWOT Analysis

        14.3.4. Boingo Wireless, Inc.

            14.3.4.1. Market Presence, by Segment and Geography

            14.3.4.2. Revenue and Operating Profits

            14.3.4.3. Strategy and Historical Roadmap

            14.3.4.4. SWOT Analysis

        14.3.5. Cobham Wireless

            14.3.5.1. Market Presence, by Segment and Geography

            14.3.5.2. Revenue and Operating Profits

            14.3.5.3. Strategy and Historical Roadmap

            14.3.5.4. SWOT Analysis

        14.3.6. CommScope Inc.

            14.3.6.1. Market Presence, by Segment and Geography

            14.3.6.2. Revenue and Operating Profits

            14.3.6.3. Strategy and Historical Roadmap

            14.3.6.4. SWOT Analysis

        14.3.7. Corning Incorporated

            14.3.7.1. Market Presence, by Segment and Geography

            14.3.7.2. Revenue and Operating Profits

            14.3.7.3. Strategy and Historical Roadmap

            14.3.7.4. SWOT Analysis

        14.3.8. Dali Wireless

            14.3.8.1. Market Presence, by Segment and Geography

            14.3.8.2. Revenue and Operating Profits

            14.3.8.3. Strategy and Historical Roadmap

            14.3.8.4. SWOT Analysis

        14.3.9. SOLiD, Inc.

            14.3.9.1. Market Presence, by Segment and Geography

            14.3.9.2. Revenue and Operating Profits

            14.3.9.3. Strategy and Historical Roadmap

            14.3.9.4. SWOT Analysis

        14.3.10. TESSCO Technologies, Inc.

            14.3.10.1. Market Presence, by Segment and Geography

            14.3.10.2. Revenue and Operating Profits

            14.3.10.3. Strategy and Historical Roadmap

            14.3.10.4. SWOT Analysis

15. Key Takeaways

Don't pay for what you don't need

Customize your report by selecting specific countries or regions and save 30%!

List of Tables

Table 1: Global Market Size and Forecast, by Component, 2016 to 2032 (US$ Million)

Table 2: Global Market Size and Forecast, by Hardware, 2016 to 2032 (US$ Million)

Table 3: Global Market Size and Forecast, by Hardware, by Active DAS, 2016 to 2032 (US$ Million)

Table 4: Global Market Size and Forecast, by Hardware, by Passive DAS, 2016 to 2032 (US$ Million)

Table 5: Global Market Size and Forecast, by Hardware, by Cabling, 2016 to 2032 (US$ Million)

Table 6: Global Market Size and Forecast, by Hardware, Hybrid DAS, 2016 to 2032 (US$ Million)

Table 7: Global Market Size and Forecast, by Services, 2016 to 2032 (US$ Million)

Table 8: Global Market Size and Forecast, by Technology, 2016 to 2032 (US$ Million)

Table 9: Global Market Size and Forecast, by End-user, 2016 to 2032 (US$ Million)

Table 10: Global Market Size and Forecast, by End-user, by Hospitality, 2016 to 2032 (US$ Million)

Table 11: Global Market Size and Forecast, by End-user, by Transportation, 2016 to 2032 (US$ Million)

Table 12: Global Market Size and Forecast, by Region, 2016 to 2032 (US$ Million)

Table 13: North America Market Size and Forecast, by Component, 2016 to 2032 (US$ Million)

Table 14: North America Market Size and Forecast, by Hardware, 2016 to 2032 (US$ Million)

Table 15: North America Market Size and Forecast, by Hardware, by Active DAS, 2016 to 2032 (US$ Million)

Table 16: North America Market Size and Forecast, by Hardware, by Passive DAS, 2016 to 2032 (US$ Million)

Table 17: North America Market Size and Forecast, by Hardware, by Hybrid DAS, 2016 to 2032(US$ Million)

Table 18: North America Market Size and Forecast, by Hardware, by Hybrid, 2016 to 2032 (US$ Million)

Table 19: North America Market Size and Forecast, by Services, 2016 to 2032 (US$ Million)

Table 20: North America Market Size and Forecast, by Technology, 2016 to 2032 (US$ Million)

Table 21: North America Market Size and Forecast, by End-user, 2016 to 2032 (US$ Million)

Table 22: North America Market Size and Forecast, by End-user, by Hospitality, 2016 to 2032 (US$ Million)

Table 23: North America Market Size and Forecast, by End-user, by Transportation, 2016 to 2032 (US$ Million)

Table 24: North America Market Size and Forecast, by Country, 2016 to 2032 (US$ Million)

Table 25: Europe Market Size and Forecast, by Component, 2016 to 2032 (US$ Million)

Table 26: Europe Market Size and Forecast, by Hardware, 2016 to 2032 (US$ Million)

Table 27: Europe Market Size and Forecast, by Hardware, by Active DAS, 2016 to 2032 (US$ Million)

Table 28: Europe Market Size and Forecast, by Hardware, by Passive DAS, 2016 to 2032 (US$ Million)

Table 29: Europe Market Size and Forecast, by Hardware, by Cabling, 2016 to 2032 (US$ Million)

Table 30: Europe Market Size and Forecast, by Hardware, by Hybrid, 2016 to 2032 (US$ Million)

Table 31: Europe Market Size and Forecast, by Services, 2016 to 2032 (US$ Million)

Table 32: Europe Market Size and Forecast, by Technology, 2016 to 2032 (US$ Million)

Table 33: Europe Market Size and Forecast, by End-user, 2016 to 2032 (US$ Million)

Table 34: Europe Market Size and Forecast, by End-user, by Hospitality, 2016 to 2032 (US$ Million)

Table 35: Europe Market Size and Forecast, by End-user, by Transportation, 2016 to 2032 (US$ Million)

Table 36: Europe Market Size and Forecast, by Country, 2016 to 2032 (US$ Million)

Table 37: Asia Pacific Market Size and Forecast, by Component, 2016 to 2032 (US$ Million)

Table 38: Asia Pacific Market Size and Forecast, by Hardware, 2016 to 2032 (US$ Million)

Table 39: Asia Pacific Market Size and Forecast, by Hardware, by Active DAS, 2016 to 2032 (US$ Million)

Table 40: Asia Pacific Market Size and Forecast, by Hardware, by Passive DAS, 2016 to 2032 (US$ Million)

Table 41: Asia Pacific Market Size and Forecast, by Hardware, by Cabling, 2016 to 2032 (US$ Million)

Table 42: Asia Pacific Market Size and Forecast, by Hardware, by Hybrid, 2016 to 2032 (US$ Million)

Table 43: Asia Pacific Market Size and Forecast, by Services, 2016 to 2032 (US$ Million)

Table 44: Asia Pacific Market Size and Forecast, by Technology, 2016 to 2032 (US$ Million)

Table 45: Asia Pacific Market Size and Forecast, by End-user, 2016 to 2032 (US$ Million)

Table 46: Asia Pacific Market Size and Forecast, by End-user, by Hospitality, 2016 to 2032 (US$ Million)

Table 47: Asia Pacific Market Size and Forecast, by End-user, by Transportation, 2016 to 2032 (US$ Million)

Table 48: Asia Pacific Market Size and Forecast, by Country, 2016 to 2032 (US$ Million)

Table 49: MEA Market Size and Forecast, by Component, 2016 to 2032 (US$ Million)

Table 50: MEA Market Size and Forecast, by Hardware, 2016 to 2032 (US$ Million)

Table 51: MEA Market Size and Forecast, by Hardware, by Active DAS, 2016 to 2032 (US$ Million)

Table 52: MEA Market Size and Forecast, by Hardware, by Passive DAS, 2016 to 2032 (US$ Million)

Table 53: MEA Market Size and Forecast, by Hardware, by Cabling, 2016 to 2032 (US$ Million)

Table 54: MEA Market Size and Forecast, by Hardware, by Hybrid, 2016 to 2032 (US$ Million)

Table 55: MEA Market Size and Forecast, by Services, 2016 to 2032 (US$ Million)

Table 56: MEA Market Size and Forecast, by Technology, 2016 to 2032 (US$ Million)

Table 57: MEA Market Size and Forecast, by End-user, 2016 to 2032 (US$ Million)

Table 58: MEA Market Size and Forecast, by End-user, by Hospitality, 2016 to 2032 (US$ Million)

Table 59: MEA Market Size and Forecast, by End-user, by Transportation, 2016 to 2032 (US$ Million)

Table 60: MEA Market Size and Forecast, by Country, 2016 to 2032 (US$ Million)

Table 61: South America Market Size and Forecast, by Component, 2016 to 2032 (US$ Million)

Table 62: South America Market Size and Forecast, by Hardware, 2016 to 2032 (US$ Million)

Table 63: South America Market Size and Forecast, by Hardware, by Active DAS, 2016 to 2032 (US$ Million)

Table 64: South America Market Size and Forecast, by Hardware, by Passive DAS, 2016 to 2032 (US$ Million)

Table 65: South America Market Size and Forecast, by Hardware, by Cabling, 2016 to 2032 (US$ Million)

Table 66: South America Market Size and Forecast, by Hardware, by Hybrid, 2016 to 2032 (US$ Million)

Table 67: South America Market Size and Forecast, by Services, 2016 to 2032 (US$ Million)

Table 68: South America Market Size and Forecast, by Technology, 2016 to 2032 (US$ Million)

Table 69: South America Market Size and Forecast, by End-user, 2016 to 2032 (US$ Million)

Table 70: South America Market Size and Forecast, by End-user, by Hospitality, 2016 to 2032 (US$ Million)

Table 71: South America Market Size and Forecast, by End-user, by Transportation,2016 to 2032 (US$ Million)

Table 72: South America Market Size and Forecast, by Country, 2016 to 2032 (US$ Million)
Sudip Saha
Sudip Saha

Principal Consultant

Talk to Analyst

Find your sweet spots for generating winning opportunities in this market.

List of Charts

Figure 1: Global Market Analysis and Forecast (US$ Million), 2016 to 2032

Figure 2: Global Market Y-o-Y Growth (Value %) Forecast, 2016 to 2032

Figure 3: Global Market Value Share, by End-user, 2022

Figure 4: Global Market Value Share, by Component, 2022

Figure 5: Global Market Value Share, by Technology, 2022

Figure 6: Global Market Value Share Analysis, by Component, 2022 and 2032

Figure 7: Global Market Value Share Analysis, by Hardware

Figure 8: Global Market Value Share Analysis, by Services

Figure 9: Global Market Value Share Analysis, by Hardware, 2022 and 2032

Figure 10: Global Market Value Share Analysis, by Hardware, by Active DAS, 2022 and 2032

Figure 11: Global Market Value Share Analysis, by Hardware, by Passive DAS, 2022 and 2032

Figure 12: Global Market Value Share Analysis, by Hardware, by Cabling, 2022 and 2032

Figure 13: Global Market Value Share Analysis, by Hardware, by Hybrid DAS, 2022 and 2032

Figure 14: Global Market Value Share Analysis, by Services, 2022 and 2032

Figure 15: Global Market Value Share Analysis, by Design & Installation Services

Figure 16: Global Market Value Share Analysis, by Maintenance Services

Figure 17: Global Comparison Matrix, by Component

Figure 18: Global Market Attractiveness Analysis, by Hardware

Figure 19: Global Market Attractiveness Analysis, by Services

Figure 20: Global Market Value Share Analysis, by Technology, 2022 and 2032

Figure 21: Global Market Value Share Analysis, by Cellular/Commercial DAS

Figure 22: Global Market Value Share Analysis, by Public Safety

Figure 23: Global Comparison Matrix, by Technology

Figure 24: Global Market Attractiveness Analysis, by Technology

Figure 25: Global Market Value Share Analysis, by End-user, 2022 and 2032

Figure 26: Global Market Value Share Analysis, by Offices/Corporate Campus

Figure 27: Global Market Value Share Analysis, by Hospitality

Figure 28: Global Market Value Share Analysis, by Healthcare

Figure 29: Global Market Value Share Analysis, by Education

Figure 30: Global Market Value Share Analysis, by Transportation

Figure 31: Global Market Value Share Analysis, by Government

Figure 32: Global Market Value Share Analysis, by Industrial

Figure 33: Global Market Value Share Analysis, by Stadiums and Arenas

Figure 34: Global Market Value Share Analysis, by Others

Figure 35: Global Market Value Share Analysis, by End-user, by Hospitality, 2022 and 2032

Figure 36: Global Market Value Share Analysis, by End-user, by Transportation, 2022 and 2032

Figure 37: Global Comparison Matrix by End-user

Figure 38: Global Market Attractiveness Analysis, by End-user

Figure 39: Global Market Value Share Analysis, by Region, 2022 and 2032

Figure 40: Global Market Attractiveness Analysis, by Region

Figure 41: North America Market Analysis and Forecast (US$ Million), 2016 to 2032

Figure 42: North America Market Value Share Analysis, by Component, 2022 and 2032

Figure 43: North America Market Value Share Analysis, by Hardware, 2022 and 2032

Figure 44: North America Market Value Share Analysis, by Hardware, by Active DAS, 2022 and 2032

Figure 45: North America Market Value Share Analysis, by Hardware, by Passive DAS, 2022 and 2032

Figure 46: North America Market Value Share Analysis, by Hardware, by Cabling, 2022 and 2032

Figure 47: North America Market Value Share Analysis, by Hardware, by Hybrid DAS, 2022 and 2032

Figure 48: North America Market Value Share Analysis, by Services, 2022 and 2032

Figure 49: North America Market Value Share Analysis, by Technology, 2022 and 2032

Figure 50: North America Market Value Share Analysis, by End-user, 2022 and 2032

Figure 51: North America Market Value Share Analysis, by End-user, by Hospitality, 2022 and 2032

Figure 52: North America Market Value Share Analysis, by End-user, by Transportation, 2022 and 2032

Figure 53: North America Market Value Share Analysis, by Country, 2022 and 2032

Figure 54: North America Market Attractiveness Analysis, by Hardware

Figure 55: North America Market Attractiveness Analysis, by Services

Figure 56: North America Market Attractiveness Analysis, by End-user

Figure 57: North America Market Attractiveness Analysis, by Country

Figure 58: Europe Market Analysis and Forecast (US$ Million), 2016 to 2032

Figure 59: Europe Market Value Share Analysis, by Component, 2022 and 2032

Figure 60: Europe Market Value Share Analysis, by Hardware, 2022 and 2032

Figure 61: Europe Market Value Share Analysis, by Hardware, by Active DAS, 2022 and 2032

Figure 62: Europe Market Value Share Analysis, by Hardware, by Passive DAS, 2022 and 2032

Figure 63: Europe Market Value Share Analysis, by Hardware, by Cabling, 2022 and 2032

Figure 64: Europe Market Value Share Analysis, by Hardware, by Hybrid, 2022 and 2032

Figure 65: Europe Market Value Share Analysis, by Services, 2022 and 2032

Figure 66: Europe Market Value Share Analysis, by Technology, 2022 and 2032

Figure 67: Europe Market Value Share Analysis, by End-user, 2022 and 2032

Figure 68: Europe Market Value Share Analysis, by End-user, by Hospitality, 2022 and 2032

Figure 69: Europe Market Value Share Analysis, by End-user, by Transportation, 2022 and 2032

Figure 70: Europe Market Value Share Analysis, by Country, 2022 and 2032

Figure 71: Europe Market Attractiveness Analysis, by Hardware

Figure 72: Europe Market Attractiveness Analysis, by Services

Figure 73: Europe Market Attractiveness Analysis, by End-user

Figure 74: Europe Market Attractiveness Analysis, by Country

Figure 75: Asia Pacific Market Analysis and Forecast (US$ Million), 2016 to 2032

Figure 76: Asia Pacific Market Value Share Analysis, by Component, 2022 and 2032

Figure 77: Asia Pacific Market Value Share Analysis, by Hardware, 2022 and 2032

Figure 78: Asia Pacific Market Value Share Analysis, by Hardware, by Active DAS, 2022 and 2032

Figure 79: Asia Pacific Market Value Share Analysis, by Hardware, by Passive DAS, 2022 and 2032

Figure 80: Asia Pacific Market Value Share Analysis, by Hardware, by Cabling, 2022 and 2032

Figure 81: Asia Pacific Market Value Share Analysis, by Hardware, by Hybrid, 2022 and 2032

Figure 82: Asia Pacific Market Value Share Analysis, by Services, 2022 and 2032

Figure 83: Asia Pacific Market Value Share Analysis, by Technology, 2022 and 2032

Figure 84: Asia Pacific Market Value Share Analysis, by End-user, 2022 and 2032

Figure 85: Asia Pacific Market Value Share Analysis, by End-user, by Hospitality, 2022 and 2032

Figure 86: Asia Pacific Market Value Share Analysis, by End-user, by Transportation, 2022 and2032

Figure 87: Asia Pacific Market Value Share Analysis, by Country, 2022 and 2032

Figure 88: Asia Pacific Market Attractiveness Analysis, by Hardware

Figure 89: Asia Pacific Market Attractiveness Analysis, by End-user

Figure 90: Asia Pacific Market Attractiveness Analysis, by Services

Figure 91: Asia Pacific Market Attractiveness Analysis, by Country

Figure 92: MEA Market Analysis and Forecast (US$ Million), 2016 to 2032

Figure 93: MEA Market Value Share Analysis, by Component, 2022 and 2032

Figure 94: MEA Market Value Share Analysis, by Hardware, 2022 and 2032

Figure 95: MEA Market Value Share Analysis, by Hardware, by Active DAS, 2022 and 2032

Figure 96: MEA Market Value Share Analysis, by Hardware, by Passive DAS, 2022 and 2032

Figure 97: MEA Market Value Share Analysis, by Hardware, by Cabling, 2022 and 2032

Figure 98: MEA Market Value Share Analysis, by Hardware, by Hybrid, 2022 and 2032

Figure 99: MEA Market Value Share Analysis, by Services, 2022 and 2032

Figure 100: MEA Market Value Share Analysis, by Technology, 2022 and 2032

Figure 101: MEA Market Value Share Analysis, by End-user, 2022 and 2032

Figure 102: MEA Market Value Share Analysis, by End-user, by Hospitality, 2022 and 2032

Figure 103: MEA Market Value Share Analysis, by End-user, by Transportation, 2022 and 2032

Figure 104: MEA Market Value Share Analysis, by Country, 2022 and 2032

Figure 105: MEA Market Attractiveness Analysis, by Hardware

Figure 106: MEA Market Attractiveness Analysis, by Services

Figure 107: MEA Market Attractiveness Analysis, by End-user

Figure 108: MEA Market Attractiveness Analysis, by Country

Figure 109: South America Market Analysis and Forecast (US$ Million), 2016 to 2032

Figure 110: South America Market Value Share Analysis, by Component, 2022 and 2032

Figure 111: South America Market Value Share Analysis, by Hardware, 2022 and 2032

Figure 112: South America Market Value Share Analysis, by Hardware, by Active DAS, 2022 and 2032

Figure 113: South America Market Value Share Analysis, by Hardware, by Passive DAS, 2022 and 2032

Figure 114: South America Market Value Share Analysis, by Hardware, by Cabling, 2022 and 2032

Figure 115: South America Market Value Share Analysis, by Hardware, by Hybrid, 2022 and 2032

Figure 116: South America Market Value Share Analysis, by Services, 2022 and 2032

Figure 117: South America Market Value Share Analysis, by Technology, 2022 and 2032

Figure 118: South America Market Value Share Analysis, by End-user, 2022 and 2032

Figure 119: South America Market Value Share Analysis, by End-user, by Hospitality, 2022 and 2032

Figure 120: South America Market Value Share Analysis, by End-user, by Transportation, 2022 and 2032

Figure 121: South America Market Value Share Analysis, by Country, 2022 and 2032

Figure 122: South America Market Attractiveness Analysis, by Hardware

Figure 123: South America Market Attractiveness Analysis, by Services

Figure 124: South America Market Attractiveness Analysis, by End-user

Figure 125: South America Market Attractiveness Analysis, by Country

Recommendations

Technology

Base Station Antenna Market

Published : January 2024

Technology

Wireless Antenna Market

Published : October 2022

Technology

Advanced Distribution Management Systems Market

Published : October 2022

Explore Technology Insights

View Reports

Distributed Antenna Systems Market