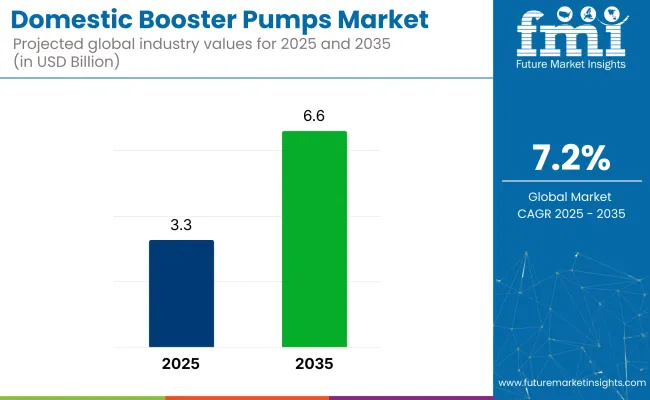
The domestic booster pumps market is anticipated to grow, with an approximate industry value of USD 3.3 billion in 2025 that will grow up to approximately USD 6.6 billion by 2035 at a CAGR of 7.2%. The expansion occurs due to the rise in urbanization, construction of homes, and the need for constant pressure of water.
The systems provide uniform supply of water for bathing, washing, cooking, and other daily uses at home-enhancing general living comfort. Growing water shortage and unreliable supply in most urban centers have also fueled reliance on water storage tanks. Booster pumps are used to draw water from ground or overhead tanks and disperse it in equal measure among fixtures and appliances making them a key part of the urban domestic infrastructure.
Energy efficiency is taking the limelight. Customers in areas with high tariff electricity or regular power outages are turning to solar-friendly, inverter-compatible booster pumps. These solutions bring in improved reliability and greenness-beneficial in off-grid or remote locations. Opportunities for growth are in replacement and retrofit industries, as old residential neighborhoods install new plumbing infrastructure. Corrosion-resistant, low-noise, and small models are capturing the industry space in high-end residences and intelligent homes in North America and Europe.
Online shopping and electronic commerce are in the vanguard of industry coverage expansion. Increasingly, buyers are buying booster pumps online by means of product selection, consumer feedback, and step-by-step photographically illustrated instructions for installation-especially in DIY industries.
Home booster pumps are becoming an everyday necessity of modern times that handles water pressure-related problems in the developed and emerging world. As infrastructure gets better and people invest in smarter homes, the demand will rise depending on reliability, innovation, and water conservation.
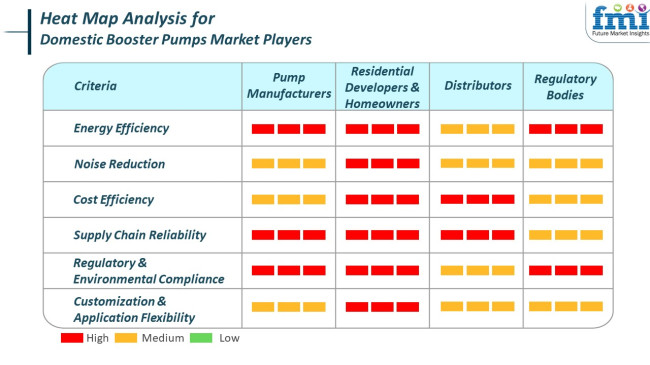
The industry is witnessing strong growth due to growing urbanization, increasing residential construction, and the requirement for constant water pressure in multistory buildings. Booster pumps are crucial in providing a steady supply of water for new residential complexes, particularly in high-rise buildings where water pressure is lost.
Pump manufacturers focus on developing cost-effective and space-efficient solutions that address the evolving needs of city dwellings. Technologies such as sensor-based smart pumps with connectivity features are enhancing pump performance, energy efficiency, and dependability. Regulatory agencies impose compliance with environmental and safety regulations, compelling the use of green and sustainable booster pump technologies.
They are instrumental in influencing the industry through enacting regulations that promote the utilisation of green technologies and minimize the environmental impact of residential operations. The global industry is dominated by the concerted effort between stakeholders to formulate and use products that are high on performance requirements, adhere to environmental regulations, and respond to changing residential needs.
Between 2020 and 2024, the industry had continuous growth, paced by the rise in demand for water pressure optimization within residential structures. Between the same years, concern for the conservation of water and the need for effective distribution of water within homes, especially where there is an unreliable supply of water pressure, was increasing.
In advanced economies, for instance, in North America and Europe, technologies such as smart pumps incorporating IoT connectivity picked up pace. The pumps, for instance, that can be monitored and controlled remotely became a major differentiator, increasing convenience and water management.
In the coming years to 2025 to 2035, the industry is expected to see significant growth based on increased urbanization and rising water scarcity issues. Asia-Pacific, the Middle East, and Africa, which experience water infrastructure shortcomings, will register high adoption rates of booster pumps.
In addition, the application of AI-driven smart technologies coupled with the growth trend of smart homes will compel the industry toward sophisticated solutions that optimize pressure on water dependent on consumption trends, energy consumption, and sustainability objectives. The next decade will also likely witness the emergence of solar-powered booster pumps, playing its part in the world's embrace of renewable power.
Comparative Market Shift Analysis (2020 to 2024 vs. 2025 to 2035)
| 2020 to 2024 | 2025 to 2035 |
|---|---|
| Growing demand for water pressure optimization in residential properties, with emphasis on efficiency and sustainability | Growing urbanization, water shortage conditions, and rising adoption of smart home technologies fueling demand for sophisticated pumps |
| IoT pumps, smart metering, and energy saving systems for domestic use | Predictive analytics using AI, solar-powered units, and home automation system integration to enhance water consumption |
| High upfront costs of smart pumps, sluggish adoption in emerging economies, and energy consumption issues | Regulatory issues, expense of sophisticated technology, and necessity for improved infrastructure to accommodate new technologies |
| Expansion in North America, Europe, and some regions of the Middle East | Widespread adoption in developing economies in Asia-Pacific, the Middle East, and Africa, as well as in developed regions |
| Emphasis on energy efficiency standards and water conservation in developed countries | Tighter water usage regulations and increasing utilization of alternative energy sources for residential pumps in developing economies |
| Smart pump and monitoring solution adoption in high-demand residential neighborhoods | Smart home ecosystems integration, solar-based solutions, and AI-based water pressure optimization solutions |
Domestic booster pumps consume a lot of power to perform optimally, which translates to high electricity costs for consumers and increased environmental impact. This level of energy usage can discourage adoption, particularly in areas with high energy prices.
Technical problems like pump coagulation, air entrapment, faulty components, and poor suction capacity can impede the functioning of domestic booster pumps. These issues might prompt users to use commercial-grade pumps, which are stronger but also costlier, impacting the industry for domestic versions.
Operational noise and vibration are significant issues, especially for residential areas with quiet environments. The disturbing noise levels can cause customer dissatisfaction and restrict the deployment of such pumps in noise-sensitive environments, hence hampering industry growth.
Supply chain disruptions such as transport delays and geopolitical tensions can hold up the delivery of components and finished goods. Delays would result in production shut downs and pent-up customer demand, adversely affecting business and sales in the long run.
Applicability to large industries such as residential construction would mean that downturns in these industries would directly affect domestic booster pump demand. This risk can be mitigated by diversifying customer base across various applications.
In general, the domestic booster pumps industry is underpinned by high energy use, technological complexities, noise, supply chain disruptions, and economic recessions specific to the industry. Countermeasures taken ahead of time to combat these are essential to sustaining growth and competitiveness in this dynamic industry.
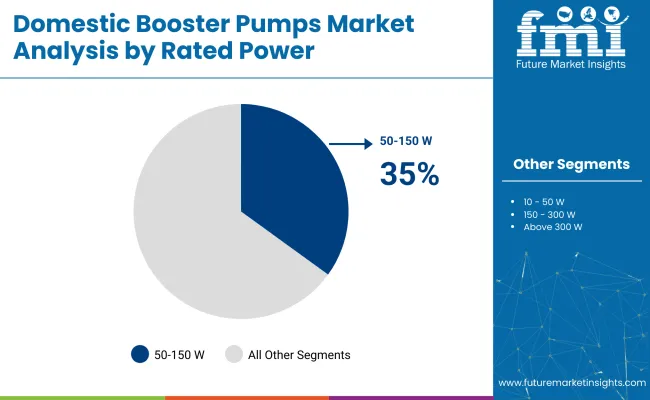
In the year 2025, the domestic booster pumps pertaining to the rated power 50-150 W are expected to dominate this sector with an anticipated contribution of 35% to the industry share. The segment rated 150-300 W comes next with a projected share of 30%. These power ranges are critical to providing efficient water pressure solutions for domestic applications to keep water flowing smoothly in houses and smaller commercial units.
50-150 W is thus highly favored for its energy-efficient nature, balanced with enough output for normal domestic needs. These pumps are best suited for small houses, apartments, or low water-pressure areas. Grundfos and WILO are the key players in this segment, and they have low-cost yet high-performance models.
Examples are the MQ3-35 of Grundfos and Star-RS pumps of WILO, which are compact, easy to install, and have reliable performance for different residential applications. Therefore, these pumps are quite attractive to end-users who seek a cost-effective solution for boosting water pressure in the small-scale application of domestic work.
150-300 W expects much higher demand for medium-scale homes or properties with greater water consumption. This segment is preferred mainly in areas where water pressure fluctuations are most dominant or larger homes demand higher flow rates. Well-designed pumps would enable an outlet to allow for concurrent water use while not failing.
The KSB Group and Xylem companies present solutions through KSB's Etanorm and Xylem's Goulds Pumps, which really target residential consumption of water. These types of pumps are specifically designed to give superior flow rates, thus making it possible to run the typical modern home wherein some appliances and fixtures operate simultaneously.
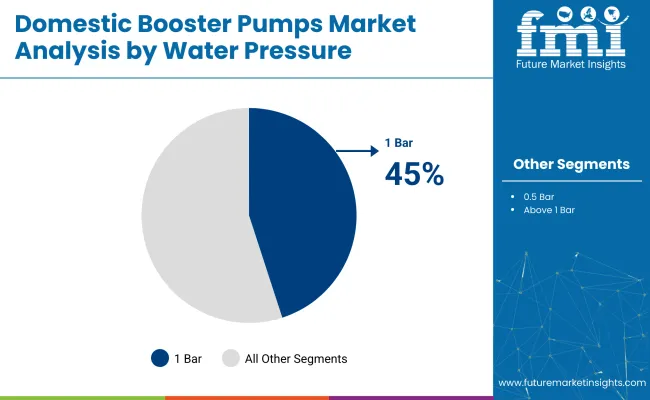
In 2025, the expected share of the industry, under the water pressure category of 1 Bar, is expected to position itself as a major influence, with an estimated 45% of the total industry share. Next is the segment Above 1 Bar, which is anticipated to hold 35% of the industry share. These two segments play a crucial role in fulfilling varying requirements for water pressure in residential buildings.
Also, it largely caters to areas like residential applications within a wide range, giving medium boost water pressure that is most suitable for smaller homes or buildings that have water supply systems of relatively stable flow. These pumps mainly provide an adequate flow of water to ensure steady functioning in low-pressure situations. Leading companies like Grundfos and WILO offer models like Grundfos SCALA2 and WILO Stratos to address such concerns with energy-saving ratings, easy installation, and the ability to maintain ideal pressure for domestic situations where water pressure is less.
The Above 1 Bar segment is coming up because, unlike the traditional pumps, it addresses the pressure requirements in areas with significant pressure drops or increased water requirements. These pumps produce increased output pressure, ideally suited for larger households, multi-storeyed buildings, or commercial-type properties that require substantial amounts of water to address the simultaneous demands of numerous fixtures and appliances.
Companies such as KSB Group and Xylem have launched KSB's Multitec and Xylem's Pentair, respectively, with this focus on reliable and high-performance pumps designed to increase water pressure for larger-scale residential or commercial applications greatly.
Some of the major driving factors behind the industry growth are urbanization, increasing demand for water-saving efforts, and the shift toward smart home integration. In the next few years, with the advancement in technology, further developments would be expected toward sophisticated systems capable of automatically optimizing water pressure, fueling further industry growth.
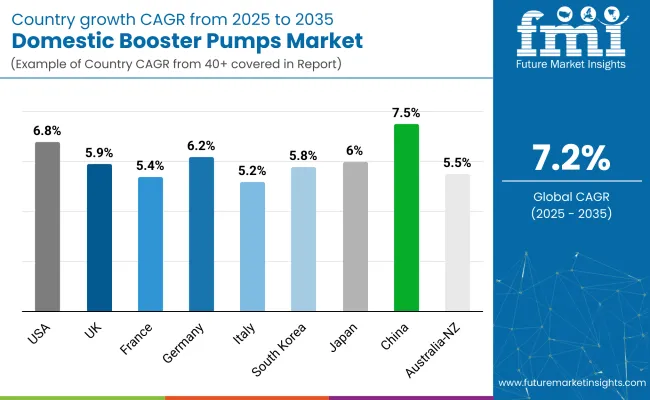
| Countries | CAGR (2025 to 2035) |
|---|---|
| USA | 6.8% |
| UK | 5.9% |
| France | 5.4% |
| Germany | 6.2% |
| Italy | 5.2% |
| South Korea | 5.8% |
| Japan | 6 % |
| China | 7.5% |
| Australia-NZ | 5.5% |
The USA industry will develop at 6.8% CAGR during the study period. The USA industry is expanding steadily due to the growing demand for stable water pressure in residential houses. With the increasing construction of multi-story buildings and townhouses, particularly in cities, the demand for efficient water pressure management has risen.
Apart from this, growing applications of smart water management systems in residential applications are fueling the uptake of intelligent booster pump technologies. The transition towards energy-efficient systems and government policies on water conservation are also fueling the uptake of advanced booster solutions. Improved living standards and consumer awareness regarding smart home upgrades are fueling demand for automated and noise-free booster pumps.
Manufacturers in the USA are investing in innovation to offer compact, maintenance-free systems suited for modern homes. Retrofit activities in older residential buildings are another factor boosting demand. Moreover, the availability of financial incentives for energy-efficient appliances is accelerating product replacement cycles. With increased urbanization and aging water infrastructure in some regions, domestic booster pump systems are becoming critical for maintaining reliable water flow.
The UK industry is expected to progress at 5.9% CAGR during the research period. Urban density increases and the increase in old building infrastructure in the UK are significant drivers for the industry.
Most residential homes in the UK suffer from uneven water pressure due to old municipal systems, leading to increased home booster system installations. In addition, the growing significance of green technologies is supporting the use of energy-efficient pumps that adhere to government protocols for resource management.
Domestic demands for sustainable water supply, even during high seasons of usage, are driving the adoption of residential booster pumps in new housing developments and retrofits. Smart city initiatives and the adoption of IoT-based home solutions are also influencing the industry.
British pump manufacturers are stressing silent-running ability and streamlined design to appeal to city-dwelling homeowners. Moreover, increased government favorability towards higher levels of home energy efficiency will help fuel additional expansion in this sector.
The French industry is expected to grow at a 5.4% CAGR during the research forecast period. The industry in France is transforming due to heightened awareness in terms of water management efficiency and comfort. French residential segments are incorporating water pressure enhancement systems to fulfill modern-day lifestyle needs, especially for multi-story complex buildings. Demand is being fueled by new construction and retrofits for historic buildings, which typically have outdated plumbing.
Government initiatives promoting domestic appliance energy efficiency and water conservation are influencing consumer behavior toward the installation of intelligent booster technology. The industry response has been to innovate with technologies like quiet operation, remote monitoring, and energy-efficient capabilities.
In areas of low water supply or infrastructure issues, booster systems are becoming a necessity for home upgrades. The shift toward smart homes and growing consumer interest in living sustainably will remain the prime drivers of industry expansion.
The German industry is expected to grow at 6.2% CAGR during the period of the study. Germany's industry is fueled by technological advancements in smart homes and a strong focus on environmental sustainability. German residences are famous for their focus on energy efficiency, and new booster pumps with high energy efficiency are gaining popularity. The growing requirement for consistent water pressure in residential apartments and multi-dwelling households also fuels the industry.
Urbanization and modernization of existing housing stock are the most important drivers for the increase in installations. Customers increasingly require booster pumps with automation functions and quiet operation. Additionally, Germany's mature plumbing infrastructure and technical competence provide the foundation for sophisticated system integration. As the awareness of water conservation increases, domestic booster pumps with variable speed technology and smart controls are becoming common to meet demand while saving resources.
The Italian industry is anticipated to register a CAGR of 5.2% over the study period. The Italian industry is experiencing steady demand driven by water pressure irregularities in residences, especially in hilly city locations and old buildings. Increased consumer demand for reliable and efficient home water systems is propelling the use of advanced booster technologies. The increased popularity of multi-story residential complexes is also driving the adoption of such systems.
With more Italian homeowners choosing home upgrades and new equipment, demand is growing for smart water-boosting systems. Compatibility with home automation is a much sought-after feature in the industry. EU energy regulations also push manufacturers to offer efficient, sustainable systems in line with environmental standards. Overall, the industry is experiencing a rejuvenating housing industry along with an increased focus on water resource management.
The South Korean industry will expand at 5.8% CAGR during the study period. South Korea's industry is being fueled by its highly urbanized environment and rapid growth of high-rise residential developments. Uniform water pressure is needed in high-density urban city settings, and home booster pumps provide a reliable solution for smart homes and contemporary apartments.
Increased automation and IoT integration are improving the performance and user interface of such systems. There is growing consumer interest in small, quiet, and efficient booster pumps, especially in technologically sophisticated cities such as Seoul and Busan. The government's initiative towards green building codes and environmentally friendly urban growth is developing in tandem with industry demand.
Suppliers are responding with products that feature low energy usage and electronic controls. With more and more homes being equipped with high-performance appliances that require constant water pressure, the utilization of domestic booster systems will increase.
Japan is anticipated to expand at 6% CAGR during the study period. Japan's industry is growing with increasing home modernization and a high emphasis on compact and efficient technology. With limited land and vertical development of homes, stable water pressure is an endemic necessity in Japanese cities. Booster pumps are being designed to meet the Japanese consumers' space constraints and efficiency needs more and more.
The focus on domestic convenience and technology compatibility is leading to the installation of smart water pressure systems. Japanese companies are making product development centric on reliability, energy efficiency, and nearly silent operation. Further, upgrading of home technologies on an ongoing basis and consumer preference towards green products are influencing industry trends. Aging infrastructure in some locations is also propelling the installation of booster systems for round-the-clock supply.
The Chinese industry will continue to grow at a 7.5% CAGR over the study period. China's industry is witnessing rapid expansion on the back of urbanization, high-rise buildings, and an improved standard of living. Increasing residential infrastructure, especially in Tier 1 and Tier 2 cities, is driving the demand for efficient water pressure systems. Inadequate municipal water supply in specific developing industries is further driving demand for domestic booster solutions.
Technological upgrades are a key characteristic of the Chinese industry, as manufacturers provide IoT-enabled, automatic, and power-saving booster pump sets. Energy-saving policies at the national level and enhanced consumer awareness also influence buying habits. Local brands are gaining traction with aggressive pricing and strong distribution networks, while foreign players provide premium and smart home-attached solutions. Convergence with digital surveillance and AI is ready to govern industry growth further.
Australia-NZ industry will achieve a 5.5% CAGR between the study periods. The industry for domestic booster pumps in the Australian and New Zealand regions is developing due to increased interest in water's sustainable utilization and domestic building of residences. Water-saving regulations, especially where the regions face a drought, are fueling the applications of pressure-booster systems, ensuring the utmost rate of flow in water with the least possible waste.
Residential customers are also seeking more control of water distribution systems for comfort as well as optimization of consumption utilities. Increased penetration towards residential automation and home networks is creating opportunities for applying technically superior booster pumps.
Energy efficiency and compactness are highly valued within the nation due to costly energy and environmental consciousness. Furthermore, the growing development of low- to mid-rise apartments with roof-mounted water storage facilities supports the demand for pressurizing at domestic levels. Manufacturers are focusing on supplying quiet, long-life, and fast-to-install systems suitable for the Australian and New Zealand environments.
The industry remains highly competitive, characterized by the presence of established manufacturers offering energy-efficient, smart, high-performance water pressure solutions. Key players such as Grundfos, Pentair Plc. and Xylem Inc. leverage IoT-enabled booster pumps with automated pressure control as well as real-time monitoring to gain further industry share. These firms earmark residential- small commercial- and municipal-focused applications, providing an incentive for sustainability-related water conservation.
Technological advancements in variable speed drive (VSD) pumps and the integration of AI-based monitoring systems have created a more competitive environment. KSB AG and Zoeller Company have diversified their product lines into self-priming, multistage, and inline booster pumps to accommodate fluctuating residential water pressure needs. Companies are also investing in the development of sensor-based and Wi-Fi-enabled pump systems, which would allow end users to control and optimize their water usage remotely.
Strategic alliances and regional expansion are among the industry leaders. Franklin Electric and C.R.I Pumps Private Limited are focusing on boosting their distribution network in developing regions where inconsistencies in domestic water supply have led to an increasing demand for booster systems. Key players are also working to enhance their after-sales service offers, incorporating predictive maintenance and subscription-based monitoring models to better user experience and product reliability.
New entrants and regional players like Lorentz and Honda India Power Limited are looking to solar-powered and energy-efficient booster pumps to capture niche industry segments on off-grid and low-pressure water supply applications. As environmental regulations become stricter and smart water management comes into play, companies are slated to prioritize sustainability and digitalization as a competitive edge.
Market Share Analysis by Company
| Company Name | Market Share (%) |
|---|---|
| Grundfos | 18-22% |
| Pentair Plc. | 15-19% |
| Xylem Inc. | 12-16% |
| KSB AG | 8-12% |
| Franklin Electric | 6-10% |
| Others (combined) | 30-40% |
| Company Name | Key Offerings and Activities |
|---|---|
| Grundfos | Provides IoT-enabled, energy-efficient booster pumps for residential and commercial applications. |
| Pentair Plc. | Specializes in variable-speed and smart-controlled booster pump solutions. |
| Xylem Inc. | Offers remote monitoring-enabled booster pumps with real-time diagnostics. |
| KSB AG | Focuses on multi-stage and pressure-controlled booster pump systems. |
| Franklin Electric | Develop solar-powered and high-efficiency booster pumps for sustainable water supply. |
Key Company Insights
Grundfos (18-22%)
Anindustry leader in energy-efficient, IoT-integrated booster pumps, emphasizing smart water management and sustainability to improve water pressure regulation.
Pentair Plc. (15-19%)
Pentair leads the variable-speed booster pump industry, incorporating smart sensors and AI-powered automation for maximum water flow.
Xylem Inc. (12-16%)
Xylem improves real-time monitoring and diagnostic capabilities in booster pumps, providing Wi-Fi-integrated and remotely controlled solutions.
KSB AG (8-12%)
KSB is focused on multi-stage booster pumps with self-priming technology for residential and small-scale commercial use.
Franklin Electric (6-10%)
Franklin Electric dominates solar-powered booster pump solutions for off-grid as well as energy-efficient water management applications.
Other Key Players
By rated power, the industry is segmented into different power ranges, including 10 - 50 W, 50 - 150 W, 150 - 300 W, and above 300 W.
By water pressure, the industry is categorized based on water pressure, which includes 0.5 Bar, 1 Bar, and above 1 Bar.
By application, the industry finds applications in various areas such as kitchens, bathrooms, water heater units, and gardening sprinklers & pipes.
By region, the industry is geographically distributed across North America, Latin America, Europe, Asia Pacific, and the Middle East & Africa (MEA).
The industry is projected to reach USD 3.3 billion by 2025.
Sales are expected to grow steadily, reaching USD 6.6 billion by 2035.
China is showing strong potential with an estimated CAGR of 7.5%.
The 50-150 W segment is leading the industry, as it is widely used in households for boosting water supply pressure efficiently.
Key companies include Grundfos, Pentair Plc., Xylem Inc., KSB AG, Franklin Electric, ESPA, Zoeller Company, Honda India Power Limited, IMBIL, Lorentz, and C.R.I Pumps Private Limited.


Full Research Suite comprises of:
Market outlook & trends analysis
Interviews & case studies
Strategic recommendations
Vendor profiles & capabilities analysis
5-year forecasts
8 regions and 60+ country-level data splits
Market segment data splits
12 months of continuous data updates
DELIVERED AS:
PDF EXCEL ONLINE
Domestic Food Preparation Appliances Market Size and Share Forecast Outlook 2025 to 2035
Booster Compressor Market Size and Share Forecast Outlook 2025 to 2035
SPF Boosters Market Size and Share Forecast Outlook 2025 to 2035
Hydration Boosters Market – Growth, Functional Beverages & Industry Demand
Commercial Booster Pumps Market Size and Share Forecast Outlook 2025 to 2035
Air Pressure Booster System Market Growth - Trends & Forecast 2025 to 2035
Testosterone Booster Industry Analysis by Component, Source, Distribution Channels and Regions 2025 to 2035
In-wash Scent Booster Market Size and Share Forecast Outlook 2025 to 2035
High-Pressure Booster Market Growth – Trends & Forecast 2024-2034
Hyaluronic Acid Boosters Market Analysis - Size and Share Forecast Outlook 2025 to 2035
Automotive Brake Booster and Master Cylinder Market Size and Share Forecast Outlook 2025 to 2035
Automotive Vacuum Brake Booster Market Size and Share Forecast Outlook 2025 to 2035
Pumps Market Size and Share Forecast Outlook 2025 to 2035
Pumps and Trigger Spray Market Trends - Growth & Forecast 2025 to 2035
Mud Pumps Market Growth - Trends & Forecast 2025 to 2035
Lobe Pumps Market
Solar Pumps Market Analysis - Size, Share, and Forecast Outlook 2025 to 2035
Charge Pumps Market Size and Share Forecast Outlook 2025 to 2035
Spinal Pumps Market Size and Share Forecast Outlook 2025 to 2035
Facial Pumps Market Growth – Demand & Forecast 2025 to 2035

Thank you!
You will receive an email from our Business Development Manager. Please be sure to check your SPAM/JUNK folder too.
Chat With
MaRIA