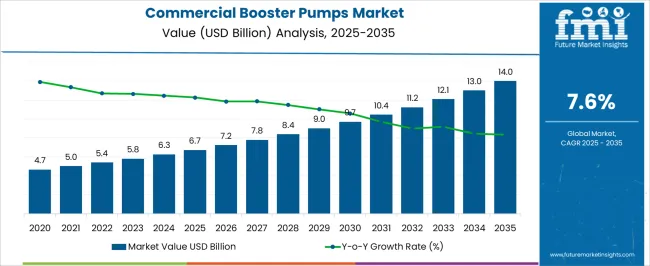
The Commercial Booster Pumps Market is estimated to be valued at USD 6.7 billion in 2025 and is projected to reach USD 14.0 billion by 2035, registering a compound annual growth rate (CAGR) of 7.6% over the forecast period.
| Metric | Value |
|---|---|
| Commercial Booster Pumps Market Estimated Value in (2025 E) | USD 6.7 billion |
| Commercial Booster Pumps Market Forecast Value in (2035 F) | USD 14.0 billion |
| Forecast CAGR (2025 to 2035) | 7.6% |
The commercial booster pumps market is experiencing steady momentum due to rising demand for efficient water distribution systems, growing urbanization, and the modernization of infrastructure networks. The increasing strain on municipal water supply and the need for reliable pressure management in high rise buildings are contributing to wider adoption.
Technological advancements in energy efficient motors, variable frequency drives, and smart monitoring systems are enhancing pump performance and reducing operational costs. Governments and municipalities are focusing on sustainable water management practices, further accelerating the use of booster pumps in both commercial and industrial applications.
The market outlook remains positive as investments in water infrastructure upgrades and the emphasis on energy efficiency create opportunities for innovation and long term growth.
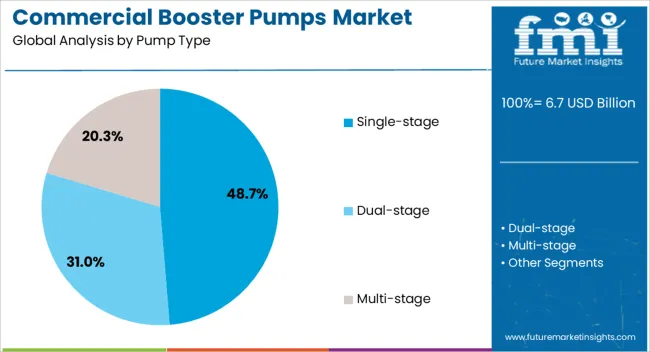
The single stage pump type segment is projected to contribute 48.70% of total market revenue by 2025, making it the leading category. This growth is being driven by the simplicity of design, lower maintenance requirements, and cost effectiveness of single stage pumps.
Their efficiency in handling moderate flow applications has supported widespread use across commercial facilities, office complexes, and institutional buildings. Additionally, advancements in pump materials and sealing technologies have enhanced durability and operational reliability.
The ability of single stage pumps to deliver stable pressure at lower energy consumption levels has reinforced their preference in the market, positioning them as the dominant pump type.
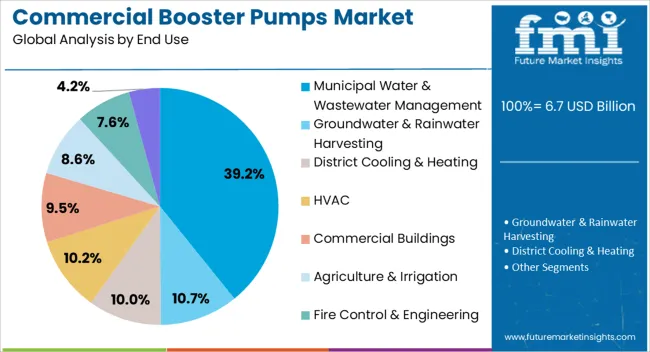
The municipal water and wastewater management segment is projected to hold 39.20% of total market revenue by 2025, making it the leading end use category. This dominance is being supported by rising investments in municipal water supply infrastructure, growing urban populations, and the increasing need for efficient wastewater treatment systems.
Booster pumps play a critical role in maintaining consistent water pressure across expanding distribution networks while ensuring reliable service delivery. Furthermore, stringent regulations on water quality and wastewater discharge standards are accelerating pump deployment in municipal projects.
With urban infrastructure expansion and sustainability requirements shaping industry priorities, the municipal water and wastewater management segment is set to remain the cornerstone of growth in the commercial booster pumps market.
The world population has substantially increased in recent years. Many countries have been experiencing a population boom which has LED to a drastic surge in demand for potable water and usable water. This has LED to an increase in demand for commercial water booster pumps across multiple industrial and domestic applications.
From 2020 to 2025, commercial booster pump sales rose at a CAGR of 4.4% and generated a revenue total of USD 5,270 million in 2025. An increasing population has also created a surge in agricultural activities and driven commercial irrigation booster pumps.
Rising urbanization, increasing population, growing demand for agricultural activities, increasing industrialization, rising water consumption, and rapid technological advancements are some prime factors that influence the commercial booster pump market potential.
Technological advancements while propelling the market are also expected to act as a restraining factor as well that could hinder commercial booster pump shipments over the forecast period. From 2025 to 2035, demand for commercial booster pumps is anticipated to rise at a high CAGR of 7.6%.
Short Term (2025 to 2029): An increase in market share by improving product offerings, expanding distribution channels, and increasing advertising and promotional activities may drive the market during the projected period.
Medium Term (2029 to 2035): During the mid-term period, the commercial booster pump market is likely to vary. Companies may aim to gain new customers such as manufacturing complexes, multi-story buildings, and high-rise facilities.
Long Term (2035 to 2035): In the long run, companies may aim to drive innovation by investing in research and development to create new products or improve existing ones. This could involve developing new materials, exploring new manufacturing techniques, or incorporating emerging technologies like IoT, AI, or data analytics.
| Historical CAGR | 4.4% |
|---|---|
| Historical Market Value (2025) | USD 5,270 million |
| Forecast CAGR | 7.6% |
The dynamics of the market for commercial booster pumps may be the subject of a comparison and review study, according to Future Market Insights. Some key aspects that affect the commercial booster pump market potential are rising urbanization rising population, increasing demand for agricultural activities, industrialization, rising water consumption, and swift technical improvements.
The main causes of the change in growth rate are related to the rapid development of technology, which is expected to have a significant impact on the demand for industrial water booster pump systems. Therefore, sizable commercial booster pump firms are concentrating on the introduction of new commercial water booster pumps.
Booster pumps are machines used to increase fluid pressure. They act like intermediaries between the fluid source and the fluid endpoints. Booster pumps deliver fluid to the endpoints at a desired pressure from the source.
They are also beneficial when a single pump is unable to achieve the appropriate service pressure while also preventing cavitation in other pumps in the system. It is beneficial to use booster pumps since they increase pressure and boost fluid supply, as well as cater to a variety of applications. It is small portable, and easy to install and maintain.
Rising Demand for Corrosion-resistant Pumps to Propel Market Potential
Water pumps are in constant contact with water and the prolonged exposure to water causes the metal in pumps to corrode at an alarming rate this is a leading issue with numerous commercial booster pumps for water. Commercial booster pump companies are focusing on solving this issue by investing in research and development activities that may result in a corrosion-resistant commercial booster pump for water.
This is expected to be a key opportunity for several companies, and since the demand for such pumps is extremely high, it could open an untapped market that could change the course of the commercial booster pump industry through 2035.
FMI research survey on the commercial booster pumps market details regional assessment for regions such as North America, Latin America, Europe, East Asia, South Asia & Pacific, and the Middle East & Africa (MEA).
The East Asia commercial booster pump market is anticipated to provide highly rewarding opportunities for commercial booster pump manufacturers over the forecast period. In 2025, the market in this region holds a significant market share of 22.4% in the global industry landscape. Increasing urbanization and rising population are expected to be the key factors governing market potential in this region.
Second, to East Asia, the commercial booster pumps market in Europe follows closely accounting for a market share of 21.6%. The presence of key commercial booster pump manufacturers is anticipated to be a key factor propelling market potential in this region. Germany is expected to be an advantageous market for the sales of commercial booster pump systems in this region.
The market for commercial booster pumps in South Asia and the Asia Pacific accounts for a market share of 17.2% in the global marketplace, and demand for industrial water pressure booster pumps is predicted to be high in this region.
The North American commercial booster pump market holds a massive market share of 19.2% in the global industry landscape. Demand in this region is expected to be widely propelled by nations such as Canada and the United States.
Multi-stage Pumps Capture the Maximum Market Share
Based on pump type, the global commercial booster pumps market is segmented into single-stage pumps, seal-less & circulator pumps, multi-stage pumps, and submersible pumps. The multi-stage centrifugal pump is primarily used in applications requiring higher pressures and flow rates of up to 75,000 liters per minute.
As a result, multi-stage centrifugal pumps are ideal for applications that require substantial volumes of fluid to be pumped. This may result in a market share of 59.7% for multi-stage pumps shortly.
Offline Sales Channels to Dominant throughout the Forecast Period
The increasing inclination of consumers to personally inspect the product before making a purchase is what drives sales through offline channels. The lack of online sales channels for industrial water booster pumps is expected to act in favor of offline sales channels.
Online sales are expected to see a steady rise over the forecast period as the popularity of e-Commerce picks up pace owing to increasing digitization and rising technological proliferation across the world.
Increasing Demand from Smart Cities to Boost United States Market Potential
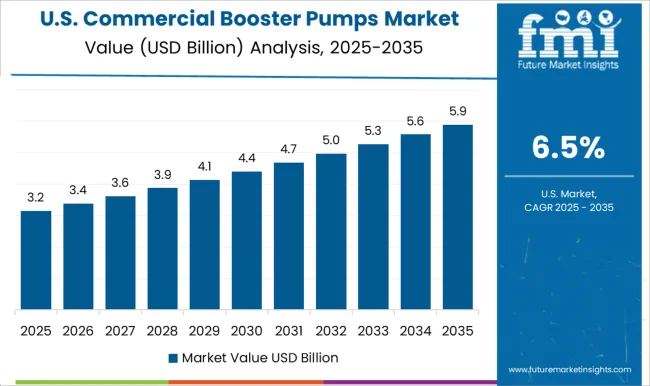
High technological proliferation is anticipated to influence demand for commercial water booster pumps in the United States. The increasing trend of the establishment of smart cities is expected to propel the demand for commercial water booster pumps. Commercial booster pump companies in this nation are broadly focusing on launching new commercial booster pumps for water.
| Region | North America |
|---|---|
| Country | United States |
| Market Share | 14.7% |
| Region | Europe |
|---|---|
| Country | Germany |
| Market Share | 4.6% |
| Region | Asia Pacific |
|---|---|
| Country | Australia |
| Market Share | 4.0% |
| Region | Asia Pacific |
|---|---|
| Country | Japan |
| Market Share | 8.8% |
Increasing Industrialization & High Agricultural Activity Boosting Sales of Commercial Booster Pump Systems
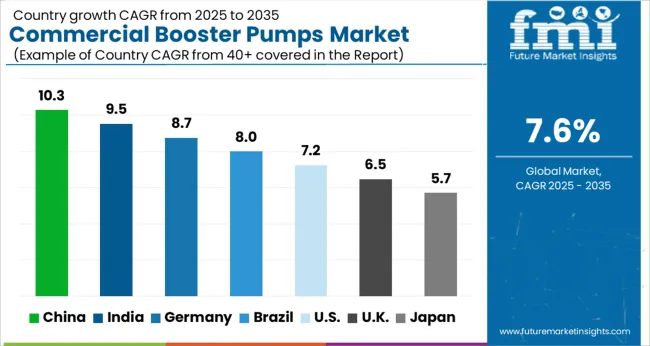
India is emerging as one of the very important industrial countries in the world and this is expected to boost demand for commercial water pressure booster pumps. Agriculture is a primary occupation in India and this is expected to drive sales of commercial irrigation booster pumps in the nation through 2035. Commercial booster pump manufacturers are focusing on launching new products to increase their revenue potential in India.
| Region | Europe |
|---|---|
| Country | United Kingdom |
| CAGR | 6.8% |
| Region | Asia Pacific |
|---|---|
| Country | China |
| CAGR | 9.0% |
| Region | Asia Pacific |
|---|---|
| Country | India |
| CAGR | 10.2% |
Prominent Players in the market are
Recent Development
Commercial booster pump vendors are focusing on expanding their product portfolio by launching new products and expanding their revenue potential.
| Attribute | Details |
|---|---|
| Forecast Period | 2025 to 2035 |
| Historical Data Available for | 2020 to 2025 |
| Market Analysis | USD million for Value and MT for Volume |
| Key Regions Covered | North America; Latin America; Europe; The Middle East and Africa; East Asia |
| Key Countries Covered | United States, Canada, Brazil, Mexico, Chile, Peru, Germany, United Kingdom, Spain, Italy, France, Russia, Poland, China, India, Japan, Australia, New Zealand, GCC Countries, North Africa, South Africa, and Türkiye |
| Key Segments Covered | Pump Type, Operating Pressure, End Use, Sales Channel, Region |
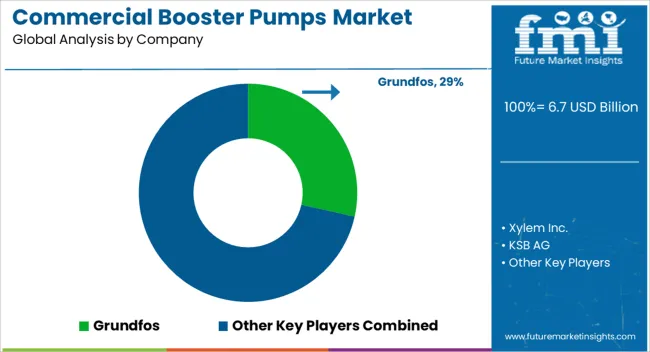
| Key Companies Profiled | Grundfos; Xylem Inc.; KSB AG; Flowserve Corporation; Sulzer Ltd.; WILO SE; Gorman Rupp Pump Company; ANDTRIZ Group; Danfoss; Pentair Plc.; Peerless Pump Company; CAT Pumps; ETEC; Zoeller Company; Franklin Electric; Luckpump Machiner Co. Ltd.; LEO Group; Mazzoni SRL; Vossche; Torishima Pump Mfg. Co. Ltd |
| Report Coverage | Market Forecast, Company Share Analysis, Competition Intelligence, DROT Analysis, Market Dynamics and Challenges, and Strategic Growth Initiatives |
| Customization & Pricing | Available upon Request |
The global commercial booster pumps market is estimated to be valued at USD 6.7 billion in 2025.
The market size for the commercial booster pumps market is projected to reach USD 14.0 billion by 2035.
The commercial booster pumps market is expected to grow at a 7.6% CAGR between 2025 and 2035.
The key product types in commercial booster pumps market are single-stage, dual-stage and multi-stage.
In terms of operating pressure, 0.5 – 1 bar segment to command 12.6% share in the commercial booster pumps market in 2025.


Our Research Products

The "Full Research Suite" delivers actionable market intel, deep dives on markets or technologies, so clients act faster, cut risk, and unlock growth.

The Leaderboard benchmarks and ranks top vendors, classifying them as Established Leaders, Leading Challengers, or Disruptors & Challengers.

Locates where complements amplify value and substitutes erode it, forecasting net impact by horizon

We deliver granular, decision-grade intel: market sizing, 5-year forecasts, pricing, adoption, usage, revenue, and operational KPIs—plus competitor tracking, regulation, and value chains—across 60 countries broadly.

Spot the shifts before they hit your P&L. We track inflection points, adoption curves, pricing moves, and ecosystem plays to show where demand is heading, why it is changing, and what to do next across high-growth markets and disruptive tech

Real-time reads of user behavior. We track shifting priorities, perceptions of today’s and next-gen services, and provider experience, then pace how fast tech moves from trial to adoption, blending buyer, consumer, and channel inputs with social signals (#WhySwitch, #UX).

Partner with our analyst team to build a custom report designed around your business priorities. From analysing market trends to assessing competitors or crafting bespoke datasets, we tailor insights to your needs.
Supplier Intelligence
Discovery & Profiling
Capacity & Footprint
Performance & Risk
Compliance & Governance
Commercial Readiness
Who Supplies Whom
Scorecards & Shortlists
Playbooks & Docs
Category Intelligence
Definition & Scope
Demand & Use Cases
Cost Drivers
Market Structure
Supply Chain Map
Trade & Policy
Operating Norms
Deliverables
Buyer Intelligence
Account Basics
Spend & Scope
Procurement Model
Vendor Requirements
Terms & Policies
Entry Strategy
Pain Points & Triggers
Outputs
Pricing Analysis
Benchmarks
Trends
Should-Cost
Indexation
Landed Cost
Commercial Terms
Deliverables
Brand Analysis
Positioning & Value Prop
Share & Presence
Customer Evidence
Go-to-Market
Digital & Reputation
Compliance & Trust
KPIs & Gaps
Outputs
Full Research Suite comprises of:
Market outlook & trends analysis
Interviews & case studies
Strategic recommendations
Vendor profiles & capabilities analysis
5-year forecasts
8 regions and 60+ country-level data splits
Market segment data splits
12 months of continuous data updates
DELIVERED AS:
PDF EXCEL ONLINE
Commercial Baking Rack Oven Market Size and Share Forecast Outlook 2025 to 2035
Commercial Blast Freezer Market Size and Share Forecast Outlook 2025 to 2035
Commercial Water Heater Market Size and Share Forecast Outlook 2025 to 2035
Commercial High-Speed Oven Market Size and Share Forecast Outlook 2025 to 2035
Commercial Turboprop Aircrafts Market Size and Share Forecast Outlook 2025 to 2035
Commercial Vehicle Foundation Brakes Market Size and Share Forecast Outlook 2025 to 2035
Commercial Vehicle Brake Chambers Market Size and Share Forecast Outlook 2025 to 2035
Commercial Vehicles LED Bar Lights Market Size and Share Forecast Outlook 2025 to 2035
Commercial Vehicle AMT Transmission Market Size and Share Forecast Outlook 2025 to 2035
Commercial Greenhouse Market Size and Share Forecast Outlook 2025 to 2035
Commercial Vessel Market Size and Share Forecast Outlook 2025 to 2035
Commercial Slush Machine Market Size and Share Forecast Outlook 2025 to 2035
Commercial Medium Voltage Distribution Panel Market Size and Share Forecast Outlook 2025 to 2035
Commercial Earth Observation (CEO) Market Size and Share Forecast Outlook 2025 to 2035
Commercial Ozone Generator Market Size and Share Forecast Outlook 2025 to 2035
Commercial Gas-Fired Boiler Market Size and Share Forecast Outlook 2025 to 2035
Commercial Deep Fryer Parts & Accessories Market Size and Share Forecast Outlook 2025 to 2035
Commercial Gas Restaurant Ranges Market Size and Share Forecast Outlook 2025 to 2035
Commercial Heat Pump Market Size and Share Forecast Outlook 2025 to 2035
Commercial Countertop Ranges Market Size and Share Forecast Outlook 2025 to 2035

Thank you!
You will receive an email from our Business Development Manager. Please be sure to check your SPAM/JUNK folder too.
Chat With
MaRIA