

- Market Size (2026)
- USD 2.1 Bn
- Forecast (2036)
- USD 4.4 Bn
- CAGR (2026 to 2036)
- 7.7%
Electro-Hydraulic Brake Actuation Units Market Size, Market Forecast and Outlook By FMI
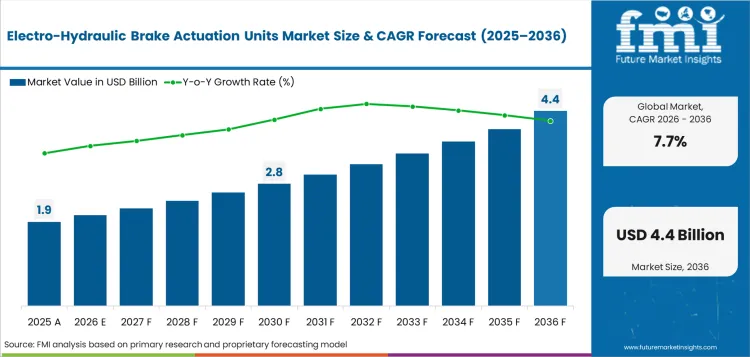
Electro-hydraulic brake actuation units market was valued at USD 1.9 billion in 2025 and is expected to reach USD 2.1 billion in 2026. Market value is forecast to reach USD 4.4 billion by 2036 at 7.7% CAGR during 2026 to 2036. OEM fitment is expected to account for 86.0% of sales channel demand in 2026. Passenger cars are forecast to represent 68.0% of vehicle type demand in 2026.
Summary of the Electro-Hydraulic Brake Actuation Units Market
- Demand and Growth Drivers
- Demand is supported by EV production as electric vehicles need accurate brake pressure control.
- Automated emergency braking is increasing the need for actuation units that can respond quickly.
- Brake-by-wire systems are gaining attention as automakers reduce reliance on older mechanical booster layouts.
- Product and Segment View
- Brake boosters lead product use because one-box modules reduce space pressure near the firewall.
- Passenger cars create steady demand as high-volume vehicle platforms need repeatable brake feel.
- BEV applications need precision-controlled actuation units because energy recovery must work smoothly with hydraulic braking.
- Geography and Competitive Outlook
- China and India are important markets because EV production and local sourcing are rising.
- Germany and South Korea support brake-by-wire validation work through supplier depth.
- Leading suppliers compete on pressure accuracy and safe fallback performance. OEM approval gives established firms a clear advantage.
- Analyst Opinion
- FMI Principal Consultant Nikhil Kaitwade says, “Electro-hydraulic brake actuation is receiving value in a less obvious part of vehicle electrification. Battery electric cars need smooth handoff between motor braking and friction braking. Automated emergency braking needs repeatable pressure rise across road speeds. Suppliers can gain share by proving pressure accuracy and safe fallback. The same package must prove software calibration.”
- Electro-Hydraulic Brake Actuation Units Market Value Analysis
- Brake actuation units add value by converting driver input and safety software requests into controlled hydraulic pressure.
- EV platforms need pressure control coordinated with regenerative braking systems without giving drivers an uneven pedal feel.
- Actuation units support automatic emergency braking as fast pressure build-up affects stopping distance and safety calibration.
- OEM fitment creates repeat orders since brake feel and fallback performance are validated before platform launch.
- Suppliers with one-box boost and stability control can charge for more content per vehicle. Fail-safe hydraulic backup adds another value layer.
Key Takeaways, Market Size, and Forecast
- Electro-hydraulic brake actuation units market stood at USD 1.9 billion in 2025.
- Industry revenue is estimated at USD 4.4 billion by 2036 as EV braking and automated safety needs expand.
- Market value is expected to rise at 7.7% CAGR during 2026 to 2036.
- Market revenue is forecast to add USD 2.3 billion in incremental opportunity over 2026 to 2036.
- Brake boosters are expected to lead product type demand with 45.0% share in 2026.
- OEM fitment is anticipated to represent 86.0% of sales channel demand in 2026.
- Passenger cars are forecast to account for 68.0% of vehicle type demand in 2026.
- China at 9.2% CAGR and India at 8.7% CAGR are expected to hold steady expansion pace by 2036.
Electro-hydraulic brake actuation is witnessing rise in demand as braking shifts from pedal force to software commands. EU safety rules from July 2024 require automatic emergency braking in all new cars sold in the EU, which raises the need for fast and repeatable pressure response. Companies such as ZF, are widening brake-by-wire choices through electric systems and hydraulic or combined layouts for automated driving. Hyundai Mobis is also using winter testing in Sweden to prove brake control in harsh road conditions. These moves represent that OEMs will favor suppliers that can deliver pressure accuracy and proven vehicle-level validation.
Electro-Hydraulic Brake Actuation Units Market Definition
Electro-hydraulic brake actuation units are integrated braking modules designed to create and control hydraulic pressure using electronic commands. Units may include a booster and motor pump. Pressure sensors and valve blocks are built into many one-box packages.
Electro-Hydraulic Brake Actuation Units Market Inclusions
Scope includes electro-hydraulic brake boosters, pressure modules, pedal simulators, valve blocks, validated brake-by-wire actuator packages, OEM fitment, service replacement and actuator units used in passenger cars and commercial vehicles. Key stakeholders include vehicle manufacturers, Tier 1 brake system suppliers, EV platform developers, chassis control software providers, actuator component suppliers, automotive distributors, service centers, fleet operators and automotive safety regulators.
Electro-Hydraulic Brake Actuation Units Market Exclusions
Scope excludes mechanical brake discs, brake pads and basic friction parts sold as standalone products. Calipers, hoses and brake fluid lines are excluded unless supplied as part of a validated electro-hydraulic actuation package. Pure electromechanical brake units are excluded unless paired with hydraulic pressure actuation. Standalone ABS modules, ESC controllers and brake sensors are excluded unless integrated with the actuation unit.
Electro-Hydraulic Brake Actuation Units Market Research Methodology
- Primary Research: FMI analysts reviewed brake actuation suppliers and OEM platform needs. Service input from major automotive countries was checked.
- Desk Research: Public data from safety regulators and vehicle industry bodies shaped market checks. Official supplier releases were used for company proof.
- Market Sizing and Forecasting: Sizing used electric brake actuator system demand and brake-by-wire fitment. Actuator value per vehicle completed the model.
- Data Validation: Forecast checks compared EV sales and AEB regulation timing. Supplier awards were checked against comparable automotive actuator values.
Why is the Electro-Hydraulic Brake Actuation Units Market Growing?
- EV platforms need better brake pressure blending as motor braking and hydraulic braking must work smoothly.
- Automated emergency braking increases the need for actuators with fast pressure response.
- One-box actuation units reduce space pressure near the firewall and support cleaner vehicle design.
- Redundant braking supports driver assistance systems or ADAS as vehicles need safe fallback during electronic brake control.
EV sales are raising brake actuation value as electric cars need smooth control between motor braking and hydraulic braking. International Energy Agency data published in May 2026 recorded over 20.0 million electric car sales in 2025 and a 25.0% global sales share. Larger EV fleets make pressure control more important across daily braking and safety events. Suppliers with proven calibration can support electric brake actuator systems for passenger vehicles across more vehicle programs.
Safety regulation is making brake actuation a platform-level decision. Automatic emergency braking needs fast pressure response from electronic commands. Brake units must support steady stopping force across vehicle speed and road condition changes. Automakers prefer validated modules since late brake-system changes can delay safety approval.
Market Segmentation Analysis
- Brake boosters are expected to lead product type demand with 45.0% share in 2026.
- Passenger cars are forecast to account for 68.0% of vehicle type demand in 2026.
- In 2026, BEV applications are anticipated to hold 42.0% propulsion share.
- Service brake function is forecast to represent 61.0% share in 2026.
- In 2026, OEM fitment is expected to hold 86.0% sales channel share.
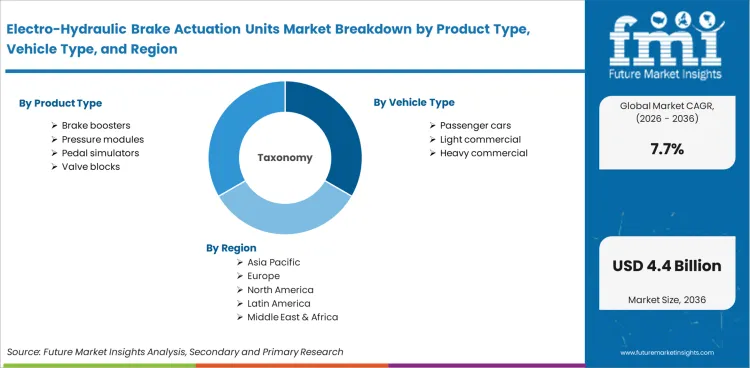
The electro-hydraulic brake actuation units market is segmented by product type, vehicle type, propulsion, brake function, sales channel, region. Product type include brake boosters, pressure modules, pedal simulators, valve blocks. Vehicle type includes passenger cars, light commercial vehicles, heavy commercial vehicles. Propulsion includes BEV, hybrid, ICE platforms. Brake function includes service brake, blended brake, redundant brake. Sales channel includes OEM fitment, aftermarket, and service replacement.
Insights into Electro-Hydraulic Brake Actuation Units Market by Product Type
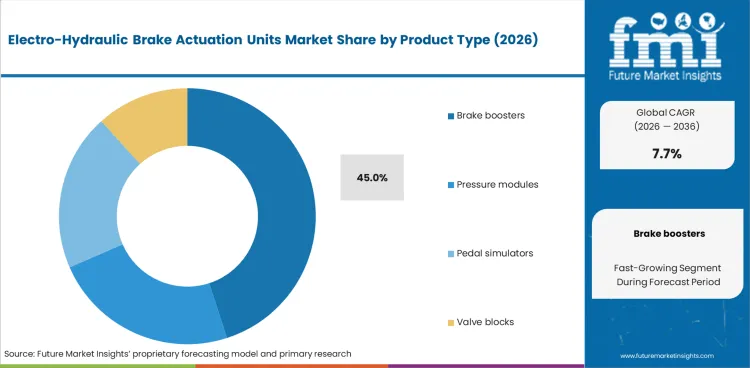
- Brake boosters are expected to hold 45.0% share in 2026. Automakers prefer one-box modules that combine boost and pressure control in one approved unit. The compact design reduces space pressure near the firewall and makes platform approval easier for OEMs.
- Pressure modules support vehicles that need a separate hydraulic control block for more flexible design. Pedal simulators support brake-by-wire systems by helping EV braking feel smooth during energy recovery.
Insights into Electro-Hydraulic Brake Actuation Units Market by Vehicle Type
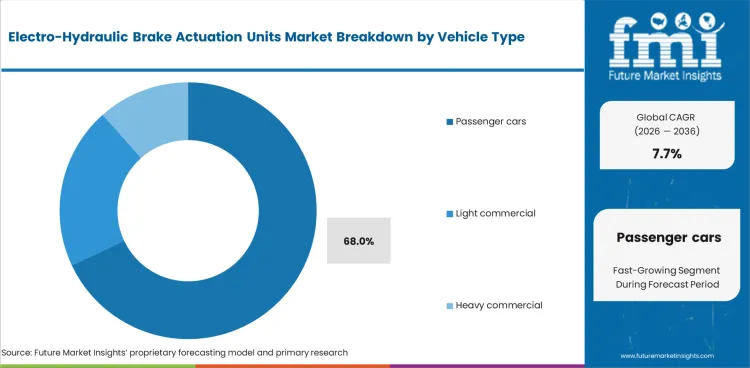
- Passenger cars are forecast to account for 68.0% share in 2026 with EV and hybrid models needing smooth brake blending across high-volume platforms. Once an actuation unit is approved, automakers can use it across several trims with lower validation effort.
- Light commercial vehicles need durable pressure control for city delivery routes. Heavy commercial vehicles need stronger backup control as higher vehicle weight puts more stress on braking systems.
Insights into Electro-Hydraulic Brake Actuation Units Market by Propulsion
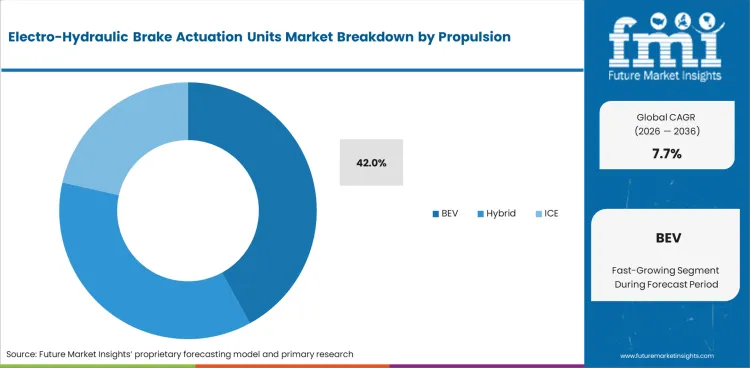
- BEV platforms are anticipated to account for 42.0% share in 2026 as motor braking handles part of daily stopping. Electro-hydraulic actuation units keep pedal feel steady when the system moves from motor braking to hydraulic braking.
- Hybrid platforms need the same smooth handoff during city driving and highway braking. ICE platforms keep service demand active as safety systems add electronic braking commands to older brake layouts.
Insights into Electro-Hydraulic Brake Actuation Units Market by Brake Function
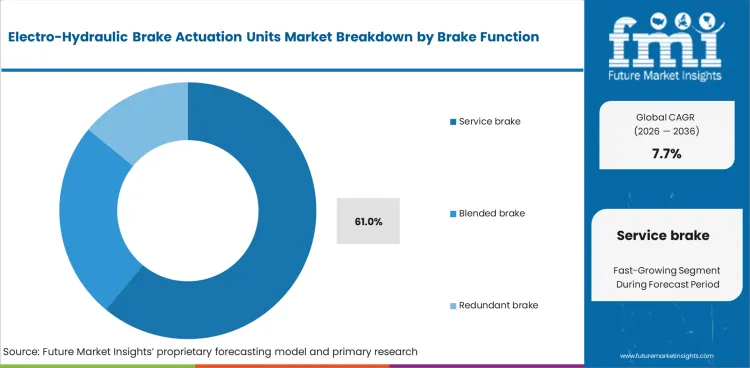
- Service brake function is forecast to hold 61.0% share in 2026. Daily braking and AEB commands both need controlled hydraulic pressure. A stable response helps OEMs meet stopping targets without making the pedal feel rough.
- Blended brake systems get value in EV programs as software balances energy recovery with friction braking. Redundant braking supports ADAS safety plans that need backup pressure during safety events.
Electro-Hydraulic Brake Actuation Units Market Drivers, Restraints, and Opportunities
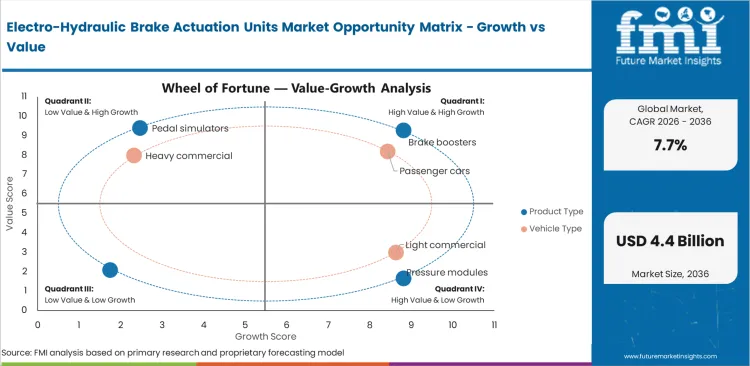
- EV brake blending increases demand for pressure modules that manage motor braking and hydraulic braking in one smooth action.
- Validation cost can slow smaller suppliers as brake actuation affects safety approval and pedal feel.
- Brake-by-wire platforms create scope for suppliers that combine hydraulic backup with software control.
EV Brake Blending Raises Actuator Value
Modern EVs slow down through motor braking before friction brakes complete the stop. Electro-hydraulic actuation units manage hydraulic pressure so the pedal feels smooth to the driver. Brake blending is becoming more important as EVs enter higher-volume vehicle lines. Suppliers with pressure accuracy and calibration proof can secure repeat use across BEV and hybrid platforms.
AEB Rules Lift Pressure Control Needs
Automatic emergency braking needs fast brake response without driver pedal force. NHTSA finalized FMVSS No. 127 in April 2024 and requires AEB on cars and light trucks by September 2029. Actuator response must match sensor timing during possible crash events. Suppliers that prove quick pressure build-up can have stronger access to safety-focused vehicle programs.
One-box Actuation Creates Upgrade Scope
One-box actuation combines boost and pressure control inside one compact module. The design suits EVs as it supports braking control without vacuum hardware. It gives automakers more room near the firewall and simplifies system packaging. Wider automotive brake system upgrades can support electronic braking as a larger part of vehicle safety design.
Analysis of Electro-Hydraulic Brake Actuation Units Market by Key Countries
.webp "Top Country Growth Comparison Electro Hydraulic Brake Actuation Units Market Cagr (2026 2036)")
| Country | CAGR |
|---|---|
| China | 9.2% |
| India | 8.7% |
| South Korea | 8.4% |
| Germany | 8.1% |
| United States | 7.8% |
| Japan | 7.4% |
| United Kingdom | 7.1% |
Source: Future Market Insights, 2026.
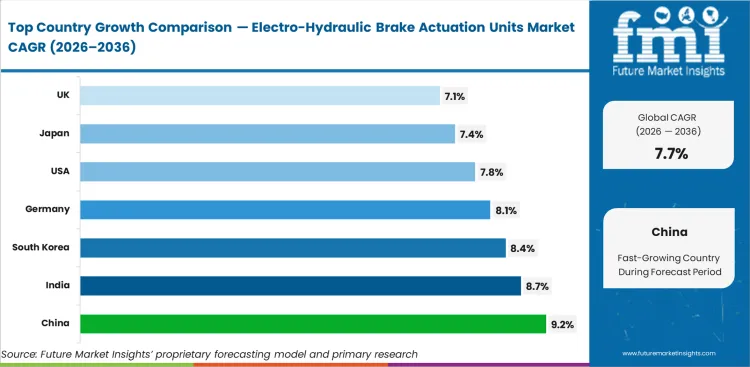
Electro-Hydraulic Brake Actuation Units Market CAGR Analysis by Country
- China is forecast to record 9.2% CAGR through 2036.
- The market in India is projected to expand at 8.7% CAGR through 2036.
- South Korea is expected to advance at 8.4% CAGR during the forecast period.
- Germany is forecast to register 8.1% CAGR in the market by 2036.
- The United States is anticipated to move ahead at 7.8% CAGR over the forecast period.
- Japan is expected to record 7.4% CAGR in the industry by 2036.
- The industry outlook in the United Kingdom points to 7.1% CAGR through 2036.
Demand Outlook for Electro-Hydraulic Brake Actuation Units Market in China
China holds volume potential for electro-hydraulic brake actuation units because EV scale and local brake electronics depth are high. International Energy Agency data from May 2026 reported over 13.0 million electric cars sold in China during 2025. China accounted for about six in ten electric cars sold globally. The market is forecast to record 9.2% CAGR through 2036 as domestic platforms need pressure modules for EV recuperation and safety features. Local sourcing keeps cost pressure high, so suppliers need validated hardware with faster software tuning.
- National EV scale supports high-volume actuator contracts across passenger car platforms.
- suppliers get space as OEMs ask for shorter validation loops.
- Compact one-box modules fit local cost targets and support wider use across vehicle lines.
Demand Outlook for Electro-Hydraulic Brake Actuation Units Market in India
India offers a faster actuator opportunity as vehicle output and EV incentives move together. India’s heavy industries ministry reported 2.1 million electric vehicles sold under its electric mobility scheme by 31 December 2025. The market in India is projected to expand at 8.7% CAGR through 2036 as local suppliers work toward brake actuation content for compact cars and small commercial fleets. Price-sensitive platforms are likely to favor durable units with simple service checks and local parts access.
- Local passenger vehicle output creates wider use for validated brake actuation assemblies.
- Urban fleet electrification raises interest in stable pressure control and lower service downtime.
- Supplier localization improves cost control as OEMs seek domestic component support.
Sales Analysis of Electro-Hydraulic Brake Actuation Units Market in South Korea
South Korea has a strong supplier role because domestic OEMs and brake electronics firms support EV production. The USA International Trade Administration stated South Korea produced 407.0 thousand EVs in 2025. EVs equaled 11.0% of total automobile production. South Korea is expected to advance at 8.4% CAGR during the forecast period as export platforms need brake-by-wire readiness and supplier proof. Local groups can combine module assembly with software testing for global vehicle programs.
- Domestic EV platforms need actuation units that support regenerative braking without uneven pedal feel.
- Export programs favor suppliers able to meet several regulatory checks with one validated module family.
- Electronics depth supports automotive actuator integration as chassis control becomes more software based.
Opportunity Analysis of Electro-Hydraulic Brake Actuation Units Market in Germany
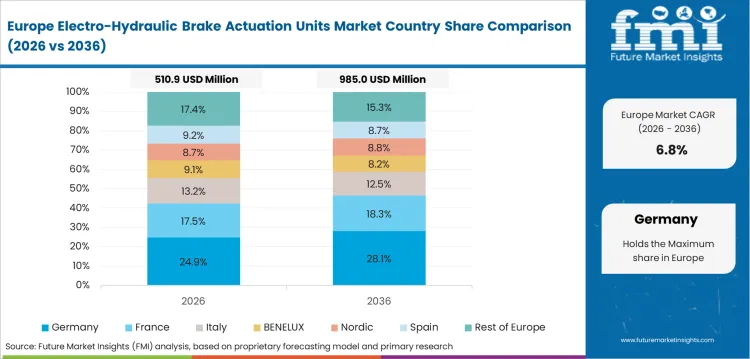
Germany is a premium proving ground for electro-hydraulic braking because automakers place high value on brake feel and safety redundancy. VDA reported German electric vehicle registrations reached 100.7 thousand units in March 2026. Electric vehicles held a 34.0% share of new registrations. Germany is forecast to register 8.1% CAGR in the market by 2036 as premium EV and hybrid programs use more precision brake control. Suppliers must prove winter behavior and high-speed stability before wider platform use.
- Premium vehicle programs need brake actuation units with stable pedal feel across driving modes.
- German system suppliers support x-by-wire work through chassis software and brake control know-how.
- Engineering centers value reusable calibration data as one module family moves across EV and hybrid models.
Sales Analysis of Electro-Hydraulic Brake Actuation Units Market in the United States
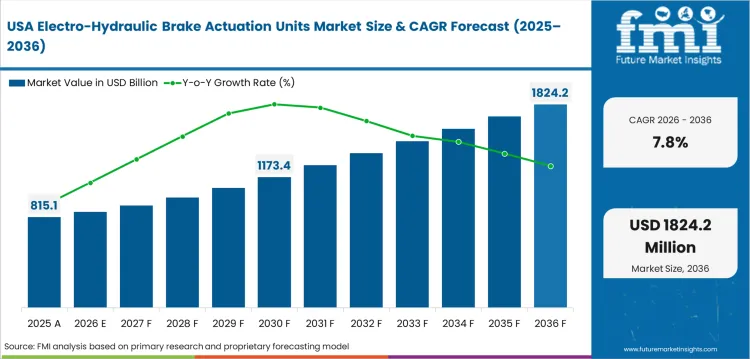
United States demand is tied to AEB regulation and EV launches. Large light-truck platforms add actuator volume. International Energy Agency data from May 2026 placed USA electric car sales around 1.5 million in 2025 with a 10.0% full-year share. The United States is anticipated to move ahead at 7.8% CAGR over the forecast decade as brake pressure control becomes part of safety and electrification planning. Suppliers need North American program access and service documentation for long vehicle life.
- Federal AEB timing supports demand for actuators that deliver quick brake pressure from electronic commands.
- Pickup and SUV platforms need durable electro-hydraulic units built for weight and towing.
- Aftermarket readiness gets value as approved modules need replacement paths through dealer networks.
Future Outlook for Electro-Hydraulic Brake Actuation Units Market in Japan
Japan combines hybrid strength with careful safety validation. The USA International Trade Administration stated 59.7 thousand new EVs were sold in Japan in 2024. EVs equaled 1.35% of new vehicle sales. Japan is expected to record 7.4% CAGR in the sector by 2036 as hybrid and small EV programs keep focus on smooth brake blending. Brake suppliers with compact designs and long test records are well placed for domestic OEM decisions.
- Hybrid platforms need stable hydraulic pressure control during low-speed brake transition.
- Compact vehicle programs favor smaller modules that protect cabin space.
- Japanese brake specialists keep a role through calibration know-how and long-running OEM quality systems.
Future Outlook for Electro-Hydraulic Brake Actuation Units Market in the United Kingdom
United Kingdom demand is supported by EV registration benefits and local vehicle engineering services. SMMT reported on 6 January 2026 that new car registrations reached 2.02 million in 2025. BEV registrations reached almost half a million units. The industry outlook in the United Kingdom points to 7.1% CAGR through 2036 as brake actuation validation supports EV and hybrid platforms. Engineering services in the country support calibration and homologation work.
- Vehicle engineering centers support brake-by-wire validation for European and export programs.
- Fleet and retail EV uptake increases the need for brake modules built for frequent urban braking.
- Service specialists need approved diagnostics as electro-hydraulic units move deeper into safety systems.
Competitive Landscape and Strategic Positioning
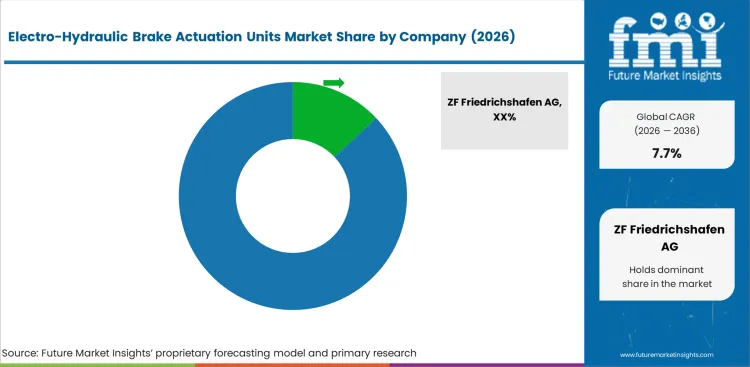
- Competition centers on pressure control accuracy and safe fallback. OEM platform approval decides access to volume programs.
- Suppliers stand out by combining boost function with stability control and software calibration depth.
- Brake specialists gets an advantage as OEMs prefer one accountable partner for hardware and safety software.
- Entry barriers include safety validation and winter testing. Actuator noise control inside compact cabins adds another challenge.
Hyundai Mobis is moving brake control deeper into software-based chassis systems. In December 2025, the company announced its X-by-Wire integrated solution for CES 2026. The system supports electronic steering and braking control without mechanical connections. It also integrates both functions into one controller and includes dual safety logic so braking can help manage the vehicle if a steering issue occurs. This gives Hyundai Mobis a stronger role as OEMs shift brake actuation toward integrated chassis control.
Bosch reported in January 2025 that its hydraulic brake-by-wire system completed public-road testing over 3,300 km and that launch was planned from fall 2025. Bosch also said it had orders from vehicle manufacturers, which gives the company a clearer route into next-generation brake actuation programs. Suppliers with software depth and vehicle-level testing will be better placed as chassis functions become more connected.
Key Companies in the Electro-Hydraulic Brake Actuation Units Market
- Global Brake Control Leaders: ZF Friedrichshafen AG and Robert Bosch GmbH lead through integrated braking platforms. AUMOVIO SE adds OEM award depth.
- Asian Brake Specialists: ADVICS Co. Ltd. and Hyundai Mobis Co. Ltd. support regional OEM programs. HL Mando Corporation adds EV platform work.
- Performance Brake Participant: Brembo N.V. adds hydraulic brake depth and premium platform access through high-performance braking systems.
Competitive Benchmarking: Electro-Hydraulic Brake Actuation Units Market
| Company | Pressure Control Depth | Redundancy Calibration | OEM Platform Access | Geographic Footprint |
|---|---|---|---|---|
| ZF Friedrichshafen AG | High | High | High | Global with Europe strength |
| Robert Bosch GmbH | High | High | High | Global with German depth |
| AUMOVIO SE | High | Medium | High | Europe and Asia coverage |
| ADVICS Co. Ltd. | Medium | Medium | High | Japan and Asia centered |
| Brembo N.V. | Medium | Medium | Medium | Europe and premium programs |
| Hyundai Mobis Co. Ltd. | Medium | Medium | High | South Korea and global OEMs |
| HL Mando Corporation | Medium | Medium | Medium | South Korea centered |
| Hitachi Astemo, Ltd. | Medium | Medium | Medium | Japan and global coverage |
Source: Future Market Insights competitive analysis, 2026.
Key Developments in Electro-Hydraulic Brake Actuation Units Market
- In January 2025, ZF secured a brake-by-wire business award for light vehicles covering nearly 5.0 million vehicles over the contract life.
- In May 2026, Brembo announced that Sensify entered large-scale series production for a leading global vehicle manufacturer.
Key Players in the Electro-Hydraulic Brake Actuation Units Market
Major Global Players
- ZF Friedrichshafen AG
- Robert Bosch GmbH
- AUMOVIO SE
- Brembo N.V.
Specialist and Regional Players
- ADVICS Co. Ltd.
- Hyundai Mobis Co. Ltd.
- HL Mando Corporation
- Hitachi Astemo, Ltd.
Report Scope and Coverage
| Parameter | Details |
|---|---|
| Quantitative Units | USD 2.1 billion to USD 4.4 billion at 7.7% CAGR |
| Market Definition | Electronic hydraulic pressure actuation units used for service braking and automated braking commands |
| Regions Covered | North America, Latin America, Western Europe, Eastern Europe, East Asia, South Asia and Pacific, Middle East and Africa. |
| Countries Covered | United States, China, India, Germany, South Korea, Japan, United Kingdom and additional countries. |
| Key Companies Profiled | ZF Friedrichshafen AG, Robert Bosch GmbH, AUMOVIO SE, ADVICS Co. Ltd., Brembo N.V., Hyundai Mobis Co. Ltd., HL Mando Corporation. |
| Forecast Period | 2026 to 2036 |
| Approach | Hybrid bottom-up and top-down method using brake actuator content per vehicle and EV sales. Safety rules and supplier award data were used for checks. |
Electro-Hydraulic Brake Actuation Units Market Breakdown by Product Type, Vehicle Type, Propulsion, Brake Function, Sales Channel, and Region
Electro-Hydraulic Brake Actuation Units Market Segmented by Product Type
- Brake boosters
- Pressure modules
- Pedal simulators
- Valve blocks
Electro-Hydraulic Brake Actuation Units Market Segmented by Vehicle Type
- Passenger cars
- Light commercial
- Heavy commercial
Electro-Hydraulic Brake Actuation Units Market Segmented by Propulsion
- BEV
- Hybrid
- ICE
Electro-Hydraulic Brake Actuation Units Market Segmented by Brake Function
- Service brake
- Blended brake
- Redundant brake
Electro-Hydraulic Brake Actuation Units Market Segmented by Sales Channel
- OEM fitment
- Aftermarket
- Service replacement
Electro-Hydraulic Brake Actuation Units Market Segmented by Region
- North America
- Latin America
- Western Europe
- Eastern Europe
- East Asia
- South Asia and Pacific
- Middle East and Africa
Research Sources and Bibliography
- International Energy Agency. (2026, May 13). Trends in electric cars. IEA.
- Ministry of Heavy Industries. (2026, January 13). Year End Review 2025: Ministry of Heavy Industries. Press Information Bureau.
- International Trade Administration. (2025, July 21). South Korea electric vehicles EV market. International Trade Administration.
- Verband der Automobilindustrie. (2026, April 6). Production and market in March 2026. VDA
- International Trade Administration. (2025, November 20). Japan - automotive. International Trade Administration.
- Society of Motor Manufacturers and Traders. (2026, January 6). UK new car market breaches two million as almost one in four buyers go electric. SMMT.
- National Highway Traffic Safety Administration. (2024, April 29). NHTSA finalizes key safety rule to reduce crashes and save lives. NHTSA.
- European Commission. (2024, July 5). New rules on vehicle safety and automated mobility: New safety features in your car. European Union.
- ZF Friedrichshafen AG. (2025, January 6). ZF secures substantial brake-by-wire technology business for light vehicles. ZF Press Center.
- ZF Friedrichshafen AG. (2025, July 10). Braking evolution: ZF brings to market a comprehensive brake-by-wire portfolio. ZF Press Center.
- Robert Bosch LLC. (2025, January 30). With brake-by-wire from Bosch to the Arctic Circle. Bosch Media Service US.
- Hyundai Mobis. (2025, December 9). Hyundai Mobis to unveil 30+ new technologies at CES 2026, aiming to strengthen global OEM partnerships. Hyundai Mobis.
- Hyundai Motor Group. (2026, March 3). Hyundai Mobis invites 10 global customers to Swedish winter testing ground to showcase core technologies in extreme cold conditions. Hyundai Motor Group.
- Brembo N.V. (2026, May 4). The new standard begins: SENSIFY™ by Brembo enters production. Brembo Group.
This bibliography is provided for reader reference and is not exhaustive. The full report contains the complete reference list and detailed citations.
This Report Answers
- How large is the Electro-Hydraulic Brake Actuation Units Market in 2026?
- What is the 2036 value outlook for the Electro-Hydraulic Brake Actuation Units Market?
- What CAGR is expected for the Electro-Hydraulic Brake Actuation Units Market from 2026 to 2036?
- Which product type leads demand in the Electro-Hydraulic Brake Actuation Units Market?
- Which vehicle type holds the leading share in the Electro-Hydraulic Brake Actuation Units Market?
- Which sales channel is most important in the Electro-Hydraulic Brake Actuation Units Market?
- Which countries are expected to record faster pace in the Electro-Hydraulic Brake Actuation Units Market?
- What supplier capability is most important in the Electro-Hydraulic Brake Actuation Units Market?
Frequently Asked Questions
What are electro-hydraulic brake actuation units?
Electro-hydraulic units create hydraulic brake pressure for driver braking and automated braking. EV brake blending adds another operating role.
Why are electro-hydraulic units important for EVs?
EVs need smooth handoff between motor energy recovery and friction braking, so pressure control must feel natural to the driver.
How does AEB affect demand?
AEB needs fast pressure build-up without driver pedal force, which raises the value of reliable actuation units.
Which segment has the strongest revenue role?
OEM fitment is expected to hold the strongest role with 86.0% share in 2026.
Why do passenger cars lead demand?
Passenger cars carry high EV volume and wider safety feature coverage, which lifts demand for integrated actuation units.
Why is China important?
China has large EV scale and local brake electronics capability, supporting 9.2% CAGR through 2036.
Why is validation difficult?
Brake actuation affects safety and pedal feel. Fallback control means suppliers need full vehicle testing before approval.
Who are the key suppliers?
ZF Friedrichshafen AG and Robert Bosch GmbH lead the supplier group. AUMOVIO SE and ADVICS Co. Ltd. add key brake control depth. Brembo N.V. and Hyundai Mobis Co. Ltd. strengthen the wider competitive field.
Preview the report firsthand - request a free sample
Get SampleGet the brochure for pricing and purchase details.
Get PDFTable of Content
- Key Takeaways
- Market Size and CAGR
- Top Growth Driver
- Fastest Growing Segment
- Leading Region
- Key Companies
- Emerging Opportunities
- Executive Summary
- Global Market Outlook
- Demand-side Trends
- Supply-side Trends
- Technology Roadmap Analysis
- Analysis and Recommendations
- Analyst Perspective (What is happening? Why now? What should investors know?)
- Key Questions Answered
- How large is the market?
- What is the CAGR?
- What are key trends?
- Which region dominates?
- Who are the leaders?
- Market Overview
- Market Coverage / Taxonomy
- Market Definition / Scope / Limitations
- Research Methodology
- Chapter Orientation
- Analytical Lens and Working Hypotheses
- Market Structure, Signals, and Trend Drivers
- Benchmarking and Cross-market Comparability
- Market Sizing, Forecasting, and Opportunity Mapping
- Research Design and Evidence Framework
- Desk Research Programme (Secondary Evidence)
- Expert Input and Fieldwork (Primary Evidence)
- Tooling, Models, and Reference Databases
- Data Engineering and Model Build
- Quality Assurance and Audit Trail
- Market Background
- Market Dynamics (Drivers, Restraints, Opportunity, Trends)
- Scenario Forecast (Optimistic, Likely, Conservative)
- Impact Analysis
- AI Impact
- Sustainability Impact
- Regulatory Impact
- Technology Impact
- Consumer / Buyer Analysis
- Purchase Drivers
- Adoption Barriers
- Buyer Journey
- Opportunity Map Analysis
- Product Life Cycle Analysis
- Supply Chain Analysis
- Investment Feasibility Matrix
- Value Chain Analysis
- PESTLE and Porter's Analysis
- Regulatory Landscape
- Regional Parent Market Outlook
- Production and Consumption Statistics
- Import and Export Statistics
- Global Market Analysis and Forecast, 2021 to 2036
- Historical Market Size Value (USD Billion) & Volume (Unit) Analysis, 2021 to 2025
- Current and Future Market Size Value (USD Billion) & Volume (Unit) Projections, 2026 to 2036
- Y-o-Y Growth Trend Analysis
- Absolute $ Opportunity Analysis
- Global Market Pricing Analysis, 2021 to 2036
- Global Market Analysis and Forecast, By Product Type, 2021 to 2036
- Introduction / Key Findings
- Historical Market Size Value (USD Billion) & Volume (Unit) Analysis By Product Type, 2021 to 2025
- Current and Future Market Size Value (USD Billion) & Volume (Unit) Analysis and Forecast By Product Type, 2026 to 2036
- Brake boosters
- Pressure modules
- Pedal simulators
- Valve blocks
- Brake boosters
- Y-o-Y Growth Trend Analysis By Product Type, 2021 to 2025
- Absolute $ Opportunity Analysis By Product Type, 2026 to 2036
- Global Market Analysis and Forecast, By Vehicle Type, 2021 to 2036
- Introduction / Key Findings
- Historical Market Size Value (USD Billion) & Volume (Unit) Analysis By Vehicle Type, 2021 to 2025
- Current and Future Market Size Value (USD Billion) & Volume (Unit) Analysis and Forecast By Vehicle Type, 2026 to 2036
- Passenger cars
- Light commercial
- Heavy commercial
- Passenger cars
- Y-o-Y Growth Trend Analysis By Vehicle Type, 2021 to 2025
- Absolute $ Opportunity Analysis By Vehicle Type, 2026 to 2036
- Global Market Analysis and Forecast, By Propulsion, 2021 to 2036
- Introduction / Key Findings
- Historical Market Size Value (USD Billion) & Volume (Unit) Analysis By Propulsion, 2021 to 2025
- Current and Future Market Size Value (USD Billion) & Volume (Unit) Analysis and Forecast By Propulsion, 2026 to 2036
- BEV
- Hybrid
- ICE
- BEV
- Y-o-Y Growth Trend Analysis By Propulsion, 2021 to 2025
- Absolute $ Opportunity Analysis By Propulsion, 2026 to 2036
- Global Market Analysis and Forecast, By Brake Function, 2021 to 2036
- Introduction / Key Findings
- Historical Market Size Value (USD Billion) & Volume (Unit) Analysis By Brake Function, 2021 to 2025
- Current and Future Market Size Value (USD Billion) & Volume (Unit) Analysis and Forecast By Brake Function, 2026 to 2036
- Service brake
- Blended brake
- Redundant brake
- Service brake
- Y-o-Y Growth Trend Analysis By Brake Function, 2021 to 2025
- Absolute $ Opportunity Analysis By Brake Function, 2026 to 2036
- Global Market Analysis and Forecast, By Sales Channel, 2021 to 2036
- Introduction / Key Findings
- Historical Market Size Value (USD Billion) & Volume (Unit) Analysis By Sales Channel, 2021 to 2025
- Current and Future Market Size Value (USD Billion) & Volume (Unit) Analysis and Forecast By Sales Channel, 2026 to 2036
- OEM fitment
- Aftermarket
- Service replacement
- OEM fitment
- Y-o-Y Growth Trend Analysis By Sales Channel, 2021 to 2025
- Absolute $ Opportunity Analysis By Sales Channel, 2026 to 2036
- Global Market Analysis and Forecast, By Region, 2021 to 2036
- Introduction
- Historical Market Size Value (USD Billion) & Volume (Unit) Analysis By Region, 2021 to 2025
- Current Market Size Value (USD Billion) & Volume (Unit) Analysis and Forecast By Region, 2026 to 2036
- North America
- Latin America
- Western Europe
- Eastern Europe
- East Asia
- South Asia and Pacific
- Middle East & Africa
- Market Attractiveness Analysis By Region
- North America Market Analysis and Forecast, By Country, 2021 to 2036
- Historical Market Size Value (USD Billion) & Volume (Unit) Trend Analysis By Market Taxonomy, 2021 to 2025
- Market Size Value (USD Billion) & Volume (Unit) Forecast By Market Taxonomy, 2026 to 2036
- By Country
- USA
- Canada
- Mexico
- By Product Type
- By Vehicle Type
- By Propulsion
- By Brake Function
- By Sales Channel
- By Country
- Market Attractiveness Analysis
- By Country
- By Product Type
- By Vehicle Type
- By Propulsion
- By Brake Function
- By Sales Channel
- Key Takeaways
- Latin America Market Analysis and Forecast, By Country
- Historical Market Size Value (USD Billion) & Volume (Unit) Trend Analysis By Market Taxonomy, 2021 to 2025
- Market Size Value (USD Billion) & Volume (Unit) Forecast By Market Taxonomy, 2026 to 2036
- By Country
- Brazil
- Chile
- Rest of Latin America
- By Product Type
- By Vehicle Type
- By Propulsion
- By Brake Function
- By Sales Channel
- By Country
- Market Attractiveness Analysis
- By Country
- By Product Type
- By Vehicle Type
- By Propulsion
- By Brake Function
- By Sales Channel
- Key Takeaways
- Western Europe Market Analysis and Forecast, By Country
- Historical Market Size Value (USD Billion) & Volume (Unit) Trend Analysis By Market Taxonomy, 2021 to 2025
- Market Size Value (USD Billion) & Volume (Unit) Forecast By Market Taxonomy, 2026 to 2036
- By Country
- Germany
- UK
- Italy
- Spain
- France
- Nordic
- BENELUX
- Rest of Western Europe
- By Product Type
- By Vehicle Type
- By Propulsion
- By Brake Function
- By Sales Channel
- By Country
- Market Attractiveness Analysis
- By Country
- By Product Type
- By Vehicle Type
- By Propulsion
- By Brake Function
- By Sales Channel
- Key Takeaways
- Eastern Europe Market Analysis and Forecast, By Country
- Historical Market Size Value (USD Billion) & Volume (Unit) Trend Analysis By Market Taxonomy, 2021 to 2025
- Market Size Value (USD Billion) & Volume (Unit) Forecast By Market Taxonomy, 2026 to 2036
- By Country
- Russia
- Poland
- Hungary
- Balkan & Baltic
- Rest of Eastern Europe
- By Product Type
- By Vehicle Type
- By Propulsion
- By Brake Function
- By Sales Channel
- By Country
- Market Attractiveness Analysis
- By Country
- By Product Type
- By Vehicle Type
- By Propulsion
- By Brake Function
- By Sales Channel
- Key Takeaways
- East Asia Market Analysis and Forecast, By Country
- Historical Market Size Value (USD Billion) & Volume (Unit) Trend Analysis By Market Taxonomy, 2021 to 2025
- Market Size Value (USD Billion) & Volume (Unit) Forecast By Market Taxonomy, 2026 to 2036
- By Country
- China
- Japan
- South Korea
- By Product Type
- By Vehicle Type
- By Propulsion
- By Brake Function
- By Sales Channel
- By Country
- Market Attractiveness Analysis
- By Country
- By Product Type
- By Vehicle Type
- By Propulsion
- By Brake Function
- By Sales Channel
- Key Takeaways
- South Asia and Pacific Market Analysis and Forecast, By Country
- Historical Market Size Value (USD Billion) & Volume (Unit) Trend Analysis By Market Taxonomy, 2021 to 2025
- Market Size Value (USD Billion) & Volume (Unit) Forecast By Market Taxonomy, 2026 to 2036
- By Country
- India
- ASEAN
- Australia & New Zealand
- Rest of South Asia and Pacific
- By Product Type
- By Vehicle Type
- By Propulsion
- By Brake Function
- By Sales Channel
- By Country
- Market Attractiveness Analysis
- By Country
- By Product Type
- By Vehicle Type
- By Propulsion
- By Brake Function
- By Sales Channel
- Key Takeaways
- Middle East & Africa Market Analysis and Forecast, By Country
- Historical Market Size Value (USD Billion) & Volume (Unit) Trend Analysis By Market Taxonomy, 2021 to 2025
- Market Size Value (USD Billion) & Volume (Unit) Forecast By Market Taxonomy, 2026 to 2036
- By Country
- Kingdom of Saudi Arabia
- Other GCC Countries
- Türkiye
- South Africa
- Other African Union
- Rest of Middle East & Africa
- By Product Type
- By Vehicle Type
- By Propulsion
- By Brake Function
- By Sales Channel
- By Country
- Market Attractiveness Analysis
- By Country
- By Product Type
- By Vehicle Type
- By Propulsion
- By Brake Function
- By Sales Channel
- Key Takeaways
- Key Countries Market Analysis
- USA
- Pricing Analysis
- Market Share Analysis, 2025
- By Product Type
- By Vehicle Type
- By Propulsion
- By Brake Function
- By Sales Channel
- Canada
- Pricing Analysis
- Market Share Analysis, 2025
- By Product Type
- By Vehicle Type
- By Propulsion
- By Brake Function
- By Sales Channel
- Mexico
- Pricing Analysis
- Market Share Analysis, 2025
- By Product Type
- By Vehicle Type
- By Propulsion
- By Brake Function
- By Sales Channel
- Brazil
- Pricing Analysis
- Market Share Analysis, 2025
- By Product Type
- By Vehicle Type
- By Propulsion
- By Brake Function
- By Sales Channel
- Chile
- Pricing Analysis
- Market Share Analysis, 2025
- By Product Type
- By Vehicle Type
- By Propulsion
- By Brake Function
- By Sales Channel
- Germany
- Pricing Analysis
- Market Share Analysis, 2025
- By Product Type
- By Vehicle Type
- By Propulsion
- By Brake Function
- By Sales Channel
- UK
- Pricing Analysis
- Market Share Analysis, 2025
- By Product Type
- By Vehicle Type
- By Propulsion
- By Brake Function
- By Sales Channel
- Italy
- Pricing Analysis
- Market Share Analysis, 2025
- By Product Type
- By Vehicle Type
- By Propulsion
- By Brake Function
- By Sales Channel
- Spain
- Pricing Analysis
- Market Share Analysis, 2025
- By Product Type
- By Vehicle Type
- By Propulsion
- By Brake Function
- By Sales Channel
- France
- Pricing Analysis
- Market Share Analysis, 2025
- By Product Type
- By Vehicle Type
- By Propulsion
- By Brake Function
- By Sales Channel
- India
- Pricing Analysis
- Market Share Analysis, 2025
- By Product Type
- By Vehicle Type
- By Propulsion
- By Brake Function
- By Sales Channel
- ASEAN
- Pricing Analysis
- Market Share Analysis, 2025
- By Product Type
- By Vehicle Type
- By Propulsion
- By Brake Function
- By Sales Channel
- Australia & New Zealand
- Pricing Analysis
- Market Share Analysis, 2025
- By Product Type
- By Vehicle Type
- By Propulsion
- By Brake Function
- By Sales Channel
- China
- Pricing Analysis
- Market Share Analysis, 2025
- By Product Type
- By Vehicle Type
- By Propulsion
- By Brake Function
- By Sales Channel
- Japan
- Pricing Analysis
- Market Share Analysis, 2025
- By Product Type
- By Vehicle Type
- By Propulsion
- By Brake Function
- By Sales Channel
- South Korea
- Pricing Analysis
- Market Share Analysis, 2025
- By Product Type
- By Vehicle Type
- By Propulsion
- By Brake Function
- By Sales Channel
- Russia
- Pricing Analysis
- Market Share Analysis, 2025
- By Product Type
- By Vehicle Type
- By Propulsion
- By Brake Function
- By Sales Channel
- Poland
- Pricing Analysis
- Market Share Analysis, 2025
- By Product Type
- By Vehicle Type
- By Propulsion
- By Brake Function
- By Sales Channel
- Hungary
- Pricing Analysis
- Market Share Analysis, 2025
- By Product Type
- By Vehicle Type
- By Propulsion
- By Brake Function
- By Sales Channel
- Kingdom of Saudi Arabia
- Pricing Analysis
- Market Share Analysis, 2025
- By Product Type
- By Vehicle Type
- By Propulsion
- By Brake Function
- By Sales Channel
- Türkiye
- Pricing Analysis
- Market Share Analysis, 2025
- By Product Type
- By Vehicle Type
- By Propulsion
- By Brake Function
- By Sales Channel
- South Africa
- Pricing Analysis
- Market Share Analysis, 2025
- By Product Type
- By Vehicle Type
- By Propulsion
- By Brake Function
- By Sales Channel
- USA
- Market Structure Analysis
- Competition Dashboard
- Competition Benchmarking
- Market Share Analysis of Top Players
- By Regional
- By Product Type
- By Vehicle Type
- By Propulsion
- By Brake Function
- By Sales Channel
- Emerging Startups
- Innovation Benchmarking
- Competition Analysis
- Competition Deep Dive
- ZF Friedrichshafen AG
- Overview
- Product Portfolio
- Profitability by Market Segments (Product/Region/Sales Channel)
- Sales Footprint
- Strategy Overview
- Marketing Strategy
- Product Strategy
- Channel Strategy
- Robert Bosch GmbH
- AUMOVIO SE
- Brembo N.V.
- ADVICS Co. Ltd.
- Hyundai Mobis Co. Ltd.
- HL Mando Corporation
- Hitachi Astemo, Ltd.
- ZF Friedrichshafen AG
- Case Studies
- Success Stories
- Recent Developments
- Competition Deep Dive
- Assumptions & Acronyms Used


