

- Market Size (2026)
- USD 2.7 Bn
- Forecast (2036)
- USD 4.5 Bn
- CAGR (2026 to 2036)
- 5.2%
Brake Caliper and Component Remanufacturing Services Market Size, Forecast, and Outlook By FMI
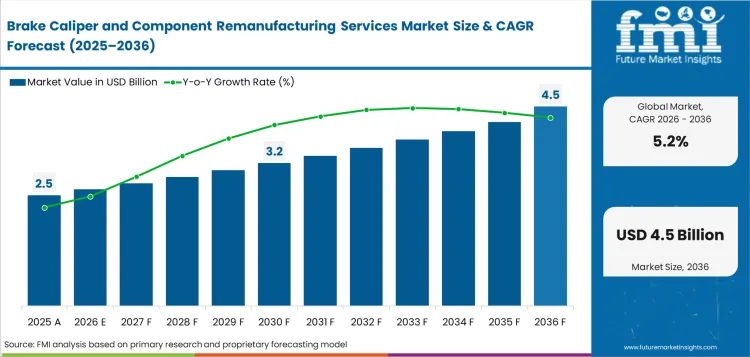
The brake caliper and component remanufacturing services market was valued at USD 2.5 billion in 2025. The market is set to reach USD 2.7 billion by 2026-end and expand at a CAGR of 5.2% between 2026 and 2036 to reach USD 4.5 billion by 2036.
Summary of the Brake Caliper and Component Remanufacturing Services Market
- Demand and Growth Drivers
- Aging vehicle fleets raise demand for remanufactured calipers as seized pistons and worn seals create repeat brake service work.
- Core return programs strengthen supply stability as remanufacturers need recoverable housings before rebuild work can begin.
- Workshop preference for tested replacement units increases service value as brake repair labor must avoid repeat fitting issues.
- Product and Segment View
- Complete caliper remanufacturing is expected to lead the service type segment with 42.0% share in 2026, reflecting installer preference for ready-fit units.
- Passenger cars are expected to lead vehicle type demand with 58.0% share in 2026, reflecting high light-vehicle brake service frequency.
- Caliper housing is expected to hold high-value component demand as recoverable castings carry the main rebuild economics.
- Geography and Competitive Outlook
- India is expected to record a CAGR of 7.2% through 2036 as vehicle production and aftermarket networks expand.
- China is projected to expand at 6.8% CAGR by 2036 as vehicle output and replacement channels deepen.
- Companies combining core recovery control with end-of-line testing are strengthening their market position during the forecast period.
- Analyst Opinion
- Nikhil Kaitwade, Principal Consultant for Automotive at FMI, says, “Brake caliper remanufacturing is becoming a core recovery and testing discipline for aftermarket programs. Passenger cars and fleet repair channels drive service demand. Coating work and rejected cores raise cost. Disciplined intake with pressure-tested output reduces installer claim risk across EPB catalogs.”
- Brake Caliper and Component Remanufacturing Services Market Value Analysis
- The brake caliper and component remanufacturing services market is moving from repair-by-need activity into exchange-based service programs.
- Adoption is driven by cost control across workshops needing tested calipers without new-part pricing.
- The market is benefiting from deeper use of remanufacturing and core returns logistics management across aftermarket networks.
- Demand is helped by automotive repair & maintenance services activity as brake jobs create regular caliper inspection points.
- Pricing pressure comes from rejected cores and pressure testing work adding labor to every unit.
Key Takeaways, Market Size, and Forecast
- The brake caliper and component remanufacturing services market was valued at USD 2.5 billion in 2025.
- By 2036, the brake caliper and component remanufacturing services market is expected to be worth USD 4.5 billion.
- From 2026 to 2036, the market is projected to expand at a CAGR of 5.2%.
- The market is projected to create an incremental opportunity of USD 1.8 billion between 2026 and 2036.
- In 2026, complete caliper remanufacturing is expected to account for 42.0% of service type demand.
- Passenger cars are expected to account for 58.0% of vehicle type demand in 2026.
- India at 7.2% and China at 6.8% are projected to record stronger country-level expansion through 2036.
Core return control is a primary concern for brake caliper remanufacturers. ZF expanded CorExpedia in April 2026 across its reman brand network. The platform helps workshops and distributors return used parts faster with less paperwork. Fleet accounts gain better used-part control through the same return process. Faster returns improve the supply of usable caliper housings for remanufacturing programs. Motorcar Parts of America states its remanufactured calipers are 100% pressure tested and fitted with 100% new dust boots and seals. These checks help installers avoid repeat brake repair work. BORG Automotive Reman lists 98% European car parc coverage and over 3,850 brake caliper item numbers. This broad range helps distributors serve common and less common vehicle models from one supplier.
Brake Caliper and Component Remanufacturing Services Market Definition
The brake caliper and component remanufacturing services market includes industrial rebuilding of used brake calipers and selected caliper parts for aftermarket reuse. These services cover teardown, cleaning, inspection, machining, coating, seal replacement, assembly, and pressure testing. Scope includes hydraulic calipers, electronic parking brake calipers, housings, pistons, brackets, seals, and guide pins. New OE caliper production, brake pad production, rotor machining, and simple used-part resale are outside the scope.
Brake Caliper and Component Remanufacturing Services Market Inclusions
Market scope covers all commercially traded brake caliper and component remanufacturing services categorized by service type, including complete caliper remanufacturing, caliper rebuild services, component replacement, surface treatment, and testing and inspection; component type, including caliper housing, pistons, seals and boots, guide pins, and brackets; vehicle type, including passenger cars, light commercial vehicles, heavy commercial vehicles, off-highway vehicles, and two-wheelers; sales channel, including independent aftermarket, warehouse distributors, fleet contracts, dealer networks, and online channels; and core source, including returned cores, salvage cores, fleet cores, dealer cores, and imported cores. Revenue scope covers 2026 to 2036. The key stakeholders include brake caliper remanufacturers, core recovery operators, component suppliers, coating service providers, testing equipment providers, warehouse distributors, fleet service firms, independent repair shops, dealer service networks, online parts sellers, and aftermarket regulatory bodies.
Brake Caliper and Component Remanufacturing Services Market Exclusions
Scope does not include new brake caliper manufacturing, brake pad production, rotor resurfacing, aircraft brakes, rail brakes, untested used calipers, or routine garage labor.
Brake Caliper and Component Remanufacturing Services Market Research Methodology
- Primary Research: FMI analysts reviewed remanufacturers, warehouse distributors, installer networks, fleet service providers, and core return handlers in important markets.
- Desk Research: Combined data from vehicle statistics, remanufacturing portfolios, repair service indexes, and brake component coverage.
- Market sizing and forecasting: Added service demand across caliper units, average rebuild value, channel margins, and core recovery rates from the bottom up.
- Data validation: Cross-checked every three months against vehicle usage, repair pricing, company portfolios, and adjacent automotive brake system & components demand.
Why is the Brake Caliper and Component Remanufacturing Services Market Growing?
- Workshops are using remanufactured calipers to reduce repair cost without relying on uncertain used components.
- Core return networks are becoming important as remanufacturers need steady housing intake for catalog availability.
- Fleet service programs use remanufactured parts to control downtime and replacement spending across repeated brake jobs.
Brake service demand is closely connected to vehicle usage and repair frequency. High road use keeps brake calipers exposed to heat and brake dust across repeated service cycles. Road contamination adds further wear as vehicles move through changing driving conditions. This operating wear creates steady replacement opportunities during scheduled brake repair work. Remanufacturers gain relevance as workshops choose tested calipers for cost-controlled replacement. Suppliers with broad catalog coverage can serve this demand better across brake system service channels.
Repair cost pressure is also visible in service pricing. The UK ONS series for maintenance and repair services of motor vehicles reached 156.2 in Q1 2026, compared with 150.9 in 2025. This pricing movement makes remanufactured calipers more relevant for installers managing customer repair bills. It also raises the need for dependable tested units. Suppliers with low claim rates can protect workshop labor and parts margin.
Market Segmentation Analysis
- Installer-ready replacement jobs keep complete caliper remanufacturing ahead, with the service type expected at 42.0% share in 2026.
- Caliper housing recovery carries strong reuse value because casting retention lowers replacement cost, placing the component at a projected 46.0% share in 2026.
- Passenger cars are central to remanufactured caliper use, accounting for 58.0% of vehicle type share in 2026 due to high-frequency brake service.
- Broad repair shop access boosts the independent aftermarket, which is forecast to hold 44.0% of sales channel share in 2026.
- Returned cores are the preferred sourcing route as organized exchange programs deepen, reaching a predicted 53.0% share in 2026.
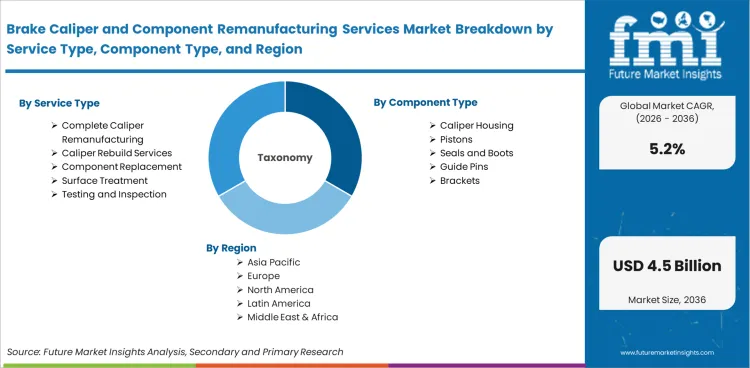
The market for brake caliper and component remanufacturing services is divided into five primary segment groups based on service type, component type, vehicle type, sales channel, and core source. Service type includes Complete Caliper Remanufacturing, Caliper Rebuild Services, Component Replacement, Surface Treatment, and Testing and Inspection. Component type includes Caliper Housing, Pistons, Seals and Boots, Guide Pins, and Brackets. Vehicle type includes Passenger Cars, Light Commercial Vehicles, Heavy Commercial Vehicles, Off-Highway Vehicles, and Two-Wheelers. Sales channel includes Independent Aftermarket, Warehouse Distributors, Fleet Contracts, Dealer Networks, and Online Channels. Core source includes Returned Cores, Salvage Cores, Fleet Cores, Dealer Cores, and Imported Cores.
Insights into Brake Caliper and Component Remanufacturing Services Market by Service Type
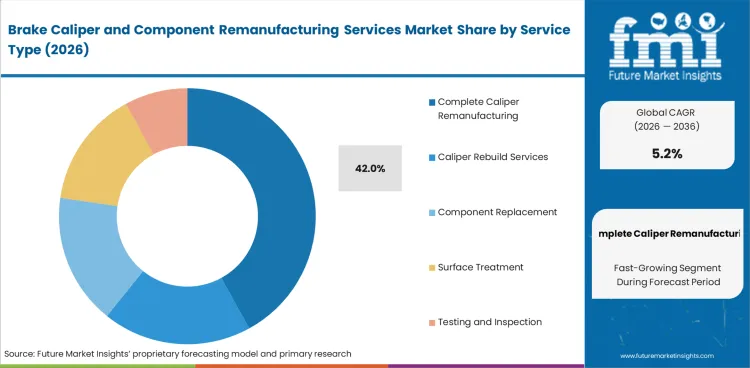
- In 2026, complete caliper remanufacturing is poised to contribute 42.0% of the service type segment. Complete assemblies help workshops reduce fitting risk across brake repair jobs.
- Rebuilt calipers with fitted seals and brackets improve service consistency. Pressure-tested hydraulic function lowers the chance of repeat labor after installation.
Insights into Brake Caliper and Component Remanufacturing Services Market by Component Type
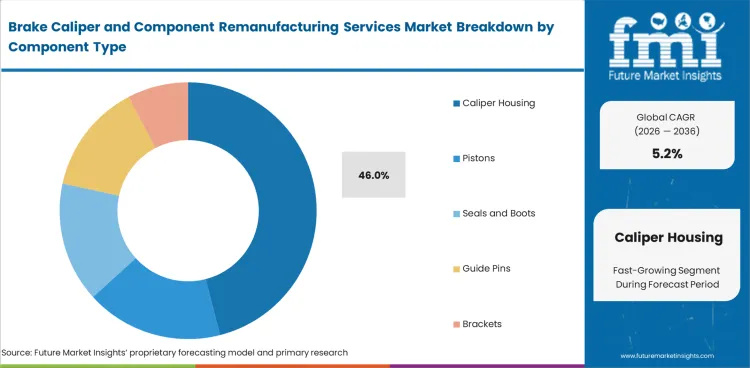
- Caliper housing is expected to hold 46.0% of the component type segment in 2026. Reusable castings carry the main rebuild value across caliper remanufacturing programs.
- Housing quality shapes recovery economics across returned cores. Bore damage and worn guide areas can move an otherwise usable unit into scrap.
Insights into Brake Caliper and Component Remanufacturing Services Market by Vehicle Type
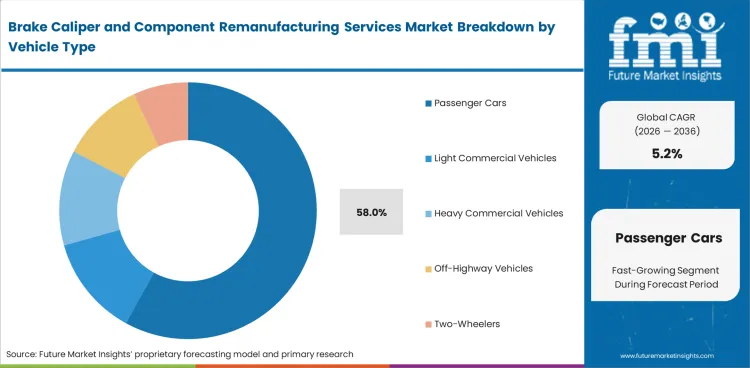
- Passenger cars are forecast to hold 58.0% of the vehicle type segment in 2026. High brake service frequency keeps caliper replacement active across common repair jobs.
- Passenger car demand connects closely with brake pad and lining replacement cycles. Workshops often identify caliper wear during routine brake inspection.
Insights into Brake Caliper and Component Remanufacturing Services Market by Sales Channel
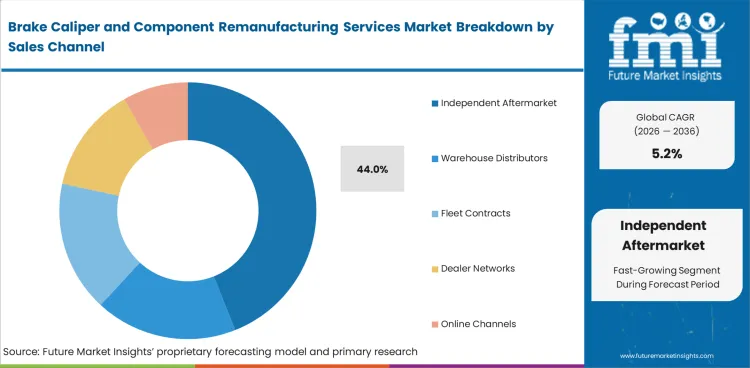
- Independent aftermarket is projected to account for 44.0% of the sales channel segment in 2026. Repair shops rely on fast part access and fitment confidence.
- Distributor stock helps installers complete brake jobs without long vehicle downtime. Hardware kits and matched caliper formats improve workshop ordering efficiency.
Insights into Brake Caliper and Component Remanufacturing Services Market by Core Source
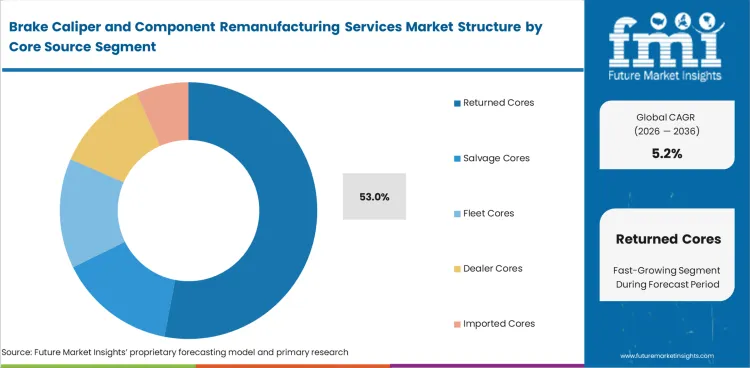
- Returned cores are predicted to hold 53.0% of the core source segment in 2026. Exchange programs keep recoverable calipers flowing back into remanufacturing systems.
- Organized return platforms improve visibility over used caliper intake. ZF expanded CorExpedia in April 2026 to strengthen core return handling across reman premium brands.
Brake Caliper and Component Remanufacturing Services Market Drivers, Restraints, and Opportunities
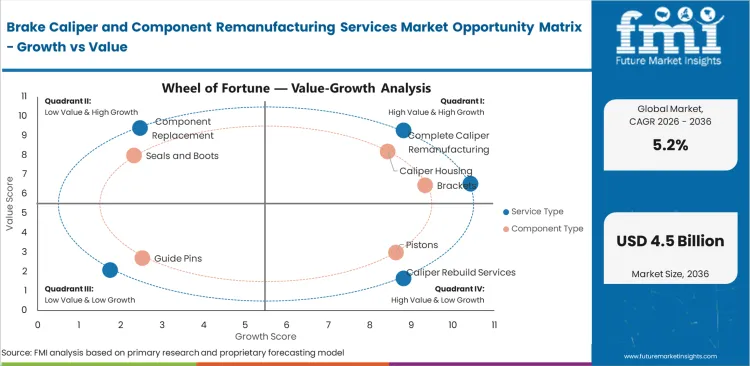
- Core return discipline is creating supply for remanufacturers across high-volume brake service channels.
- The requirement for coating lines and pressure test benches increases pricing pressure for smaller service providers.
- Electronic parking brake calipers improves service opportunity through actuator checks and controlled rebuild processes.
Brake caliper and component remanufacturing services keep growing because repair shops need installer-ready units and reliable core recovery for brake service. Core availability and quality variation can slow wider remanufacturing adoption. Growth continues through organized exchange programs and high-frequency passenger car replacement demand.
Tariff-Linked Metal Costs Lift Rebuild Quotes
Remanufactured brake caliper pricing is becoming more exposed to metal-content pass-through in comparison to labor alone. In June 2025, The White House stated that Section 232 tariffs on steel and aluminum imports would rise from 25% to 50%, effective June 4, 2025. It also noted that duties would apply to the steel and aluminum contents of imported products. Metal inputs are important for caliper remanufacturers even when the original housing is reused. Replacement pistons and slide pins rely on steady metal parts supply. Brackets and bleeder screws add further exposure to metal cost changes. Clips and casting repairs create another cost point during remanufacturing work. Service providers are using material escalators and surcharge lines for fleet accounts. Wholesale accounts are also seeing shorter quote validity as input prices change.
Higher Vehicle Use Supports Caliper Core Pricing
Brake caliper remanufacturing prices are supported by both usage-driven replacement demand and new vehicle production. In March 2026, the Federal Highway Administration reported that travel on all USA roads and streets rose by 1.6%, equal to 4.4 billion additional vehicle miles, compared with March 2025. Monthly travel was estimated at 283.2 billion vehicle miles, while cumulative 2026 travel increased 1.4% to 781.0 billion vehicle miles. Higher mileage exposes brake systems to heat and corrosion across longer service cycles. Seal wear and sticking calipers also become more common as vehicles age. This allows remanufacturers to defend core charges and rebuild labor rates. Reliable caliper availability also helps them justify turnaround premiums for repair networks.
Analysis of Brake Caliper and Component Remanufacturing Services Market By Key Countries
.webp "Top Country Growth Comparison Brake Caliper And Component Remanufacturing Services Market Cagr (2026 2036)")
| Country | CAGR |
|---|---|
| India | 7.2% |
| China | 6.8% |
| USA | 5.5% |
| Germany | 4.4% |
| UK | 3.8% |
Source: Future Market Insights, 2026.
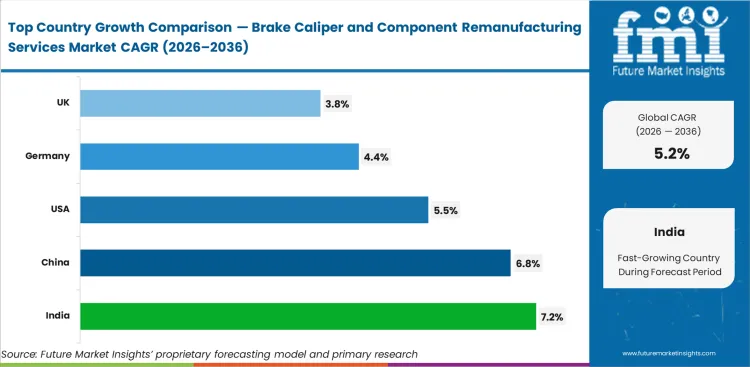
Brake Caliper and Component Remanufacturing Services Market CAGR Analysis By Country
- India is projected to register a 7.2% CAGR through 2036, supported by rising vehicle production and broader aftermarket repair access.
- China’s growth at 6.8% CAGR reflects its large vehicle output base and expanding urban repair network coverage.
- High mileage exposure keeps remanufactured caliper demand active in the USA, where the market is expected to grow at a 5.5% CAGR.
- Germany’s 4.4% CAGR indicates established service infrastructure and replacement activity across mature vehicle fleets.
- In the UK, steady brake service demand boosts a 3.8% CAGR through 2036 across remanufactured caliper channels.
Demand for brake caliper and component remanufacturing services is forecast to rise at 5.2% CAGR from 2026 to 2036. Country-level analysis covers the major markets contributing to this forecast, with the key markets listed below.
Demand Outlook for Brake Caliper and Component Remanufacturing Services Market in India
India’s brake caliper and component remanufacturing services industry is projected to record a CAGR of 7.2% through 2036. India’s vehicle production reached around 28 million units in FY 2023-24, and automobile exports reached 4.5 million units. This production base raises aftermarket scale for India brake caliper and component remanufacturing services. Local rebuilders can gain from workshops needing lower-cost replacement options across passenger cars and light commercial vehicles.
- Local vehicle production enhances demand for caliper housings and seal replacement work.
- Auto component output gives rebuilders a stronger input base for replacement parts and hardware kits.
- Domestic workshops need tested calipers reducing repeat labor during brake service jobs.
Sales Analysis of Brake Caliper and Component Remanufacturing Services Market in China
The brake caliper and component remanufacturing services sector in China is expected to expand at a CAGR of 6.8% during the assessment period. China’s large vehicle manufacturing base creates a deep aftermarket service pool for brake caliper and component remanufacturing services. New energy vehicle production adds further complexity as newer brake platforms use more varied caliper and actuator formats. This makes space for remanufacturers with strong catalog coverage and efficient core recovery systems.
- High vehicle production raises a broad addressable base for remanufactured brake calipers.
- NEV output increases exposure to electronic parking brake calipers and actuator-linked rebuild work.
- Urban repair channels need faster replacement units for passenger cars with limited workshop dwell time.
Demand Outlook for Brake Caliper and Component Remanufacturing Services Market in the United States
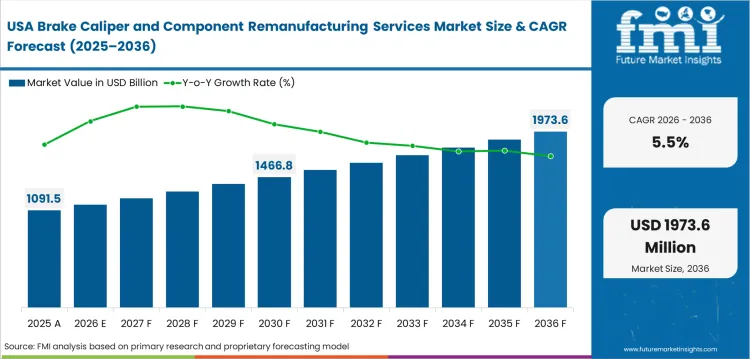
The USA brake caliper and component remanufacturing services industry is forecast to grow at a CAGR of 5.5% by 2036. USA road use continues as the main demand base for replacement brake parts. FRED’s FHWA series listed 283,207 million vehicle miles traveled in March 2026. This usage pattern increases caliper replacement through corrosion and piston seizure events. Remanufacturers with automotive brake pad wear sensor harness service adjacency can strengthen installer relationships.
- High road usage enhances frequent brake inspection and caliper replacement opportunities.
- Mature warehouse distribution favors reman calipers with verified fitment and short delivery time.
- Fleet maintenance programs value tested units reducing vehicle downtime after brake repair.
Opportunity Analysis of Brake Caliper and Component Remanufacturing Services Market in Germany
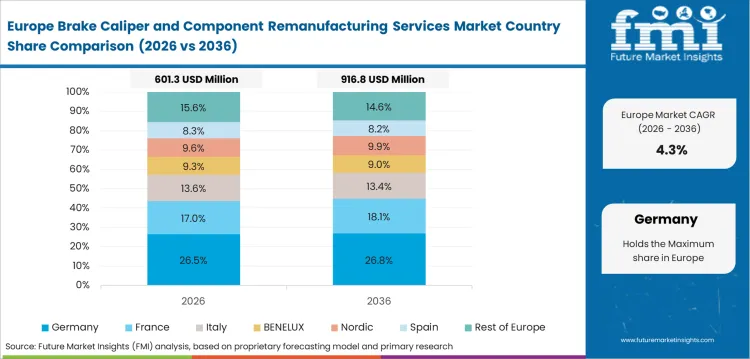
The brake caliper and component remanufacturing services segment in Germany is expected to advance at 4.4% CAGR over the forecast years. Germany has over 49 million passenger cars on the road, and car density reached 590 passenger cars per 1,000 inhabitants in 2024. This mature car parc favors Germany brake caliper and component remanufacturing services through replacement demand and core returns. Service demand is strongest for high-coverage catalogs with dependable coating and fitment control.
- Mature vehicle stock results in a steady caliper rebuild demand across independent repair channels.
- European core return systems favor suppliers with organized logistics and catalog depth.
- Advanced brake platforms increase adjacency with epb actuator and caliper module rebuild capability.
Future Outlook for Brake Caliper and Component Remanufacturing Services Market in the United Kingdom
The UK brake caliper and component remanufacturing services industry is expected to post 3.8% CAGR through 2036. The UK had 42.3 million licensed vehicles at the end of December 2025, up by 1% from December 2024. This vehicle base increases UK brake caliper and component remanufacturing services across independent repair shops and distributor networks. Remanufacturers with fast core collection and tested calipers can serve cost-sensitive repair demand.
- Licensed vehicle stock favors steady replacement demand across independent workshops.
- Repair cost pressure improves interest in tested reman units across common passenger car applications.
- UK service channels connect caliper demand with automotive brake friction products replacement cycles.
Competitive Landscape and Strategic Positioning
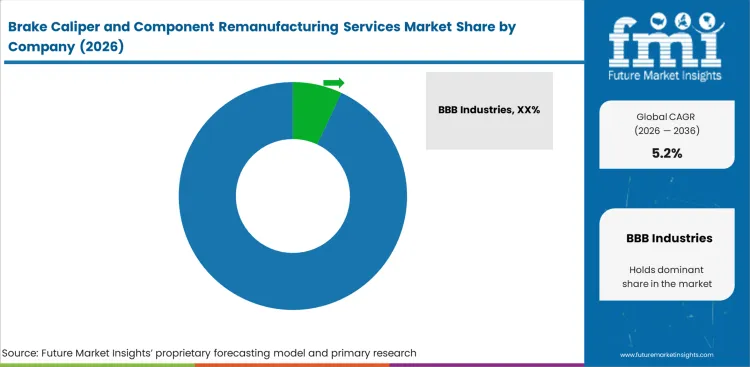
- BBB Industries and CARDONE Industries compete on North American reman coverage and disciplined core recovery programs.
- BORG Automotive Reman and ZF Aftermarket compete on European catalog reach and structured return systems.
- Specialist providers focus on caliper rebuild depth and surface treatment for low-volume vehicle applications across repair channels.
Market position in brake caliper remanufacturing is shaped by core recovery discipline and tested replacement quality. BBB Industries and CARDONE Industries serve the North American aftermarket through large distributor networks and long rebuild experience. BORG Automotive Reman holds a strong European position through car parc coverage and broad brake caliper item numbers. ZF Aftermarket adds depth through CorExpedia and reman brand coverage across ZF and TRW.
Competitive barriers are strongest in core quality control and coating cost across safety-linked brake components. Pressure testing adds another hurdle for smaller remanufacturers serving large installer networks. Smaller specialists can defend selected applications through rebuild skill and surface treatment depth across low-volume vehicles. Repeat installer orders will favor remanufacturers with dependable testing and consistent returned-core access across major repair networks.
Key Companies in the Brake Caliper and Component Remanufacturing Services Market
Key global companies leading the brake caliper and component remanufacturing services market include:
- BBB Industries, CARDONE Industries, and Motorcar Parts of America have strong remanufacturing infrastructure for North American brake service channels.
- BORG Automotive Reman, ZF Aftermarket, and Budweg Caliper serve European buyers through deep catalog coverage and core return systems.
- Bosch Automotive Aftermarket and ACDelco hold strong aftermarket positions across brake service and replacement parts coverage.
Competitive Benchmarking: Brake Caliper and Component Remanufacturing Services Market
| Company | Core Return Control | Pressure Test Depth | Catalog Coverage | Geographic Footprint |
|---|---|---|---|---|
| BBB Industries | High | High | Strong | North America and Europe |
| CARDONE Industries | High | High | Strong | North America |
| BORG Automotive Reman | High | High | Strong | Europe |
| ZF Aftermarket | High | High | Strong | Global, with strong Europe and North America coverage |
| Motorcar Parts of America | Medium | High | Strong | North America, Mexico, and selected Asia operations |
| Budweg Caliper | Medium | High | Moderate | Europe, with Denmark-based remanufacturing strength |
| Bosch Automotive Aftermarket | Medium | Medium | Strong | Global, across North America, Europe, and Asia-Pacific |
| ACDelco | Medium | Medium | Strong | Global, with strongest aftermarket coverage across North America |
Source: Future Market Insights, 2026.
Key Developments in Brake Caliper and Component Remanufacturing Services Market
- In May 2025, Remsa introduced remanufactured brake calipers manufactured in a specialized European plant. The process includes cleaning, anti-corrosion treatment, rebuilding with new components, and pressure testing. This strengthens its braking portfolio and supports circular aftermarket repair demand.
- In November 2024, BORG Automotive Reman joined the rEUman Horizon Europe research project with 19 partners to improve human-centered remanufacturing, traceability, automation, and resource regeneration. The development is relevant for brake caliper remanufacturing because BORG Automotive Reman lists brake calipers among its core remanufactured product lines.
Key Players in the Brake Caliper and Component Remanufacturing Services Market
Major Global Players:
- BBB Industries
- CARDONE Industries
- BORG Automotive Reman
- ZF Aftermarket
- Motorcar Parts of America
- Bosch Automotive Aftermarket
- ACDelco
Specialist Players:
- Budweg Caliper
- Brake Engineering
- DRI
- Elstock
Report Scope and Coverage
| Parameter | Details |
|---|---|
| Quantitative Units | USD 2.7 billion to USD 4.5 billion, at a CAGR of 5.2% |
| Market Definition | The market covers industrial rebuilding services used to restore brake calipers and selected caliper parts for aftermarket reuse. |
| Regions Covered | North America, Latin America, Europe, East Asia, South Asia and Pacific, Middle East and Africa |
| Countries Covered | USA, UK, Germany, China, India, Japan, South Korea, and 30 plus countries |
| Key Companies Profiled | BBB Industries, CARDONE Industries, BORG Automotive Reman, ZF Aftermarket, Motorcar Parts of America, Bosch Automotive Aftermarket, ACDelco |
| Forecast Period | 2026 to 2036 |
| Approach | Hybrid bottom-up and top-down methodology starting with service demand and verified repair use patterns. |
Brake Caliper and Component Remanufacturing Services Market by Segments
Brake Caliper and Component Remanufacturing Services Market Segmented by Service Type:
- Complete Caliper Remanufacturing
- Caliper Rebuild Services
- Component Replacement
- Surface Treatment
- Testing and Inspection
Brake Caliper and Component Remanufacturing Services Market Segmented by Component Type:
- Caliper Housing
- Pistons
- Seals and Boots
- Guide Pins
- Brackets
Brake Caliper and Component Remanufacturing Services Market Segmented by Vehicle Type:
- Passenger Cars
- Light Commercial Vehicles
- Heavy Commercial Vehicles
- Off-Highway Vehicles
- Two-Wheelers
Brake Caliper and Component Remanufacturing Services Market Segmented by Sales Channel:
- Independent Aftermarket
- Warehouse Distributors
- Fleet Contracts
- Dealer Networks
- Online Channels
Brake Caliper and Component Remanufacturing Services Market Segmented by Core Source:
- Returned Cores
- Salvage Cores
- Fleet Cores
- Dealer Cores
- Imported Cores
Brake Caliper and Component Remanufacturing Services Market by Region:
- North America
- USA
- Canada
- Mexico
- Latin America
- Brazil
- Chile
- Rest of Latin America
- Europe
- Germany
- UK
- Italy
- Spain
- France
- Rest of Europe
- East Asia
- China
- Japan
- South Korea
- South Asia and Pacific
- India
- ASEAN
- Australia & New Zealand
- Rest of South Asia and Pacific
- Middle East and Africa
- Saudi Arabia
- Other GCC Countries
- South Africa
- Rest of Middle East and Africa
Research Sources and Bibliography
- BORG Automotive Reman. (2026). Our products: Brake calipers.
- Federal Reserve Bank of St. Louis. (2026, May 6). Vehicle miles traveled. Source: USA Federal Highway Administration.
- Office for National Statistics. (2026, April 22). SPPI index output domestic: G4520 maintenance and repair services of motor vehicles.
- Press Information Bureau. (2025, March 25). Revolutionizing mobility: The Make in India auto story. Government of India.
- National Bureau of Statistics of China. (2025, March 18). Industrial production operation from January to February 2025.
- German Federal Statistical Office. (2025). European road traffic: Car dominance unbroken.
- Department for Transport & Driver and Vehicle Licensing Agency. (2026, April 29). Vehicle licensing statistics, United Kingdom: 2025.
- ZF. (2026, April 22). Simpler and faster: ZF streamlines core returns and accelerates circularity in the aftermarket.
- ZF. (2026, April 22). Remanufacturing of brake calipers.
- BORG Automotive Group. (2025, September 8). BORG Automotive Group marks 50th anniversary.
- Motorcar Parts of America. (2026). Calipers.
- Federal Highway Administration. (2026, May 4). Traffic volume trends: March 2026. USA Department of Transportation.
- The White House. (2025, June 3). Fact sheet: President Donald J. Trump increases Section 232 tariffs on steel and aluminum.
- BORG Automotive Reman. (2024, November 20). BORG Automotive Reman contributes to EU research project.
This Report Answers
- What is the current and future size of the brake caliper and component remanufacturing services market?
- How fast is the brake caliper and component remanufacturing services market expected to expand between 2026 and 2036?
- Which service type is expected to lead the market by 2026?
- Which vehicle type segment is expected to account for the highest demand by 2026?
- What factors are driving demand for brake caliper and component remanufacturing services globally?
- How are core return programs influencing remanufactured caliper service economics?
- Why are passenger cars the main demand base for brake caliper remanufacturing services?
- How are electronic parking brake calipers creating demand for specialized rebuild capability?
- Which countries are projected to record faster expansion through 2036?
- What is driving market expansion in India and China?
- Who are the key companies active in the brake caliper and component remanufacturing services market?
- How does FMI estimate and validate the market forecast?
Frequently Asked Questions
What is the global market demand for Brake Caliper and Component Remanufacturing Services in 2026?
In 2026, the global market for brake caliper and component remanufacturing services is expected to be worth USD 2.7 billion.
How big will the market for Brake Caliper and Component Remanufacturing Services be in 2036?
By 2036, the market for brake caliper and component remanufacturing services is expected to be worth USD 4.5 billion.
How much is demand for Brake Caliper and Component Remanufacturing Services expected to expand between 2026 and 2036?
Between 2026 and 2036, demand for brake caliper and component remanufacturing services is expected to expand at a CAGR of 5.2%.
Which service type segment is likely to be the best seller globally by 2026?
Complete Caliper Remanufacturing is expected to contribute42.0% of the service type segment in 2026.
What is causing demand to rise in India?
The India brake caliper and component remanufacturing services market is projected to record 7.2% CAGR through 2036, helped by vehicle production and aftermarket repair access.
What is causing demand to rise in China?
The China brake caliper and component remanufacturing services market is projected to expand at 6.8% CAGR through 2036, helped by large vehicle output and urban service networks.
What does this report mean by Brake Caliper and Component Remanufacturing Services Market definition?
The market includes industrial rebuilding services used to restore brake calipers and selected caliper parts for aftermarket reuse.
How does FMI make the Brake Caliper and Component Remanufacturing Services forecast and check it?
Forecasting models use a hybrid bottom-up and top-down approach, starting with service demand and checking it against repair use patterns.
Preview the report firsthand - request a free sample
Get SampleGet the brochure for pricing and purchase details.
Get PDFTable of Content
- Executive Summary
- Global Market Outlook
- Demand-side Trends
- Supply-side Trends
- Technology Roadmap Analysis
- Analysis and Recommendations
- Market Overview
- Market Coverage / Taxonomy
- Market Definition / Scope / Limitations
- Research Methodology
- Chapter Orientation
- Analytical Lens and Working Hypotheses
- Market Structure, Signals, and Trend Drivers
- Benchmarking and Cross-market Comparability
- Market Sizing, Forecasting, and Opportunity Mapping
- Research Design and Evidence Framework
- Desk Research Programme (Secondary Evidence)
- Company Annual and Sustainability Reports
- Peer-reviewed Journals and Academic Literature
- Corporate Websites, Product Literature, and Technical Notes
- Earnings Decks and Investor Briefings
- Statutory Filings and Regulatory Disclosures
- Technical White Papers and Standards Notes
- Trade Journals, Industry Magazines, and Analyst Briefs
- Conference Proceedings, Webinars, and Seminar Materials
- Government Statistics Portals and Public Data Releases
- Press Releases and Reputable Media Coverage
- Specialist Newsletters and Curated Briefings
- Sector Databases and Reference Repositories
- FMI Internal Proprietary Databases and Historical Market Datasets
- Subscription Datasets and Paid Sources
- Social Channels, Communities, and Digital Listening Inputs
- Additional Desk Sources
- Expert Input and Fieldwork (Primary Evidence)
- Primary Modes
- Qualitative Interviews and Expert Elicitation
- Quantitative Surveys and Structured Data Capture
- Blended Approach
- Why Primary Evidence is Used
- Field Techniques
- Interviews
- Surveys
- Focus Groups
- Observational and In-context Research
- Social and Community Interactions
- Stakeholder Universe Engaged
- C-suite Leaders
- Board Members
- Presidents and Vice Presidents
- R&D and Innovation Heads
- Technical Specialists
- Domain Subject-matter Experts
- Scientists
- Physicians and Other Healthcare Professionals
- Governance, Ethics, and Data Stewardship
- Research Ethics
- Data Integrity and Handling
- Primary Modes
- Tooling, Models, and Reference Databases
- Desk Research Programme (Secondary Evidence)
- Data Engineering and Model Build
- Data Acquisition and Ingestion
- Cleaning, Normalisation, and Verification
- Synthesis, Triangulation, and Analysis
- Quality Assurance and Audit Trail
- Market Background
- Market Dynamics
- Drivers
- Restraints
- Opportunity
- Trends
- Scenario Forecast
- Demand in Optimistic Scenario
- Demand in Likely Scenario
- Demand in Conservative Scenario
- Opportunity Map Analysis
- Product Life Cycle Analysis
- Supply Chain Analysis
- Investment Feasibility Matrix
- Value Chain Analysis
- PESTLE and Porter’s Analysis
- Regulatory Landscape
- Regional Parent Market Outlook
- Production and Consumption Statistics
- Import and Export Statistics
- Market Dynamics
- Global Market Analysis 2021 to 2025 and Forecast, 2026 to 2036
- Historical Market Size Value (USD Million) Analysis, 2021 to 2025
- Current and Future Market Size Value (USD Million) Projections, 2026 to 2036
- Y-o-Y Growth Trend Analysis
- Absolute $ Opportunity Analysis
- Global Market Pricing Analysis 2021 to 2025 and Forecast 2026 to 2036
- Global Market Analysis 2021 to 2025 and Forecast 2026 to 2036, By Service Type
- Introduction / Key Findings
- Historical Market Size Value (USD Million) Analysis By Service Type , 2021 to 2025
- Current and Future Market Size Value (USD Million) Analysis and Forecast By Service Type , 2026 to 2036
- Complete Caliper Remanufacturing
- Caliper Rebuild Services
- Component Replacement
- Surface Treatment
- Testing and Inspection
- Complete Caliper Remanufacturing
- Y-o-Y Growth Trend Analysis By Service Type , 2021 to 2025
- Absolute $ Opportunity Analysis By Service Type , 2026 to 2036
- Global Market Analysis 2021 to 2025 and Forecast 2026 to 2036, By Component Type
- Introduction / Key Findings
- Historical Market Size Value (USD Million) Analysis By Component Type, 2021 to 2025
- Current and Future Market Size Value (USD Million) Analysis and Forecast By Component Type, 2026 to 2036
- Caliper Housing
- Pistons
- Seals and Boots
- Guide Pins
- Brackets
- Caliper Housing
- Y-o-Y Growth Trend Analysis By Component Type, 2021 to 2025
- Absolute $ Opportunity Analysis By Component Type, 2026 to 2036
- Global Market Analysis 2021 to 2025 and Forecast 2026 to 2036, By Vehicle Type
- Introduction / Key Findings
- Historical Market Size Value (USD Million) Analysis By Vehicle Type, 2021 to 2025
- Current and Future Market Size Value (USD Million) Analysis and Forecast By Vehicle Type, 2026 to 2036
- Passenger Cars
- Light Commercial Vehicles
- Heavy Commercial Vehicles
- Off-Highway Vehicles
- Two-Wheelers
- Passenger Cars
- Y-o-Y Growth Trend Analysis By Vehicle Type, 2021 to 2025
- Absolute $ Opportunity Analysis By Vehicle Type, 2026 to 2036
- Global Market Analysis 2021 to 2025 and Forecast 2026 to 2036, By Sales Channel
- Introduction / Key Findings
- Historical Market Size Value (USD Million) Analysis By Sales Channel, 2021 to 2025
- Current and Future Market Size Value (USD Million) Analysis and Forecast By Sales Channel, 2026 to 2036
- Independent Aftermarket
- Warehouse Distributors
- Fleet Contracts
- Dealer Networks
- Online Channels
- Independent Aftermarket
- Y-o-Y Growth Trend Analysis By Sales Channel, 2021 to 2025
- Absolute $ Opportunity Analysis By Sales Channel, 2026 to 2036
- Global Market Analysis 2021 to 2025 and Forecast 2026 to 2036, By Core Source
- Introduction / Key Findings
- Historical Market Size Value (USD Million) Analysis By Core Source, 2021 to 2025
- Current and Future Market Size Value (USD Million) Analysis and Forecast By Core Source, 2026 to 2036
- Returned Cores
- Salvage Cores
- Fleet Cores
- Dealer Cores
- Imported Cores
- Returned Cores
- Y-o-Y Growth Trend Analysis By Core Source, 2021 to 2025
- Absolute $ Opportunity Analysis By Core Source, 2026 to 2036
- Global Market Analysis 2021 to 2025 and Forecast 2026 to 2036, By Region
- Introduction
- Historical Market Size Value (USD Million) Analysis By Region, 2021 to 2025
- Current Market Size Value (USD Million) Analysis and Forecast By Region, 2026 to 2036
- North America
- Latin America
- Western Europe
- Eastern Europe
- East Asia
- South Asia and Pacific
- Middle East & Africa
- Market Attractiveness Analysis By Region
- North America Market Analysis 2021 to 2025 and Forecast 2026 to 2036, By Country
- Historical Market Size Value (USD Million) Trend Analysis By Market Taxonomy, 2021 to 2025
- Market Size Value (USD Million) Forecast By Market Taxonomy, 2026 to 2036
- By Country
- USA
- Canada
- Mexico
- By Service Type
- By Component Type
- By Vehicle Type
- By Sales Channel
- By Core Source
- By Country
- Market Attractiveness Analysis
- By Country
- By Service Type
- By Component Type
- By Vehicle Type
- By Sales Channel
- By Core Source
- Key Takeaways
- Latin America Market Analysis 2021 to 2025 and Forecast 2026 to 2036, By Country
- Historical Market Size Value (USD Million) Trend Analysis By Market Taxonomy, 2021 to 2025
- Market Size Value (USD Million) Forecast By Market Taxonomy, 2026 to 2036
- By Country
- Brazil
- Chile
- Rest of Latin America
- By Service Type
- By Component Type
- By Vehicle Type
- By Sales Channel
- By Core Source
- By Country
- Market Attractiveness Analysis
- By Country
- By Service Type
- By Component Type
- By Vehicle Type
- By Sales Channel
- By Core Source
- Key Takeaways
- Western Europe Market Analysis 2021 to 2025 and Forecast 2026 to 2036, By Country
- Historical Market Size Value (USD Million) Trend Analysis By Market Taxonomy, 2021 to 2025
- Market Size Value (USD Million) Forecast By Market Taxonomy, 2026 to 2036
- By Country
- Germany
- UK
- Italy
- Spain
- France
- Nordic
- BENELUX
- Rest of Western Europe
- By Service Type
- By Component Type
- By Vehicle Type
- By Sales Channel
- By Core Source
- By Country
- Market Attractiveness Analysis
- By Country
- By Service Type
- By Component Type
- By Vehicle Type
- By Sales Channel
- By Core Source
- Key Takeaways
- Eastern Europe Market Analysis 2021 to 2025 and Forecast 2026 to 2036, By Country
- Historical Market Size Value (USD Million) Trend Analysis By Market Taxonomy, 2021 to 2025
- Market Size Value (USD Million) Forecast By Market Taxonomy, 2026 to 2036
- By Country
- Russia
- Poland
- Hungary
- Balkan & Baltic
- Rest of Eastern Europe
- By Service Type
- By Component Type
- By Vehicle Type
- By Sales Channel
- By Core Source
- By Country
- Market Attractiveness Analysis
- By Country
- By Service Type
- By Component Type
- By Vehicle Type
- By Sales Channel
- By Core Source
- Key Takeaways
- East Asia Market Analysis 2021 to 2025 and Forecast 2026 to 2036, By Country
- Historical Market Size Value (USD Million) Trend Analysis By Market Taxonomy, 2021 to 2025
- Market Size Value (USD Million) Forecast By Market Taxonomy, 2026 to 2036
- By Country
- China
- Japan
- South Korea
- By Service Type
- By Component Type
- By Vehicle Type
- By Sales Channel
- By Core Source
- By Country
- Market Attractiveness Analysis
- By Country
- By Service Type
- By Component Type
- By Vehicle Type
- By Sales Channel
- By Core Source
- Key Takeaways
- South Asia and Pacific Market Analysis 2021 to 2025 and Forecast 2026 to 2036, By Country
- Historical Market Size Value (USD Million) Trend Analysis By Market Taxonomy, 2021 to 2025
- Market Size Value (USD Million) Forecast By Market Taxonomy, 2026 to 2036
- By Country
- India
- ASEAN
- Australia & New Zealand
- Rest of South Asia and Pacific
- By Service Type
- By Component Type
- By Vehicle Type
- By Sales Channel
- By Core Source
- By Country
- Market Attractiveness Analysis
- By Country
- By Service Type
- By Component Type
- By Vehicle Type
- By Sales Channel
- By Core Source
- Key Takeaways
- Middle East & Africa Market Analysis 2021 to 2025 and Forecast 2026 to 2036, By Country
- Historical Market Size Value (USD Million) Trend Analysis By Market Taxonomy, 2021 to 2025
- Market Size Value (USD Million) Forecast By Market Taxonomy, 2026 to 2036
- By Country
- Kingdom of Saudi Arabia
- Other GCC Countries
- Turkiye
- South Africa
- Other African Union
- Rest of Middle East & Africa
- By Service Type
- By Component Type
- By Vehicle Type
- By Sales Channel
- By Core Source
- By Country
- Market Attractiveness Analysis
- By Country
- By Service Type
- By Component Type
- By Vehicle Type
- By Sales Channel
- By Core Source
- Key Takeaways
- Key Countries Market Analysis
- USA
- Pricing Analysis
- Market Share Analysis, 2025
- By Service Type
- By Component Type
- By Vehicle Type
- By Sales Channel
- By Core Source
- Canada
- Pricing Analysis
- Market Share Analysis, 2025
- By Service Type
- By Component Type
- By Vehicle Type
- By Sales Channel
- By Core Source
- Mexico
- Pricing Analysis
- Market Share Analysis, 2025
- By Service Type
- By Component Type
- By Vehicle Type
- By Sales Channel
- By Core Source
- Brazil
- Pricing Analysis
- Market Share Analysis, 2025
- By Service Type
- By Component Type
- By Vehicle Type
- By Sales Channel
- By Core Source
- Chile
- Pricing Analysis
- Market Share Analysis, 2025
- By Service Type
- By Component Type
- By Vehicle Type
- By Sales Channel
- By Core Source
- Germany
- Pricing Analysis
- Market Share Analysis, 2025
- By Service Type
- By Component Type
- By Vehicle Type
- By Sales Channel
- By Core Source
- UK
- Pricing Analysis
- Market Share Analysis, 2025
- By Service Type
- By Component Type
- By Vehicle Type
- By Sales Channel
- By Core Source
- Italy
- Pricing Analysis
- Market Share Analysis, 2025
- By Service Type
- By Component Type
- By Vehicle Type
- By Sales Channel
- By Core Source
- Spain
- Pricing Analysis
- Market Share Analysis, 2025
- By Service Type
- By Component Type
- By Vehicle Type
- By Sales Channel
- By Core Source
- France
- Pricing Analysis
- Market Share Analysis, 2025
- By Service Type
- By Component Type
- By Vehicle Type
- By Sales Channel
- By Core Source
- India
- Pricing Analysis
- Market Share Analysis, 2025
- By Service Type
- By Component Type
- By Vehicle Type
- By Sales Channel
- By Core Source
- ASEAN
- Pricing Analysis
- Market Share Analysis, 2025
- By Service Type
- By Component Type
- By Vehicle Type
- By Sales Channel
- By Core Source
- Australia & New Zealand
- Pricing Analysis
- Market Share Analysis, 2025
- By Service Type
- By Component Type
- By Vehicle Type
- By Sales Channel
- By Core Source
- China
- Pricing Analysis
- Market Share Analysis, 2025
- By Service Type
- By Component Type
- By Vehicle Type
- By Sales Channel
- By Core Source
- Japan
- Pricing Analysis
- Market Share Analysis, 2025
- By Service Type
- By Component Type
- By Vehicle Type
- By Sales Channel
- By Core Source
- South Korea
- Pricing Analysis
- Market Share Analysis, 2025
- By Service Type
- By Component Type
- By Vehicle Type
- By Sales Channel
- By Core Source
- Russia
- Pricing Analysis
- Market Share Analysis, 2025
- By Service Type
- By Component Type
- By Vehicle Type
- By Sales Channel
- By Core Source
- Poland
- Pricing Analysis
- Market Share Analysis, 2025
- By Service Type
- By Component Type
- By Vehicle Type
- By Sales Channel
- By Core Source
- Hungary
- Pricing Analysis
- Market Share Analysis, 2025
- By Service Type
- By Component Type
- By Vehicle Type
- By Sales Channel
- By Core Source
- Kingdom of Saudi Arabia
- Pricing Analysis
- Market Share Analysis, 2025
- By Service Type
- By Component Type
- By Vehicle Type
- By Sales Channel
- By Core Source
- Turkiye
- Pricing Analysis
- Market Share Analysis, 2025
- By Service Type
- By Component Type
- By Vehicle Type
- By Sales Channel
- By Core Source
- South Africa
- Pricing Analysis
- Market Share Analysis, 2025
- By Service Type
- By Component Type
- By Vehicle Type
- By Sales Channel
- By Core Source
- USA
- Market Structure Analysis
- Competition Dashboard
- Competition Benchmarking
- Market Share Analysis of Top Players
- By Regional
- By Service Type
- By Component Type
- By Vehicle Type
- By Sales Channel
- By Core Source
- Competition Analysis
- Competition Deep Dive
- BBB Industries
- Overview
- Product Portfolio
- Profitability by Market Segments (Product/Age /Sales Channel/Region)
- Sales Footprint
- Strategy Overview
- Marketing Strategy
- Product Strategy
- Channel Strategy
- CARDONE Industries
- BORG Automotive Reman
- ZF Aftermarket
- Motorcar Parts of America
- Budweg Caliper
- Bosch Automotive Aftermarket
- ACDelco
- BBB Industries
- Competition Deep Dive
- Assumptions & Acronyms Used


