

- Market Size (2026)
- USD 6.8 Bn
- Forecast (2036)
- USD 10.9 Bn
- CAGR (2026 to 2036)
- 4.8%
Brake Disc and Rotor Replacement Parts Market Size, Forecast, and Outlook By FMI
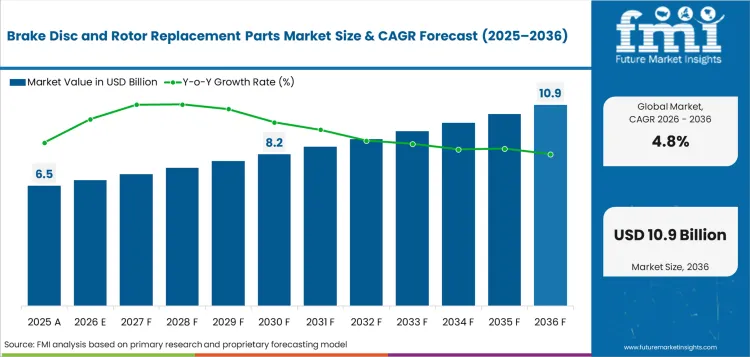
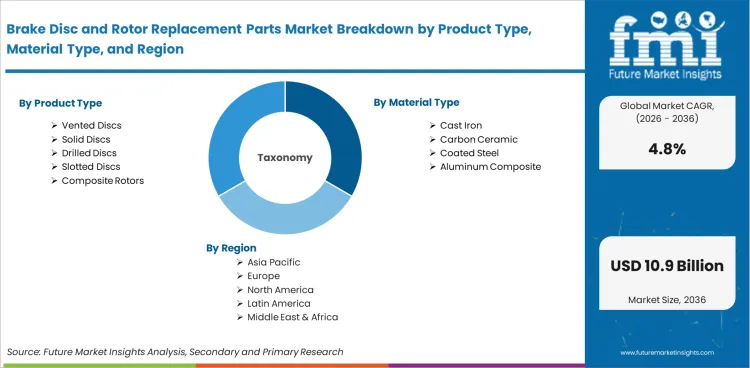
The brake disc and rotor replacement parts market was valued at USD 6.5 billion in 2025. The market value is projected to reach USD 6.8 billion by the end of 2026 and grow at a 4.8% CAGR from 2026 to 2036, crossing USD 10.9 billion by 2036.
Summary of the Brake Disc and Rotor Replacement Parts Market
- Demand and Growth Drivers
- Rotor wear cycles sustain demand for replacement parts as braking surfaces lose thickness during repeated service use.
- Aging vehicle fleets strengthen workshop demand as older cars need rotor inspection during brake pad replacement.
- EV service patterns create coated rotor demand as lower friction-brake use can raise corrosion concerns.
- Product and Segment View
- Front axle heat management keeps vented discs ahead of other product types, with the segment projected to hold 48.0% share in 2026.
- Service activity is concentrated in the independent aftermarket, which is expected to capture 64.0% share in 2026 as out-of-warranty vehicles move through garage-led replacement channels.
- Cast iron continues to support high-volume material demand because standard rotor casting offers practical cost control and broad fitment compatibility.
- Geography and Competitive Outlook
- India is expected to record a CAGR of 6.4% through 2036 as vehicle registrations and independent repair access expand.
- China is projected to expand at 5.7% CAGR by 2036 as large vehicle ownership sustains replacement volume.
- Companies combining catalog depth with coated rotor coverage are strengthening their market position during the forecast period.
- Analyst Opinion
- Nikhil Kaitwade, Principal Consultant for Automotive at FMI, says, “Brake disc replacement is becoming a planned service for garages and fleet workshops. Vehicle owners need safe braking with part availability. Cast iron rotors face cost pressure as independent garages compare options. Fitment data reduces workshop returns.”
- Brake Disc and Rotor Replacement Parts Market Value Analysis
- The brake disc and rotor replacement parts market is moving from simple wear replacement into a service parts base.
- Demand is being driven by aging vehicles and repeated brake service across passenger cars.
- The market is benefiting from wider brake system service across modern vehicles.
- Repair records support demand by linking rotor thickness with brake vibration and reliable stopping performance.
Key Takeaways, Market Size, and Forecast
- The brake disc and rotor replacement parts market was valued at USD 6.5 billion in 2025.
- By 2036, the brake disc and rotor replacement parts market is expected to be worth USD 10.9 billion.
- From 2026 to 2036, the market is projected to expand at a CAGR of 4.8%.
- The market is projected to create an incremental opportunity of USD 4.10 billion between 2026 and 2036.
- In 2026, independent aftermarket is expected to account for 64.0% of sales channel demand.
- India is projected to grow at 6.4% CAGR and China at 5.7% through 2036, placing both above most tracked country markets.
Brake rotor replacement is becoming a more technical service decision. Europe’s Euro 7 rule now brings brake emissions into vehicle type approval. UN Regulation No. 179 adds PM10 brake-particle limits measured in milligrams per kilometer. This means brake disc brands need stronger test data for future European service programs. ZF shows how important parts coverage has become, with more than 18,000 TRW braking components and 96% European vehicle parc coverage for brake discs. Distributors will prefer brands with accurate fitment data since wrong parts delay garage work. Premium replacement is also moving beyond standard cast iron rotors. Brembo’s carbon ceramic aftermarket discs offer 50% weight reduction compared with cast iron discs. EBC’s 370x32 mm two-piece discs show how performance replacement can become a repeat service opportunity through bolt-on fitment and replaceable friction rings.
Brake Disc and Rotor Replacement Parts Market Definition
The brake disc and rotor replacement parts market includes replacement rotors fitted after wear, corrosion, scoring, cracking, or thickness loss. These parts serve passenger cars, commercial vehicles, and two wheelers during routine brake service. Scope includes vented discs, solid discs, drilled discs, slotted discs, and coated rotors. Brake pads, calipers, brake fluids, and complete new vehicle brake systems are outside the scope.
Brake Disc and Rotor Replacement Parts Market Inclusions
Market scope covers all commercially traded brake disc and rotor replacement parts categorized by product type, including vented discs and solid discs; material type, including cast iron and carbon ceramic; vehicle type, including passenger cars and commercial vehicles; sales channel, including independent aftermarket and OEM service; and replacement position, including front axle and rear axle applications. Revenue scope covers 2026 to 2036. The key stakeholders include brake disc manufacturers, rotor casting companies, coating technology providers, aftermarket distributors, OEM service networks, independent garages, fleet maintenance operators, e-commerce parts platforms, performance brake brands, and regulatory bodies.
Brake Disc and Rotor Replacement Parts Market Exclusions
Scope does not include brake pads, brake linings, calipers, brake hoses, brake fluids, electronic brake modules, or complete factory-installed braking systems.
Brake Disc and Rotor Replacement Parts Market Research Methodology
- Primary Research: Primary research inputs from aftermarket distributors, brake component manufacturers, repair workshops, and fleet service specialists across key markets.
- Desk Research: Combined data from vehicle registration records, inspection statistics, company product catalogs, and brake system service requirements.
- Market sizing and forecasting: Replacement volume across vehicle classes and channel groups from the bottom up.
- Data validation: Cross-checked every three months against vehicle parc data, workshop demand, pricing signals, and company catalog coverage.
Why is the Brake Disc and Rotor Replacement Parts Market Growing?
- Vehicle age is increasing replacement need as rotors face corrosion, scoring, and thickness loss across longer ownership cycles.
- Front axle service drives higher rotor turnover as stopping load concentrates on front braking assemblies.
- Independent workshops are using catalog-based ordering as exact fitment reduces wrong-part returns and service delays.
Mileage exposure keeps rotor replacement linked to safety-focused maintenance. NHTSA’s March 2026 overview reported 39,254 USA motor vehicle traffic fatalities in 2024 and a fatality rate of 1.19 fatalities per 100 million vehicle miles traveled. Brake service does not follow fatality data directly, and safety attention keeps braking condition visible during inspections. Repair shops use vibration, scoring, and minimum thickness checks to justify rotor replacement. This service behavior protects demand for standard rotors and coated parts through the forecast period.
Vehicle parc age gives the replacement base a durable service floor. ACEA’s January 2026 report stated there were 256 million passenger cars on EU roads in 2024, with trucks averaging 14 years of age. Older fleets create more service events for braking parts after repeated heat cycles and road salt exposure. Rotor suppliers with broad fitment data and corrosion-resistant products can reduce workshop uncertainty. This condition favors catalog-rich suppliers across the brake system value chain.
Market Segmentation Analysis
- Front axle service keeps vented discs ahead in the product type mix, with the segment forecast to hold 48.0% of product type segment in 2026.
- Cast iron is the default material choice for standard rotor replacement, accounting for aprojected 71.0% share in 2026 due to cost and fitment suitability.
- Routine workshop replacement across passenger cars is expected to support 58.0% of vehicle type demand in 2026.
- Out-of-warranty repair activity continues to favor independent aftermarket channels, which are expected to capture 64.0% of sales channel demand in 2026.
- Higher braking load exposure makes the front axle the leading replacement position, with an expected 55.0% segment share in 2026.
The market for brake disc and rotor replacement parts is divided into five primary segment groups based on product type, material type, vehicle type, sales channel, and replacement position. Product type includes vented discs, solid discs, drilled discs, slotted discs, and composite rotors. Material type includes cast iron, carbon ceramic, coated steel, and aluminum composite. Vehicle type includes passenger cars, light commercial vehicles, heavy commercial vehicles, and two wheelers. Sales channel includes independent aftermarket, OEM service, e-commerce, and fleet workshops. Replacement position includes front axle, rear axle, axle sets, and performance kits.
Insights into Brake Disc and Rotor Replacement Parts Market by Product Type
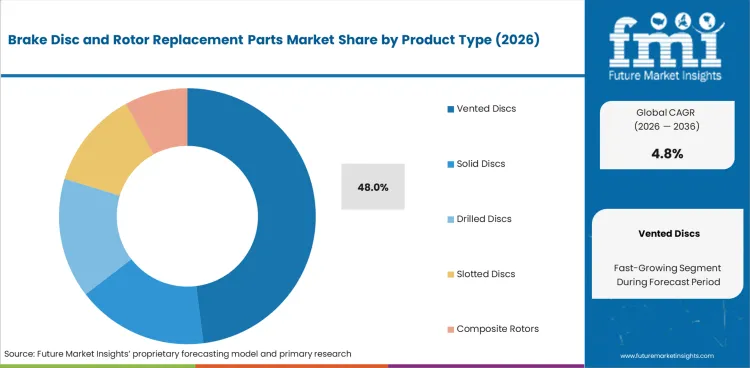
- Vented discs are expected to account for 48.0% of the product type segment in 2026. Their heat-management design makes them suitable for front brake assemblies exposed to repeated stopping cycles.
- Solid and slotted discs address selected replacement needs. Their use improves in rear axle service and performance-focused brake upgrades.
Insights into Brake Disc and Rotor Replacement Parts Market by Material Type
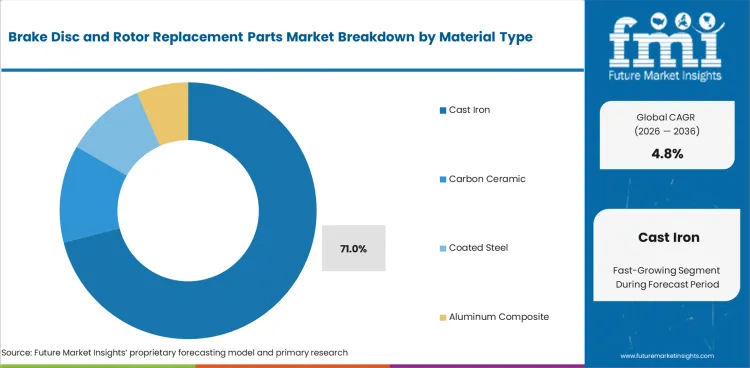
- Cast iron is expected to hold 71.0% of the material type segment in 2026. Standard replacement rotors use cast iron for stable braking surface performance and affordable machining.
- Carbon ceramic and coated steel options serve more selective demand. Their use improves in premium vehicles and corrosion-prone service conditions.
Insights into Brake Disc and Rotor Replacement Parts Market by Vehicle Type
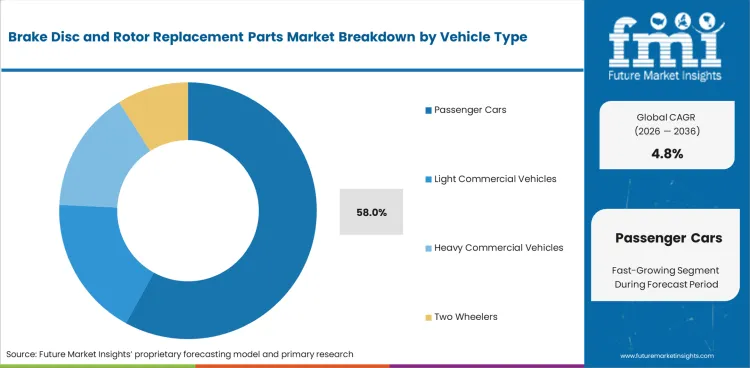
- Passenger cars are expected to contribute 58.0% share of the vehicle type segment in 2026. Daily use and large vehicle ownership make passenger cars the main replacement base.
- Light commercial vehicles create steady service demand. Fleet operators need dependable rotor availability to reduce workshop delays and keep vehicles in operation.
Insights into Brake Disc and Rotor Replacement Parts Market by Sales Channel
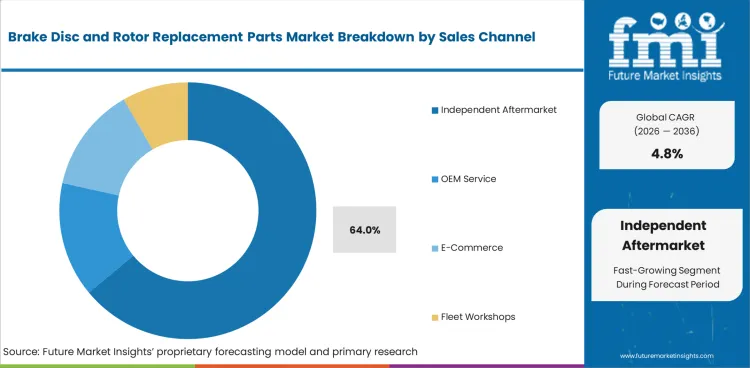
- Independent aftermarket is forecast to hold 64.0% of the sales channel segment in 2026. Garages prefer this channel for out-of-warranty service and faster part sourcing.
- OEM service channels address warranty-linked and brand-authorized repairs. E-commerce platforms improve access for workshops needing quick fitment comparison.
Insights into Brake Disc and Rotor Replacement Parts Market by Replacement Position
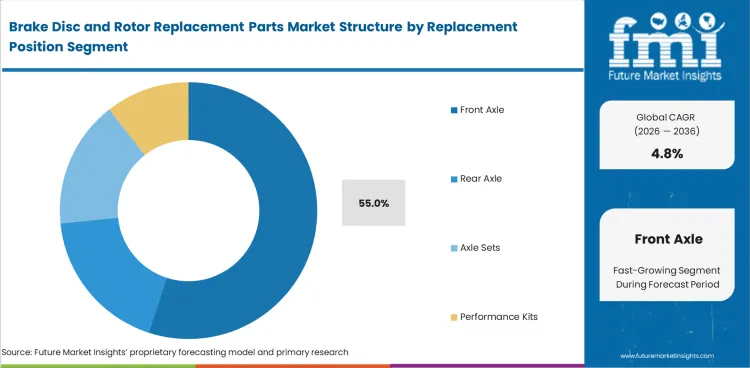
- Front axle is projected to account for 55.0% of the replacement position segment in 2026. Front rotors face higher braking load and heat exposure during regular operation.
- Rear axle and axle-set replacements address balanced brake service needs. Complete axle-set replacement helps workshops reduce uneven braking and repeat visits.
Brake Disc and Rotor Replacement Parts Market Drivers, Restraints, and Opportunities
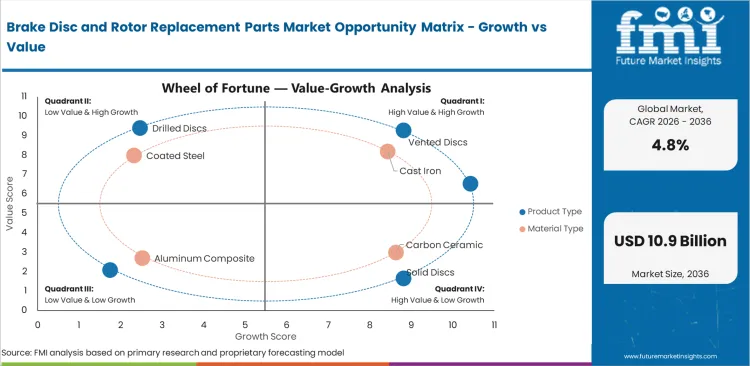
- Rotor wear pressure is creating structured demand for replacement discs across high-mileage vehicle fleets.
- Price competition in cast iron rotors increases margin pressure for smaller aftermarket brands.
- EV brake corrosion improves the service opportunity through coated rotor designs and inspection-based replacement.
Brake disc and rotor replacement parts keep growing as garages need safe braking during routine service. Fleet workshops also look for low vibration and dependable fitment. Cost pressure and private-label competition can slow premium rotor adoption. Growth continues through coated rotors and axle-set replacement as independent aftermarket channels expand service demand.
Import Prices Are Splitting Rotor Quotes
Brake disc and rotor replacement pricing is showing uneven movement as finished automotive imports and broader import cost lines are moving in different directions. As per the April 2026 USA Bureau of Labor Statistics report, USA import prices increased 1.9% after a 0.9% rise in March, while nonfuel imports rose 0.8%. Import prices for automotive vehicles, parts, and engines fell 0.1% in April. For rotor buyers this creates a mixed negotiation environment across suppliers. Some imported finished parts may offer limited relief while distributors face higher landed cost pressure. The pressure stems from metals and logistics, along with packaging costs rising. Buyers should separate finished part pricing from freight charges and cost recovery in supplier quotes.
Mileage Recovery is Holding Price Floors
Replacement rotor pricing is supported by usage-led wear and not solely by parts inflation. In March 2026, the Federal Highway Administration reported that travel on all USA roads and streets increased 1.6%, equal to 4.4 billion additional vehicle miles versus March 2025. Total travel reached an estimated 283.2 billion vehicle miles for the month, while cumulative 2026 travel rose 1.4%, or 11.1 billion vehicle miles. Brake discs and rotors are wear-sensitive parts, so higher mileage improves turnover for high-demand SKUs. This gives wholesalers and service networks less reason to discount fast-moving rotor lines, especially where inventory is already calibrated to aging vehicles and routine maintenance cycles.
Analysis of Brake Disc and Rotor Replacement Parts Market By Key Countries
.webp "Top Country Growth Comparison Brake Disc And Rotor Replacement Parts Market Cagr (2026 2036)")
| Country | CAGR |
|---|---|
| India | 6.4% |
| China | 5.7% |
| USA | 4.5% |
| Germany | 3.9% |
| UK | 3.4% |
Source: Future Market Insights, 2026.
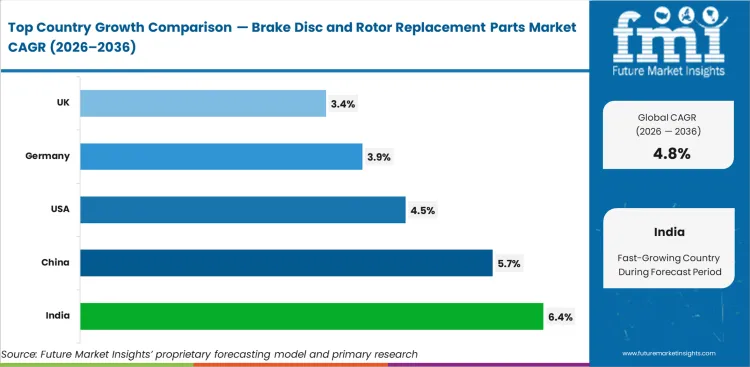
Brake Disc and Rotor Replacement Parts Market CAGR Analysis By Country
- India is projected to grow at a 6.4% CAGR through 2036, supported by rising vehicle registrations and wider access to independent repair networks.
- China’s 5.7% CAGR is linked to its large vehicle parc and added rotor service needs from EV use across urban fleets.
- High mileage exposure and established aftermarket distribution keep the USA on a steady growth path, with demand projected at a 4.5% CAGR.
- Mature service networks shape slower but stable expansion in Germany and the UK, where CAGRs are projected at 3.9% and 3.4%, respectively.
Demand for brake disc and rotor replacement parts is forecast to rise at 4.8% CAGR from 2026 to 2036. Country-level analysis covers the major markets contributing to this forecast, with the key markets listed below.
Demand Outlook for Brake Disc and Rotor Replacement Parts Market in India
India’s brake disc and rotor replacement parts industry is projected to record a CAGR of 6.4% through 2036. PIB reported in March 2025 that 2,62,07,453 total vehicles were registered on Vahan during calendar year 2024. This vehicle addition base increases future brake service potential across urban workshops and regional garages. Local distributors can benefit from better stock depth for fast-moving passenger car rotors. Independent garages need fitment clarity and affordable cast iron options for high-turnover replacement jobs.
- Large annual vehicle additions enhance future service demand for rotors and related brake parts.
- Urban garages need fast-moving SKUs for compact cars and light commercial vehicles.
- EV registrations increase inspection focus on coated rotors and brake surface corrosion.
Sales Analysis of Brake Disc and Rotor Replacement Parts Market in China
The brake disc and rotor replacement parts sector in China is expected to expand at a CAGR of 5.7% during the assessment period. As per China’s State Council’s January 2025 report, newly registered NEVs reached 11.25 million in 2024. This raises a large future service base for rotor inspection and corrosion management. Local suppliers gain from scale, but workshops need dependable rotor quality for mass-market service lanes. Coated rotor adoption can grow as electric vehicles spend less time using friction brakes.
- Large vehicle ownership sustains repeat replacement demand across city repair networks.
- NEV growth raises attention on rotor surface condition during scheduled inspection.
- Domestic manufacturing scale keeps standard rotor pricing competitive across distributor channels.
Demand Outlook for Brake Disc and Rotor Replacement Parts Market in the United States
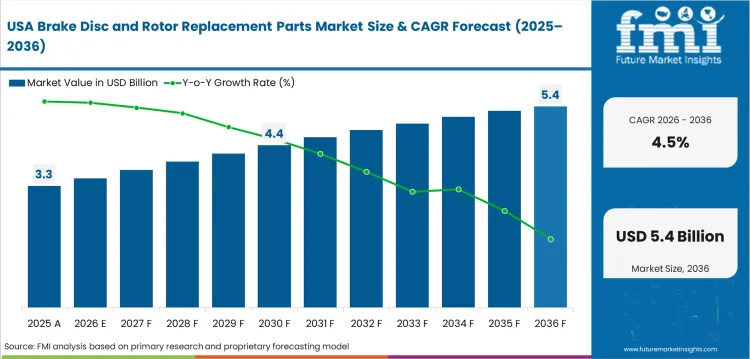
The USA brake disc and rotor replacement parts industry is forecast to grow at a CAGR of 4.5% by 2036. FHWA’s February 2026 Highway Statistics table covered annual vehicle distance travelled in 2024 by highway class and vehicle type. High mileage exposure keeps brake service active across passenger cars and light trucks. National distributors value broad catalog coverage as workshops need exact rotor size and trim-level matching. E-commerce adds convenience and return risk stays high without accurate fitment data.
- High vehicle use sustains brake inspections across commuter and light truck applications.
- Online ordering strengthens demand for accurate catalog data and application matching.
- Disc replacement links closely with automotive brake pad wear sensor harness service in newer vehicles.
Opportunity Analysis of Brake Disc and Rotor Replacement Parts Market in Germany
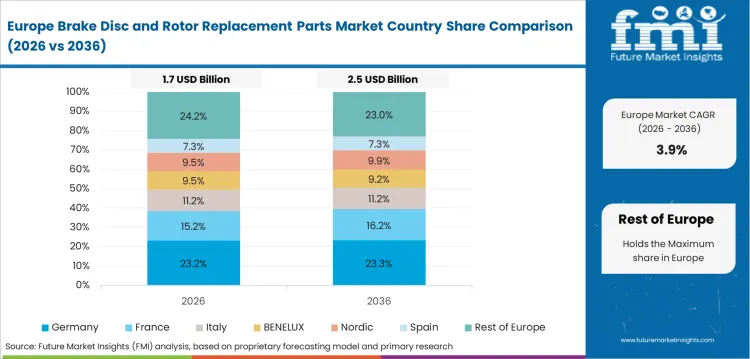
The brake disc and rotor replacement parts segment in Germany is projected to advance at 3.9% CAGR over the forecast years. KBA reported in January 2026 that Germany recorded about 2.9 million new vehicle registrations in 2025, up 1.4% from 2024. A steady vehicle base boosts recurring aftermarket demand with limited contribution from sharp volume expansion. German repair channels place high importance on braking feel, corrosion protection, and OE-quality matching. Suppliers with coated discs and verified application data can serve this service culture better.
- Mature workshop standards increase demand for reliable fitment and low-noise rotor performance.
- Coated disc demand is stronger in colder regions exposed to road salt.
- Premium vehicle service helps sustain demand for automotive brake booster and master cylinder adjacent replacements.
Future Outlook for Brake Disc and Rotor Replacement Parts Market in the United Kingdom
The UK brake disc and rotor replacement parts industry is expected to post 3.4% CAGR through 2036. GOV.UK reported in April 2026 that the UK had 42.3 million licensed vehicles at the end of 2025. This service base raises steady replacement demand through MOT-linked inspection and repair activity. Independent garages benefit from predictable brake work, but price sensitivity influences standard rotor selection. Coated rotors gain value in vehicles exposed to wet weather and seasonal road treatment.
- MOT testing keeps brake defects visible during routine ownership cycles.
- Independent workshops need affordable parts with low return risk and clear fitment records.
- Online parts ordering connects UK demand with automotive e-tailing channels.
Competitive Landscape and Strategic Positioning
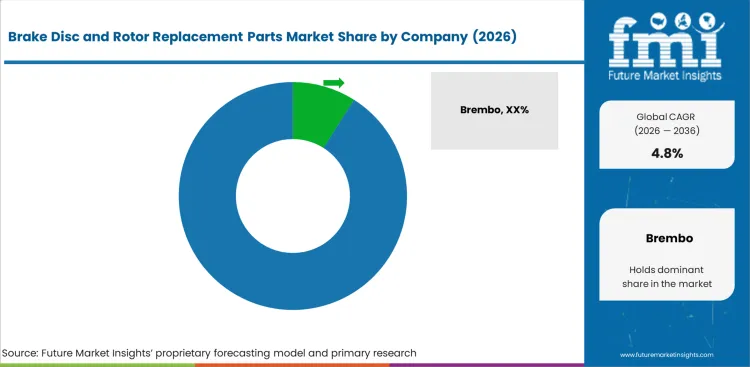
- Brembo competes on premium brake disc depth and performance service recognition across high-value replacement jobs.
- ZF TRW and Continental ATE use catalog reach and workshop-ready brake portfolios to protect service channel access.
- EBC Brakes and PowerStop address upgrade demand through coated rotors and performance kits for driving enthusiasts.
Competitive strength in brake disc and rotor replacement parts relies on vehicle coverage and repair shop trust during service decisions. Repair workshops need parts with correct dimensions and dependable availability, as wrong rotors delay service completion. Brembo has an advantage in premium replacement work through its brake disc range and performance reputation. ZF TRW serves workshop demand through strong vehicle parc coverage across Europe. Continental ATE emphasizes coated brake discs and OE-aligned service positioning. Bosch and ACDelco address mainstream repair needs through established distribution networks. Dorman Products strengthens North American coverage through frequent aftermarket catalog additions.
Competitive pressure is highest in standard cast iron rotors, as garages compare price and availability before ordering. Coating quality also separates stronger brands from low-cost alternatives in regions exposed to road salt. Exact application data is becoming a practical advantage, since incorrect part selection affects workshop time and customer trust. Brands with dependable rotor supply and updated catalogs are better placed to win repeat garage orders. Premium specialists can defend margins through performance kits and corrosion-resistant formats.
Key Companies in the Brake Disc and Rotor Replacement Parts Market
Key global companies leading the brake disc and rotor replacement parts market include:
- Brembo, ZF TRW, and Continental ATE have strong brake disc portfolios for premium and mainstream replacement demand.
- Bosch, ACDelco, and Dorman Products serve manufacturers and workshops through broad aftermarket coverage and catalog depth.
- EBC Brakes, PowerStop, and DBA hold specialist positions across coated rotors, performance kits, and upgrade applications.
Competitive Benchmarking: Brake Disc and Rotor Replacement Parts Market
| Company | Rotor Fitment Depth | Coated Rotor Coverage | Workshop Catalog Strength | Geographic Footprint |
|---|---|---|---|---|
| Brembo | High | High | Strong | Global with strong presence in Europe, North America, and Asia Pacific |
| ZF TRW | High | High | Strong | Global with strong coverage across Europe and North America |
| Continental ATE | High | High | Strong | Europe-focused with presence across North America and Asia Pacific |
| Bosch | Medium | Medium | Strong | Global with strong aftermarket reach across Europe and Asia Pacific |
| ACDelco | Medium | Medium | Strong | North America-focused with selected international aftermarket coverage |
| Dorman Products | Medium | Medium | Strong | North America-focused with strong United States aftermarket coverage |
| EBC Brakes | Medium | High | Moderate | Europe and North America with performance aftermarket reach |
| PowerStop | Medium | High | Moderate | North America-focused with strong online aftermarket coverage |
| DBA | Medium | High | Moderate | Asia Pacific with export reach across North America and Europe |
| Brakes India | Medium | Medium | Moderate | India-focused with export presence across selected global markets |
Source: Future Market Insights, 2026.
Key Developments in Brake Disc and Rotor Replacement Parts Market
- In May, 2026, ZF Aftermarket invested in an in-house brake emissions dynamometer in Spain for its TRW braking business. The facility validates brake pads and discs under Euro 7-relevant conditions, helping prepare aftermarket replacement parts for future brake dust emission requirements.
- In September, 2025, HELLA Aftermarket expanded its independent aftermarket brake portfolio by adding around 50 new brake disc article numbers, covering conventional and two-piece brake discs. The company also introduced brake pad and brake disc bundles for the independent aftermarket for the first time.
Key Players in the Brake Disc and Rotor Replacement Parts Market
Major Global Players:
- Brembo
- ZF TRW
- Continental ATE
- Bosch
- ACDelco
- Dorman Products
- Brakes India
Specialist Players:
- EBC Brakes
- PowerStop
- DBA
- Raybestos
- Zimmermann
- NAPA Brakes
Report Scope and Coverage
| Parameter | Details |
|---|---|
| Quantitative Units | USD 6.8 billion to USD 10.9 billion, at a CAGR of 4.8% |
| Market Definition | The brake disc and rotor replacement parts market covers replacement rotors used to restore braking surface condition after wear or corrosion. |
| Regions Covered | North America, Latin America, Europe, East Asia, South Asia and Pacific, Middle East and Africa |
| Countries Covered | USA, UK, Germany, China, India, Japan, South Korea, and 30 plus countries |
| Key Companies Profiled | Brembo, ZF TRW, Continental ATE, Bosch, ACDelco, Dorman Products, Brakes India, EBC Brakes, PowerStop, DBA |
| Forecast Period | 2026 to 2036 |
| Approach | Hybrid bottom-up and top-down methodology starting with vehicle parc, replacement cycles, and validated aftermarket service behavior. |
Brake Disc and Rotor Replacement Parts Market by Segments
Brake Disc and Rotor Replacement Parts Market Segmented by Product Type:
- Vented Discs
- Solid Discs
- Drilled Discs
- Slotted Discs
- Composite Rotors
Brake Disc and Rotor Replacement Parts Market Segmented by Material Type:
- Cast Iron
- Carbon Ceramic
- Coated Steel
- Aluminum Composite
Brake Disc and Rotor Replacement Parts Market Segmented by Vehicle Type:
- Passenger Cars
- Light Commercial Vehicles
- Heavy Commercial Vehicles
- Two Wheelers
Brake Disc and Rotor Replacement Parts Market Segmented by Sales Channel:
- Independent Aftermarket
- OEM Service
- E-Commerce
- Fleet Workshops
Brake Disc and Rotor Replacement Parts Market Segmented by Replacement Position:
- Front Axle
- Rear Axle
- Axle Sets
- Performance Kits
Brake Disc and Rotor Replacement Parts Market by Region:
- North America
- USA
- Canada
- Mexico
- Latin America
- Brazil
- Chile
- Rest of Latin America
- Europe
- Germany
- UK
- Italy
- Spain
- France
- Rest of Europe
- East Asia
- China
- Japan
- South Korea
- South Asia and Pacific
- India
- ASEAN
- Australia & New Zealand
- Rest of South Asia and Pacific
- Middle East and Africa
- Saudi Arabia
- Other GCC Countries
- South Africa
- Rest of Middle East and Africa
Research Sources and Bibliography
- National Highway Traffic Safety Administration. (2026, March). Overview of motor vehicle traffic crashes in 2024. USA Department of Transportation.
- Federal Highway Administration. (2026, February). Highway statistics 2024: Table VM-1. USA Department of Transportation.
- European Automobile Manufacturers’ Association. (2026, January). Vehicles on European roads 2026. ACEA.
- Driver and Vehicle Standards Agency. (2025, October). MOT class 3 and 4 vehicles: Initial failures by defect category. GOV.UK.
- State Council of the People’s Republic of China. (2025, January). New energy vehicles in use in China exceed 30 million.
- Press Information Bureau. (2025, March). Policies regarding EV charging facilities. Government of India.
- Kraftfahrt-Bundesamt. (2026, January). Fahrzeugzulassungen im Dezember 2025: Jahresbilanz.
- Department for Transport. (2026, April). Vehicle licensing statistics, United Kingdom: 2025. GOV.UK.
- Brembo. (2024, September). Brembo CCM carbon ceramic material brake discs and pads now available in the aftermarket.
- ZF Aftermarket. (2025, June). TRW offers the most comprehensive braking range in the market.
- Dorman Products. (2024, January). Dorman rolls into 2024 with more than 300 new products.
- Council of the European Union. (2024, April 12). Euro 7: Council adopts new rules on emission limits for cars, vans and trucks.
- United Nations Economic Commission for Europe. (2026, March 11). UN adopts global standard to measure and limit brake particle emissions.
- EBC Brakes. (2025, January 8). Now available: EBC Brakes Racing fully floating two-piece discs for Lotus Emira and Evora models.
- Federal Highway Administration. (2026, May 4). Traffic Volume Trends: March 2026. USA Department of Transportation. 26martvt.pdf
- USA Bureau of Labor Statistics. (2026, May 14). USA Import and Export Price Indexes summary: 2026 M04 results. USA Department of Labor. USA Import and Export Price Indexes summary - 2026 M04 Results
- HELLA GmbH & Co. KGaA. (2025, September 1). HELLA expands brake portfolio for even more comprehensive vehicle coverage. HELLA.
- ZF Friedrichshafen AG. (2026, May 13). ZF Aftermarket’s TRW brand sets benchmark for Euro 7 emission regulation readiness. ZF Press Center.
This Report Answers
- What is the current and future size of the brake disc and rotor replacement parts market?
- How fast is the brake disc and rotor replacement parts market expected to expand between 2026 and 2036?
- Which product type is expected to lead the market by 2026?
- Which sales channel is expected to account for the highest demand by 2026?
- What factors are driving demand for brake disc and rotor replacement parts globally?
- How are aging vehicle fleets influencing replacement rotor demand?
- Why is independent aftermarket the main sales channel for rotor replacement?
- How are EVs creating demand for coated rotor formats?
- Which countries are projected to record faster expansion through 2036?
- What is driving market expansion in India and China?
- Who are the key companies active in the brake disc and rotor replacement parts market?
- How does FMI estimate and validate the market forecast?
Frequently Asked Questions
What is the global market demand for Brake Disc and Rotor Replacement Parts in 2026?
In 2026, the global market for brake disc and rotor replacement parts is expected to be worth USD 6.8 billion.
How big will the market for Brake Disc and Rotor Replacement Parts be in 2036?
By 2036, the market for brake disc and rotor replacement parts is expected to be worth USD 10.9 billion.
How much is demand for Brake Disc and Rotor Replacement Parts expected to expand between 2026 and 2036?
Between 2026 and 2036, demand for brake disc and rotor replacement parts is expected to expand at a CAGR of 4.8%.
Which product type segment is expected to lead globally by 2026?
Vented discs are expected to contribute 48.0% of the product type segment in 2026.
What is causing demand to rise in India?
The India brake disc and rotor replacement parts market is projected to record 6.4% CAGR through 2036, helped by vehicle registrations and workshop expansion.
What is causing demand to rise in China?
The China brake disc and rotor replacement parts market is projected to expand at 5.7% CAGR through 2036, helped by large vehicle ownership and NEV service needs.
What does this report mean by Brake Disc and Rotor Replacement Parts Market definition?
The brake disc and rotor replacement parts market includes replacement rotors used to restore braking surface condition after wear, corrosion, scoring, or thickness loss.
How does FMI make the Brake Disc and Rotor Replacement Parts forecast and check it?
Forecasting models use a hybrid bottom-up and top-down approach, starting with vehicle parc and checking it against repair channel behavior.
Preview the report firsthand - request a free sample
Get SampleGet the brochure for pricing and purchase details.
Get PDFTable of Content
- Executive Summary
- Global Market Outlook
- Demand-side Trends
- Supply-side Trends
- Technology Roadmap Analysis
- Analysis and Recommendations
- Market Overview
- Market Coverage / Taxonomy
- Market Definition / Scope / Limitations
- Research Methodology
- Chapter Orientation
- Analytical Lens and Working Hypotheses
- Market Structure, Signals, and Trend Drivers
- Benchmarking and Cross-market Comparability
- Market Sizing, Forecasting, and Opportunity Mapping
- Research Design and Evidence Framework
- Desk Research Programme (Secondary Evidence)
- Company Annual and Sustainability Reports
- Peer-reviewed Journals and Academic Literature
- Corporate Websites, Product Literature, and Technical Notes
- Earnings Decks and Investor Briefings
- Statutory Filings and Regulatory Disclosures
- Technical White Papers and Standards Notes
- Trade Journals, Industry Magazines, and Analyst Briefs
- Conference Proceedings, Webinars, and Seminar Materials
- Government Statistics Portals and Public Data Releases
- Press Releases and Reputable Media Coverage
- Specialist Newsletters and Curated Briefings
- Sector Databases and Reference Repositories
- FMI Internal Proprietary Databases and Historical Market Datasets
- Subscription Datasets and Paid Sources
- Social Channels, Communities, and Digital Listening Inputs
- Additional Desk Sources
- Expert Input and Fieldwork (Primary Evidence)
- Primary Modes
- Qualitative Interviews and Expert Elicitation
- Quantitative Surveys and Structured Data Capture
- Blended Approach
- Why Primary Evidence is Used
- Field Techniques
- Interviews
- Surveys
- Focus Groups
- Observational and In-context Research
- Social and Community Interactions
- Stakeholder Universe Engaged
- C-suite Leaders
- Board Members
- Presidents and Vice Presidents
- R&D and Innovation Heads
- Technical Specialists
- Domain Subject-matter Experts
- Scientists
- Physicians and Other Healthcare Professionals
- Governance, Ethics, and Data Stewardship
- Research Ethics
- Data Integrity and Handling
- Primary Modes
- Tooling, Models, and Reference Databases
- Desk Research Programme (Secondary Evidence)
- Data Engineering and Model Build
- Data Acquisition and Ingestion
- Cleaning, Normalisation, and Verification
- Synthesis, Triangulation, and Analysis
- Quality Assurance and Audit Trail
- Market Background
- Market Dynamics
- Drivers
- Restraints
- Opportunity
- Trends
- Scenario Forecast
- Demand in Optimistic Scenario
- Demand in Likely Scenario
- Demand in Conservative Scenario
- Opportunity Map Analysis
- Product Life Cycle Analysis
- Supply Chain Analysis
- Investment Feasibility Matrix
- Value Chain Analysis
- PESTLE and Porter’s Analysis
- Regulatory Landscape
- Regional Parent Market Outlook
- Production and Consumption Statistics
- Import and Export Statistics
- Market Dynamics
- Global Market Analysis 2021 to 2025 and Forecast, 2026 to 2036
- Historical Market Size Value (USD Million) Analysis, 2021 to 2025
- Current and Future Market Size Value (USD Million) Projections, 2026 to 2036
- Y-o-Y Growth Trend Analysis
- Absolute $ Opportunity Analysis
- Global Market Pricing Analysis 2021 to 2025 and Forecast 2026 to 2036
- Global Market Analysis 2021 to 2025 and Forecast 2026 to 2036, By Product Type
- Introduction / Key Findings
- Historical Market Size Value (USD Million) Analysis By Product Type , 2021 to 2025
- Current and Future Market Size Value (USD Million) Analysis and Forecast By Product Type , 2026 to 2036
- Vented Discs
- Solid Discs
- Drilled Discs
- Slotted Discs
- Composite Rotors
- Vented Discs
- Y-o-Y Growth Trend Analysis By Product Type , 2021 to 2025
- Absolute $ Opportunity Analysis By Product Type , 2026 to 2036
- Global Market Analysis 2021 to 2025 and Forecast 2026 to 2036, By Material Type
- Introduction / Key Findings
- Historical Market Size Value (USD Million) Analysis By Material Type, 2021 to 2025
- Current and Future Market Size Value (USD Million) Analysis and Forecast By Material Type, 2026 to 2036
- Cast Iron
- Carbon Ceramic
- Coated Steel
- Aluminum Composite
- Cast Iron
- Y-o-Y Growth Trend Analysis By Material Type, 2021 to 2025
- Absolute $ Opportunity Analysis By Material Type, 2026 to 2036
- Global Market Analysis 2021 to 2025 and Forecast 2026 to 2036, By Vehicle Type
- Introduction / Key Findings
- Historical Market Size Value (USD Million) Analysis By Vehicle Type, 2021 to 2025
- Current and Future Market Size Value (USD Million) Analysis and Forecast By Vehicle Type, 2026 to 2036
- Passenger Cars
- Light Commercial Vehicles
- Heavy Commercial Vehicles
- Two Wheelers
- Passenger Cars
- Y-o-Y Growth Trend Analysis By Vehicle Type, 2021 to 2025
- Absolute $ Opportunity Analysis By Vehicle Type, 2026 to 2036
- Global Market Analysis 2021 to 2025 and Forecast 2026 to 2036, By Sales Channel
- Introduction / Key Findings
- Historical Market Size Value (USD Million) Analysis By Sales Channel, 2021 to 2025
- Current and Future Market Size Value (USD Million) Analysis and Forecast By Sales Channel, 2026 to 2036
- Independent Aftermarket
- OEM Service
- E-Commerce
- Fleet Workshops
- Independent Aftermarket
- Y-o-Y Growth Trend Analysis By Sales Channel, 2021 to 2025
- Absolute $ Opportunity Analysis By Sales Channel, 2026 to 2036
- Global Market Analysis 2021 to 2025 and Forecast 2026 to 2036, By Replacement Position
- Introduction / Key Findings
- Historical Market Size Value (USD Million) Analysis By Replacement Position, 2021 to 2025
- Current and Future Market Size Value (USD Million) Analysis and Forecast By Replacement Position, 2026 to 2036
- Front Axle
- Rear Axle
- Axle Sets
- Performance Kits
- Front Axle
- Y-o-Y Growth Trend Analysis By Replacement Position, 2021 to 2025
- Absolute $ Opportunity Analysis By Replacement Position, 2026 to 2036
- Global Market Analysis 2021 to 2025 and Forecast 2026 to 2036, By Region
- Introduction
- Historical Market Size Value (USD Million) Analysis By Region, 2021 to 2025
- Current Market Size Value (USD Million) Analysis and Forecast By Region, 2026 to 2036
- North America
- Latin America
- Western Europe
- Eastern Europe
- East Asia
- South Asia and Pacific
- Middle East & Africa
- Market Attractiveness Analysis By Region
- North America Market Analysis 2021 to 2025 and Forecast 2026 to 2036, By Country
- Historical Market Size Value (USD Million) Trend Analysis By Market Taxonomy, 2021 to 2025
- Market Size Value (USD Million) Forecast By Market Taxonomy, 2026 to 2036
- By Country
- USA
- Canada
- Mexico
- By Product Type
- By Material Type
- By Vehicle Type
- By Sales Channel
- By Replacement Position
- By Country
- Market Attractiveness Analysis
- By Country
- By Product Type
- By Material Type
- By Vehicle Type
- By Sales Channel
- By Replacement Position
- Key Takeaways
- Latin America Market Analysis 2021 to 2025 and Forecast 2026 to 2036, By Country
- Historical Market Size Value (USD Million) Trend Analysis By Market Taxonomy, 2021 to 2025
- Market Size Value (USD Million) Forecast By Market Taxonomy, 2026 to 2036
- By Country
- Brazil
- Chile
- Rest of Latin America
- By Product Type
- By Material Type
- By Vehicle Type
- By Sales Channel
- By Replacement Position
- By Country
- Market Attractiveness Analysis
- By Country
- By Product Type
- By Material Type
- By Vehicle Type
- By Sales Channel
- By Replacement Position
- Key Takeaways
- Western Europe Market Analysis 2021 to 2025 and Forecast 2026 to 2036, By Country
- Historical Market Size Value (USD Million) Trend Analysis By Market Taxonomy, 2021 to 2025
- Market Size Value (USD Million) Forecast By Market Taxonomy, 2026 to 2036
- By Country
- Germany
- UK
- Italy
- Spain
- France
- Nordic
- BENELUX
- Rest of Western Europe
- By Product Type
- By Material Type
- By Vehicle Type
- By Sales Channel
- By Replacement Position
- By Country
- Market Attractiveness Analysis
- By Country
- By Product Type
- By Material Type
- By Vehicle Type
- By Sales Channel
- By Replacement Position
- Key Takeaways
- Eastern Europe Market Analysis 2021 to 2025 and Forecast 2026 to 2036, By Country
- Historical Market Size Value (USD Million) Trend Analysis By Market Taxonomy, 2021 to 2025
- Market Size Value (USD Million) Forecast By Market Taxonomy, 2026 to 2036
- By Country
- Russia
- Poland
- Hungary
- Balkan & Baltic
- Rest of Eastern Europe
- By Product Type
- By Material Type
- By Vehicle Type
- By Sales Channel
- By Replacement Position
- By Country
- Market Attractiveness Analysis
- By Country
- By Product Type
- By Material Type
- By Vehicle Type
- By Sales Channel
- By Replacement Position
- Key Takeaways
- East Asia Market Analysis 2021 to 2025 and Forecast 2026 to 2036, By Country
- Historical Market Size Value (USD Million) Trend Analysis By Market Taxonomy, 2021 to 2025
- Market Size Value (USD Million) Forecast By Market Taxonomy, 2026 to 2036
- By Country
- China
- Japan
- South Korea
- By Product Type
- By Material Type
- By Vehicle Type
- By Sales Channel
- By Replacement Position
- By Country
- Market Attractiveness Analysis
- By Country
- By Product Type
- By Material Type
- By Vehicle Type
- By Sales Channel
- By Replacement Position
- Key Takeaways
- South Asia and Pacific Market Analysis 2021 to 2025 and Forecast 2026 to 2036, By Country
- Historical Market Size Value (USD Million) Trend Analysis By Market Taxonomy, 2021 to 2025
- Market Size Value (USD Million) Forecast By Market Taxonomy, 2026 to 2036
- By Country
- India
- ASEAN
- Australia & New Zealand
- Rest of South Asia and Pacific
- By Product Type
- By Material Type
- By Vehicle Type
- By Sales Channel
- By Replacement Position
- By Country
- Market Attractiveness Analysis
- By Country
- By Product Type
- By Material Type
- By Vehicle Type
- By Sales Channel
- By Replacement Position
- Key Takeaways
- Middle East & Africa Market Analysis 2021 to 2025 and Forecast 2026 to 2036, By Country
- Historical Market Size Value (USD Million) Trend Analysis By Market Taxonomy, 2021 to 2025
- Market Size Value (USD Million) Forecast By Market Taxonomy, 2026 to 2036
- By Country
- Kingdom of Saudi Arabia
- Other GCC Countries
- Turkiye
- South Africa
- Other African Union
- Rest of Middle East & Africa
- By Product Type
- By Material Type
- By Vehicle Type
- By Sales Channel
- By Replacement Position
- By Country
- Market Attractiveness Analysis
- By Country
- By Product Type
- By Material Type
- By Vehicle Type
- By Sales Channel
- By Replacement Position
- Key Takeaways
- Key Countries Market Analysis
- USA
- Pricing Analysis
- Market Share Analysis, 2025
- By Product Type
- By Material Type
- By Vehicle Type
- By Sales Channel
- By Replacement Position
- Canada
- Pricing Analysis
- Market Share Analysis, 2025
- By Product Type
- By Material Type
- By Vehicle Type
- By Sales Channel
- By Replacement Position
- Mexico
- Pricing Analysis
- Market Share Analysis, 2025
- By Product Type
- By Material Type
- By Vehicle Type
- By Sales Channel
- By Replacement Position
- Brazil
- Pricing Analysis
- Market Share Analysis, 2025
- By Product Type
- By Material Type
- By Vehicle Type
- By Sales Channel
- By Replacement Position
- Chile
- Pricing Analysis
- Market Share Analysis, 2025
- By Product Type
- By Material Type
- By Vehicle Type
- By Sales Channel
- By Replacement Position
- Germany
- Pricing Analysis
- Market Share Analysis, 2025
- By Product Type
- By Material Type
- By Vehicle Type
- By Sales Channel
- By Replacement Position
- UK
- Pricing Analysis
- Market Share Analysis, 2025
- By Product Type
- By Material Type
- By Vehicle Type
- By Sales Channel
- By Replacement Position
- Italy
- Pricing Analysis
- Market Share Analysis, 2025
- By Product Type
- By Material Type
- By Vehicle Type
- By Sales Channel
- By Replacement Position
- Spain
- Pricing Analysis
- Market Share Analysis, 2025
- By Product Type
- By Material Type
- By Vehicle Type
- By Sales Channel
- By Replacement Position
- France
- Pricing Analysis
- Market Share Analysis, 2025
- By Product Type
- By Material Type
- By Vehicle Type
- By Sales Channel
- By Replacement Position
- India
- Pricing Analysis
- Market Share Analysis, 2025
- By Product Type
- By Material Type
- By Vehicle Type
- By Sales Channel
- By Replacement Position
- ASEAN
- Pricing Analysis
- Market Share Analysis, 2025
- By Product Type
- By Material Type
- By Vehicle Type
- By Sales Channel
- By Replacement Position
- Australia & New Zealand
- Pricing Analysis
- Market Share Analysis, 2025
- By Product Type
- By Material Type
- By Vehicle Type
- By Sales Channel
- By Replacement Position
- China
- Pricing Analysis
- Market Share Analysis, 2025
- By Product Type
- By Material Type
- By Vehicle Type
- By Sales Channel
- By Replacement Position
- Japan
- Pricing Analysis
- Market Share Analysis, 2025
- By Product Type
- By Material Type
- By Vehicle Type
- By Sales Channel
- By Replacement Position
- South Korea
- Pricing Analysis
- Market Share Analysis, 2025
- By Product Type
- By Material Type
- By Vehicle Type
- By Sales Channel
- By Replacement Position
- Russia
- Pricing Analysis
- Market Share Analysis, 2025
- By Product Type
- By Material Type
- By Vehicle Type
- By Sales Channel
- By Replacement Position
- Poland
- Pricing Analysis
- Market Share Analysis, 2025
- By Product Type
- By Material Type
- By Vehicle Type
- By Sales Channel
- By Replacement Position
- Hungary
- Pricing Analysis
- Market Share Analysis, 2025
- By Product Type
- By Material Type
- By Vehicle Type
- By Sales Channel
- By Replacement Position
- Kingdom of Saudi Arabia
- Pricing Analysis
- Market Share Analysis, 2025
- By Product Type
- By Material Type
- By Vehicle Type
- By Sales Channel
- By Replacement Position
- Turkiye
- Pricing Analysis
- Market Share Analysis, 2025
- By Product Type
- By Material Type
- By Vehicle Type
- By Sales Channel
- By Replacement Position
- South Africa
- Pricing Analysis
- Market Share Analysis, 2025
- By Product Type
- By Material Type
- By Vehicle Type
- By Sales Channel
- By Replacement Position
- USA
- Market Structure Analysis
- Competition Dashboard
- Competition Benchmarking
- Market Share Analysis of Top Players
- By Regional
- By Product Type
- By Material Type
- By Vehicle Type
- By Sales Channel
- By Replacement Position
- Competition Analysis
- Competition Deep Dive
- Brembo
- Overview
- Product Portfolio
- Profitability by Market Segments (Product/Age /Sales Channel/Region)
- Sales Footprint
- Strategy Overview
- Marketing Strategy
- Product Strategy
- Channel Strategy
- ZF TRW
- Continental ATE
- Bosch
- ACDelco
- Dorman Products
- EBC Brakes
- PowerStop
- DBA
- Brakes India
- Brembo
- Competition Deep Dive
- Assumptions & Acronyms Used


