

- Market Size (2026)
- USD 1.5 Bn
- Forecast (2036)
- USD 2.9 Bn
- CAGR (2026 to 2036)
- 6.8%
Electronic Braking Systems for Heavy-Duty Trucks Market Size, Market Forecast and Outlook By FMI
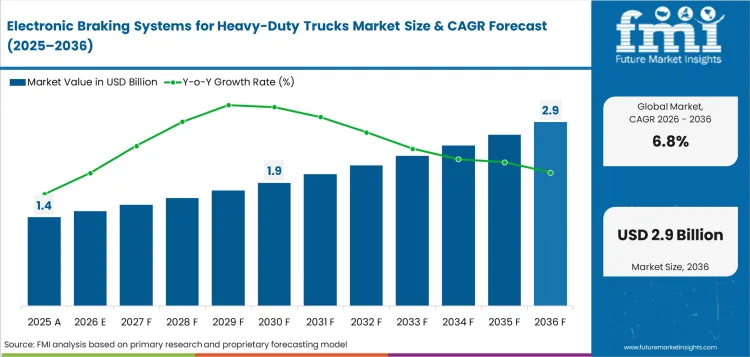
The electronic braking systems for heavy-duty trucks market was valued at USD 1.4 billion in 2025. The market is projected to reach USD 1.5 billion by 2026-end and expand at a CAGR of 6.8% between 2026 and 2036 to reach USD 2.9 billion by 2036. OEM channels are expected to lead with a 72.0% sales channel share, and Class 8 trucks are expected to lead the vehicle class segment with a 46.0% share.
Summary of the Electronic Braking Systems for Heavy-Duty Trucks Market
- Demand and Growth Drivers
- Safety regulation raises demand for electronic braking systems as truck makers prepare new vehicle platforms for active safety functions.
- Electric truck design lifts system value as service braking must coordinate with energy recovery controls.
- Fleet uptime pressure raises demand for diagnostic-ready braking electronics across high-mileage freight trucks.
- Product and Segment View
- OEM channels are expected to lead the sales channel segment with 72.0% share in 2026, reflecting factory-level system validation.
- Class 8 trucks are expected to lead the vehicle class demand with 46.0% share in 2026, reflecting long-haul braking exposure.
- Electronic control units are expected to hold high-value component demand as brake command and fault handling rely on central control.
- Geography and Competitive Outlook
- India is expected to record a CAGR of 8.0% through 2036, aided by fleet renewal and higher safety content.
- China is projected to expand at 7.6% CAGR by 2036, as electric heavy trucks need brake software coordination.
- Companies combining EBS control depth with truck OEM access are strengthening competitive positions during the forecast period.
- Analyst Opinion
- Nikhil Kaitwade, Principal Consultant for Automotive at FMI, says, “Heavy-duty truck braking is shifting toward electronic control discipline as safety systems enter platform planning. Fleet teams need faster response with trailer coordination. Aftermarket sensors raise service costs while validated EBS software and actuator depth reduce truck-maker integration risk.”
- Electronic Braking Systems for Heavy-Duty Trucks Market Value Analysis
- The electronic braking systems for heavy-duty trucks market is moving from stand-alone brake hardware into integrated safety control architecture.
- Safety regulations and factory-fit planning are increasing use of electronic braking systems across commercial vehicle platforms.
- The market is benefiting from deeper use of brake system electronics across high-mileage freight operations.
- Brake response documentation strengthens market use as active safety and stability control compliance needs rise.
Key Takeaways, Market Size and Forecast
- The electronic braking systems for heavy-duty trucks market was valued at USD 1.4 billion in 2025.
- By 2036, the electronic braking systems for heavy-duty trucks market is expected to be worth USD 2.9 billion.
- From 2026 to 2036, the market is projected to expand at a CAGR of 6.8%.
- The market is projected to create an incremental opportunity of USD 1.4 billion between 2026 and 2036.
- In 2026, OEM channels are expected to account for 72.0% of sales channel demand.
- India at 8.0% and China at 7.6% are projected to outpace several established country markets through 2036.
Compliance and safety needs are pushing truck braking systems toward electronic control. Germany’s Federal Ministry for Digital and Transport stated in July 2024 that new vehicle safety systems are becoming mandatory across defined vehicle groups, including functions such as emergency braking for commercial vehicles. OEMs need braking systems able to work with active safety functions and vehicle approval planning. ZF’s Braking and eDrive Synergy Program integrates electric drive functions with EBS brake control, making brake software more important for electric truck platforms. Knorr-Bremse reported in May 2025 that redundant braking and steering functions had been fully integrated in an approved on-road driverless truck project, so fail-safe braking is becoming important for automated freight programs. SAF-HOLLAND’s May 2026 investor presentation lists trailer EBS and ABS in its product portfolio and cites around 10,000 spare parts dealers and service stations in over 80 countries, which makes service coverage a practical buying factor for fleets.
Electronic Braking Systems for Heavy-Duty Trucks Market Definition
The electronic braking systems for heavy-duty trucks market includes electronically controlled brake systems used on medium and heavy truck platforms. These systems include electronic control units, wheel sensors, modulators, actuators, and valves used for brake command. Scope includes EBS, ESC, ABS, AEBS, and brake-by-wire functions for freight and vocational trucks. Passenger car brake systems and basic friction brake parts are outside the scope.
Electronic Braking Systems for Heavy-Duty Trucks Market Inclusions
Market scope covers all commercially traded electronic braking systems for heavy-duty trucks categorized by system type, including electronic braking systems, electronic stability control, anti-lock braking systems, automatic emergency braking, and brake-by-wire systems; components, including electronic control units, wheel sensors, brake modulators, brake actuators, and brake valves; vehicle class, including Class 8 trucks, Class 7 trucks, Class 6 trucks, and heavy tractors; sales channel, including OEM fitment and aftermarket replacement; and applications, including long haul freight, regional haul, construction trucks, and mining trucks. Revenue scope covers 2026 to 2036. The key stakeholders include heavy-duty truck manufacturers, braking system suppliers, ECU and sensor providers, actuator and valve manufacturers, fleet operators, trailer system integrators, commercial vehicle service networks, aftermarket distributors, testing agencies, and regulatory bodies.
Electronic Braking Systems for Heavy-Duty Trucks Market Exclusions
Scope does not include passenger car braking systems, rail braking equipment, basic brake pads, trailer-only mechanical parts, or automotive brake shims.
Electronic Braking Systems for Heavy-Duty Trucks Market Research Methodology
- Primary Research: FMI analysts spoke to truck manufacturers, braking system suppliers, fleet service teams, and commercial vehicle parts distributors in important markets.
- Desk Research: Combined data from vehicle safety rules, supplier product portfolios, truck production records, and brake system technical references.
- Market sizing and forecasting: Added system value across truck classes and sales channels from the bottom up.
- Data validation: Cross-checked every three months against truck fitment trends, safety rule timing, and company portfolio coverage.
Why is the Electronic Braking Systems for Heavy-Duty Trucks Market Growing?
- Truck makers are using electronic braking earlier to meet active safety and stability control requirements.
- Electric heavy trucks need coordinated braking between service brakes and energy recovery systems.
- Freight operators are selecting systems able to reduce brake imbalance and workshop fault-finding time.
European safety timelines are making electronic braking part of core truck design. Germany’s transport ministry notes new EU vehicle safety measures apply across fixed timetable stages, with first-registration stage B starting on 7 July 2024. This rule timing makes factory validation important for truck makers and brake system suppliers. EBS platforms with automotive active safety system integration help manufacturers align brake response with warning and intervention functions.
Electric heavy truck programs create new value for brake control software. IEA reported in 2025 electric truck sales grew by almost 80% in 2024, making brake blending a stronger design issue for high-voltage platforms. This holds significance for EBS suppliers as regenerative braking must hand over smoothly to friction braking. Control software and regenerative brake control module depth can help protect pedal feel and brake stability.
Market Segmentation Analysis
- Electronic braking system is projected to hold 38.0% of system type demand in 2026 as tractor-trailer platforms need faster brake signaling and balanced stopping control.
- Brake command functions keep electronic control units central to the component mix, with the segment expected to account for 32.0% share in 2026.
- Class 8 trucks are expected to represent 46.0% of vehicle class value in 2026 as long-haul tractors carry heavier braking loads across freight corridors.
- OEM channels are forecast to capture 72.0% of sales channel revenue in 2026 since truck makers prefer factory-tested EBS calibration during platform assembly.
- Long haul freight is expected to account for 41.0% of application use in 2026 as high-mileage fleets need stable brake response across loaded operations.
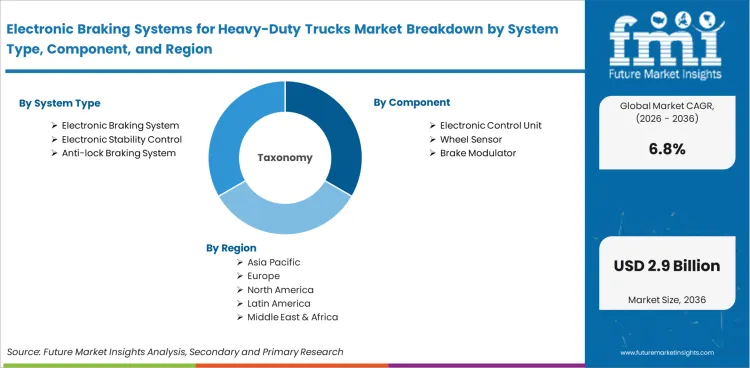
The market for electronic braking systems for heavy-duty trucks is divided into groups based on system type, component, vehicle class, sales channel, application, and region. There are electronic braking systems, electronic stability control systems, anti-lock braking systems, automatic emergency braking systems, and brake-by-wire systems under system type. By component, the market includes electronic control units, wheel sensors, brake modulators, brake actuators, and brake valves. By vehicle class, the market covers Class 8 trucks, Class 7 trucks, Class 6 trucks, and heavy tractors. Based on sales channel, it includes OEM fitment and aftermarket replacement. By application, the market includes long haul freight, regional haul, construction trucks, and mining trucks.
Insights into Electronic Braking Systems for Heavy-Duty Trucks Market by System Type
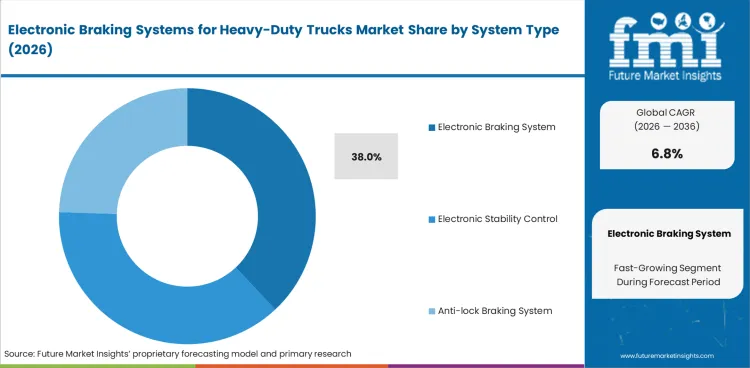
- In 2026, electronic braking systems are expected to contribute 38.0% of the system type segment. EBS platforms support faster brake command across tractor and trailer combinations.
- Automatic emergency braking and brake-by-wire systems address selected safety programs. Their value improves in trucks requiring sensor-based intervention and brake control designed for brake-by-wire transition.
Insights into Electronic Braking Systems for Heavy-Duty Trucks Market by Component
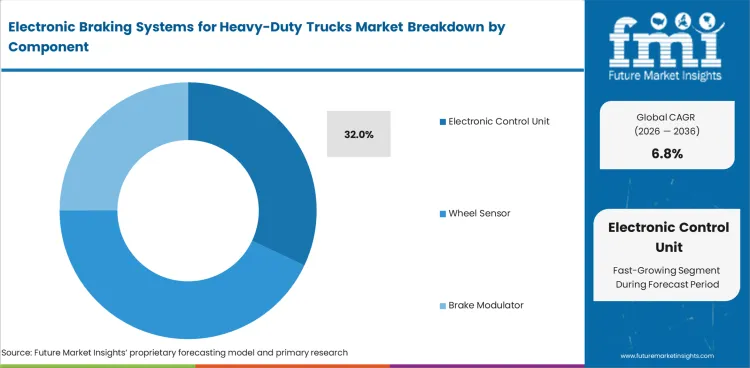
- Electronic control units are projected to account for 32.0% of the component segment in 2026. Brake ECUs manage sensor input and actuator response across heavy-duty truck platforms.
- Brake modulators and wheel sensors enhance braking accuracy during daily fleet use. Their replacement value improves as diagnostic systems identify electronic brake faults earlier.
Insights into Electronic Braking Systems for Heavy-Duty Trucks Market by Vehicle Class
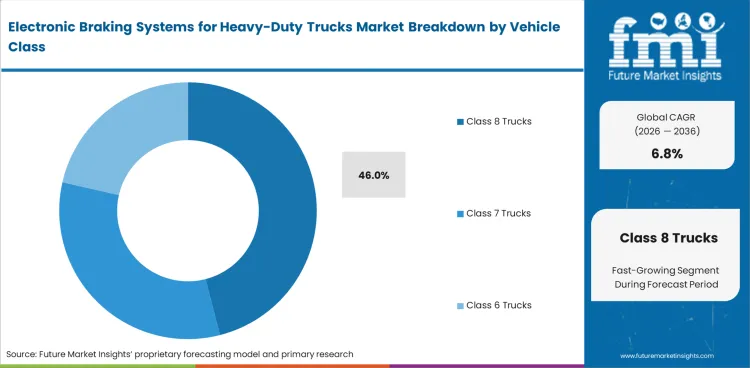
- Class 8 trucks are forecast to account for 46.0% share in 2026. Long-haul tractors require reliable brake control for heavy payloads and highway operating conditions.
- Class 7 and Class 6 trucks address regional delivery and vocational operations. Their demand improves as fleet operators add safety electronics to medium-heavy platforms.
Insights into Electronic Braking Systems for Heavy-Duty Trucks Market by Sales Channel
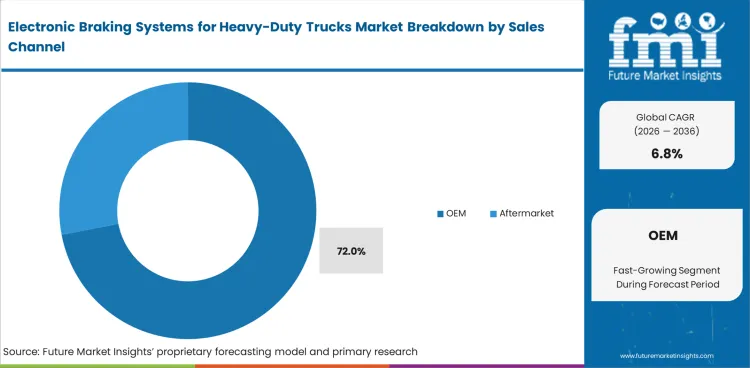
- OEM channels are expected to hold 72.0% share in 2026. Truck makers prefer factory-fitted EBS for calibration control and safety system validation.
- Aftermarket sales favor replacement needs across sensors and control units. Service demand improves as fleets extend truck use and repair electronic brake faults.
Insights into Electronic Braking Systems for Heavy-Duty Trucks Market by Application
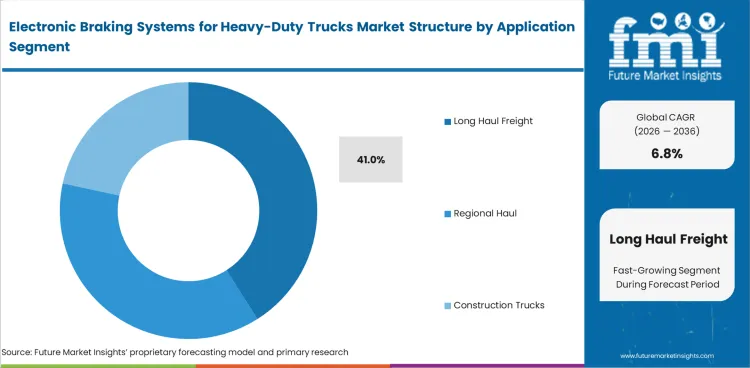
- In 2026, long haul freight is expected to represent 41.0% share. High-mileage fleets need stable braking control across tractor-trailer operations and loaded routes.
- Regional haul and construction trucks raise demand in shorter duty cycles. Their value improves as operators seek better brake response and lower service disruption.
Electronic Braking Systems for Heavy-Duty Trucks Market Drivers, Restraints, and Opportunities
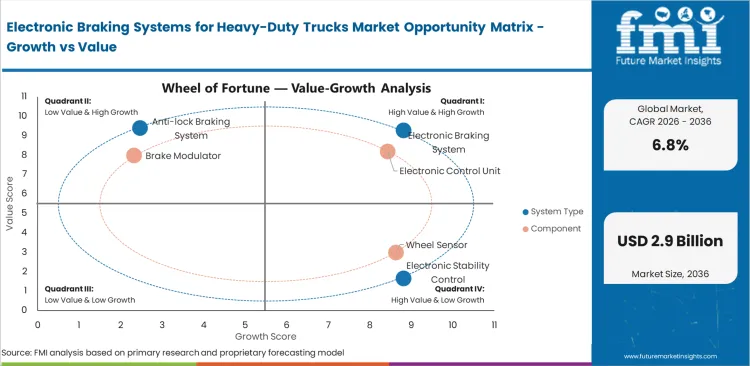
- Safety compliance raises demand for electronic braking across new heavy truck platforms.
- Electric drivetrains improve service opportunity through brake blending and recovery control software.
- Trailer mismatch increases a restraint as older fleets cannot always capture full EBS benefit.
Electronic braking systems for heavy-duty trucks keep expanding as fleets need faster brake response and safer tractor-trailer coordination during loaded operations. Cost pressure and limited workshop readiness can slow adoption. Demand continues through factory-fitted EBS platforms and electric truck brake control.
Chip Allocation Is Keeping EBS Quotes Firm
Electronic braking system pricing for heavy-duty trucks is rising due to electronic content inside brake control units. Wheel speed sensing components contribute to higher pricing in these systems. Pressure modulation elements increase overall system cost within heavy duty braking applications. Fail-safe diagnostics add cost to electronic braking system components. In February 2026, the Semiconductor Industry Association reported that global semiconductor sales reached US$791.7 billion in 2025, up 25.6% from US$630.5 billion in 2024; fourth-quarter 2025 sales were US$236.6 billion, 37.1% above Q4 2024. For EBS suppliers, this situation does not automatically mean shortages, and it increases chipmaker pricing power. Automotive-grade memory and control components see stronger pricing because of this change. Heavy-duty truck OEMs now face firmer quotes and shorter validity windows in sourcing contracts. Contracts include more cost escalation clauses that affect long term supply agreements.
Testing Burden Is Lifting System-Level Pricing
Price movement in electronic braking systems is shifting from component cost to validation cost. In October 2025, FMCSA said its CMV ADAS consumer performance testing project includes a 5-year roadmap for medium- and heavy-duty vehicles with GVWR over 10,000 lbs. The first year will test forward collision warning and automatic emergency braking, while the following 4 years will sequence other ADAS technologies. For EBS suppliers this raises the commercial value of calibrated brake control software in modern systems. Sensor compatibility gains importance for suppliers due to changing requirements. Test documentation becomes more valuable for compliance across heavy duty vehicle platforms. OEM-specific integration support increases in importance for supplier offerings. Heavy-duty truck buyers now expect less hardware-only pricing in sourcing agreements. More bundled system quotes are becoming common across current procurement practices. These quotes include recovery of engineering expenses within the overall system pricing. Compliance and validation expenses are reflected in these bundled system contracts.
Analysis of Electronic Braking Systems for Heavy-Duty Trucks Market By Key Countries
.webp "Top Country Growth Comparison Electronic Braking Systems For Heavy Duty Trucks Market Cagr (2026 2036)")
| Country | CAGR |
|---|---|
| India | 8.0% |
| China | 7.6% |
| USA | 6.4% |
| Germany | 5.4% |
| UK | 4.9% |
Source: Future Market Insights, 2026.
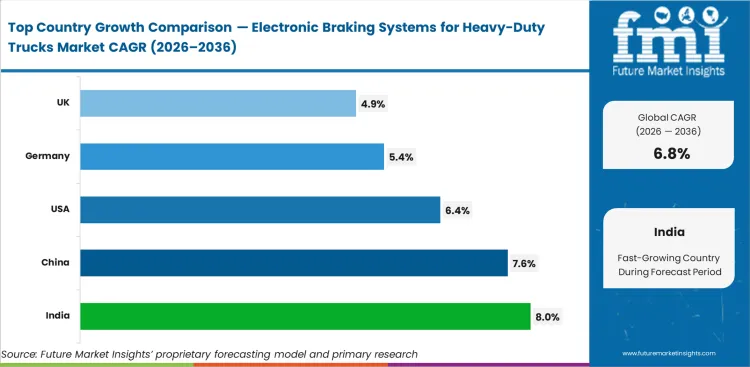
Electronic Braking Systems for Heavy-Duty Trucks Market CAGR Analysis By Country
- India is projected to record an 8.0% CAGR through 2036 as fleet renewal raises safety electronics per truck.
- China’s 7.6% CAGR is shaped by electric heavy truck penetration and stronger brake software needs among local manufacturers.
- USA is forecast at 6.4% CAGR by2036 with automatic braking rule review keeping crash prevention in focus.
- Germany at 5.4% and the UK at 4.9% indicate measured expansion across mature fleets and safety upgrades from replacement cycles.
Demand for electronic braking systems for heavy-duty trucks is forecast to rise at 6.8% CAGR from 2026 to 2036. Country-level analysis covers the listed country markets contributing to this forecast, with the key markets listed below.
Demand Outlook for Electronic Braking Systems for Heavy-Duty Trucks Market in India
India’s electronic braking systems for heavy-duty trucks industry is projected to record a CAGR of 8.0% through 2036. SIAM reported commercial vehicle sales of 239,781 units during July to September 2025. This vehicle base creates demand for India electronic braking systems for heavy-duty trucks across new platforms and replacement parts. Truck makers and service networks can gain from better EBS calibration skill.
- Local freight movement favors Class 8 and heavy tractor braking systems across major highway corridors.
- OEM safety fitment expands as new truck platforms add higher-value electronics during assembly.
- Workshop readiness affects replacement demand as EBS faults need diagnostic tools and trained technicians.
Sales Analysis of Electronic Braking Systems for Heavy-Duty Trucks Market in China
The electronic braking systems for heavy-duty trucks sector in China is expected to expand at a CAGR of 7.6% during the assessment period. ICCT stated battery electric trucks reached 22% share of heavy truck and tractor-trailer sales in H1 2025. This powertrain mix raises demand for China electronic braking systems for heavy-duty trucks. Suppliers benefit from brake blending needs across electric tractor platforms.
- Electric heavy tractors favor EBS software able to coordinate service braking and energy recovery.
- Local OEM programs create demand for brake ECUs with fast calibration and platform reuse.
- Freight electrification increases system value across regenerative braking system integration projects.
Demand Outlook for Electronic Braking Systems for Heavy-Duty Trucks Market in the United States
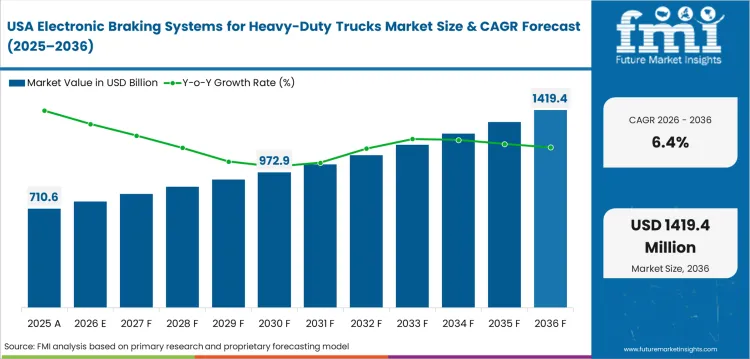
The USA electronic braking systems for heavy-duty trucks industry is forecast to grow at a CAGR of 6.4% by 2036. FMCSA reported 6,050 large trucks and buses involved in fatal crashes in 2022. This safety record keeps brake response and collision mitigation high on fleet planning lists. System suppliers with AEBS compatibility can serve truck makers preparing for stricter safety expectations.
- Federal safety review favors automatic braking technology across heavy commercial vehicle platforms.
- Long-haul fleets need reliable tractor-trailer coordination across interstate freight operations.
- North American service networks value automotive brake system & components compatibility during repair planning.
Opportunity Analysis of Electronic Braking Systems for Heavy-Duty Trucks Market in Germany
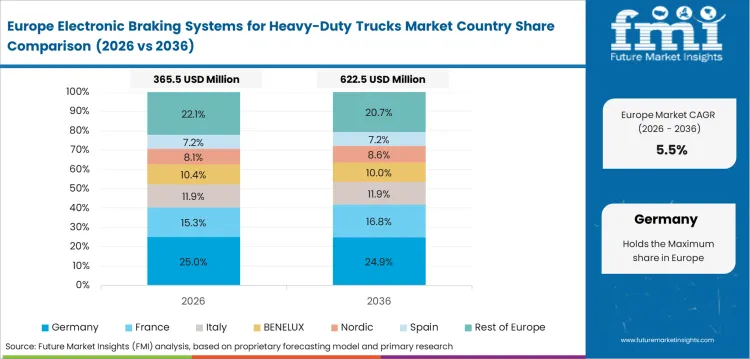
The electronic braking systems for heavy-duty trucks segment in Germany is forecast to expand at 5.4% CAGR over the forecast years. ACEA reported Germany’s truck registrations declined 12.2% in 2025 across the EU truck review. This mature fleet base favors measured EBS demand through premium truck builds and replacement cycles. Brake suppliers with German OEM access can protect volume through platform contracts.
- EU safety timing encourages German truck makers to align EBS and AEBS functions during platform design.
- Heavy truck replacement demand stays selective as fleet owners manage cost and vehicle uptime.
- Engineering depth favors suppliers with validated brake actuation and central control unit capability.
Future Outlook for Electronic Braking Systems for Heavy-Duty Trucks Market in the United Kingdom
The UK electronic braking systems for heavy-duty trucks industry is expected to post 4.9% CAGR through 2036. SMMT reported 40,504 new HGV registrations in 2025 after a 10.0% yearly decline. This favors controlled demand for UK electronic braking systems for heavy-duty trucks as fleets replace vehicles cautiously. Service providers with quick diagnostics can aid smaller operators.
- UK fleet renewal favors systems with lower downtime during brake sensor or control unit replacement.
- Urban freight operations raise interest in automatic emergency braking for dense road conditions.
- Electric HGV trials create future demand for ev regenerative braking control systems compatibility.
Competitive Landscape and Strategic Positioning
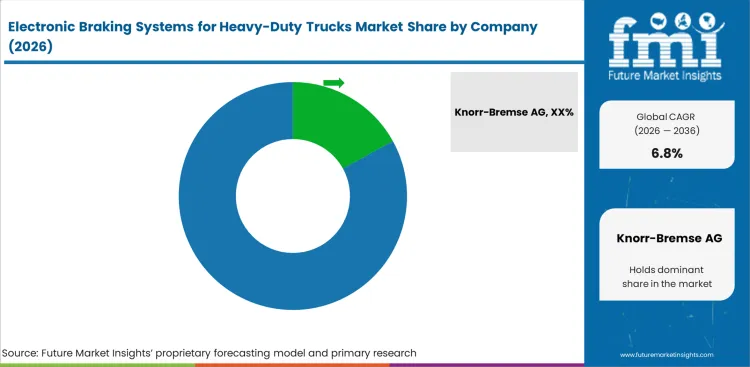
- Knorr-Bremse leads competition through commercial vehicle brake control depth and redundant safety system capability across heavy truck programs.
- ZF and Continental compete on EBS software and active safety electronics across integrated vehicle control programs.
- Specialist providers focus on brake valves and replacement electronics for fleets needing vehicle-specific service depth.
Competition is defined by software depth and safety redundancy across heavy truck braking programs today. Truck platform access separates suppliers with the engineering capacity to win long-cycle OEM programs. Knorr-Bremse holds a high position through integrated braking and steering redundancy for commercial vehicles. ZF brings commercial vehicle control systems into OEM programs with software-based brake coordination across heavy truck platforms. Continental adds braking electronics and sensor interface depth for safety system integration.
High validation cost and strict reliability standards raise entry barriers across heavy truck braking. EBS software capability and faster diagnostic readiness are becoming core priorities across fleet service cycles. Truck manufacturers and fleet operators prefer suppliers able to combine electronic control with actuator reliability in one system plan. Long-cycle heavy truck programs favor companies with proven brake control platforms and established OEM access.
Key Companies in the Electronic Braking Systems for Heavy-Duty Trucks Market
Key global companies active in the electronic braking systems for heavy-duty trucks market include:
- Knorr-Bremse and ZF have validated brake control depth for heavy truck platform design and global service delivery.
- Continental and Bosch serve manufacturers through electronic control depth and sensor-based active safety coverage.
- Bendix and Zhejiang VIE hold specialist positions across brake valves and regional truck braking systems.
Competitive Benchmarking: Electronic Braking Systems for Heavy-Duty Trucks Market
| Company | EBS Control Depth | Trailer Integration Strength | Service Diagnostic Reach | Geographic Footprint |
|---|---|---|---|---|
| Knorr-Bremse AG | High | High | Strong | Europe, North America, China, India, and other global commercial vehicle markets |
| ZF Friedrichshafen AG | High | High | Strong | Europe, North America, Latin America, China, India, Japan, and Southeast Asia |
| Continental AG | High | Medium | Strong | Europe, North America, China, India, Southeast Asia, and other global automotive markets |
| Bendix Commercial Vehicle Systems | High | High | Strong | North America, with strong presence in the United States and Mexico |
| SAF-HOLLAND SE | Medium | High | Moderate | Europe, North America, Latin America, Asia Pacific, and global trailer markets |
| Zhejiang VIE Science & Technology Co., Ltd. | Medium | Medium | Moderate | China, with export-facing reach across selected international commercial vehicle markets |
Source: Future Market Insights, 2026.
Key Developments in Electronic Braking Systems for Heavy-Duty Trucks Market
- In August 2024, Knorr-Bremse announced at IAA Transportation 2024 that it is advancing next-generation braking technologies, including an electromechanical braking system (EMBS) for commercial vehicles. This development is relevant because it represents a step toward electronically controlled and brake-by-wire architectures, offering improved control precision, efficiency, and system integration for future heavy-duty truck platforms.
- In April 2025, ZF Aftermarket announced the launch of a remanufactured WABCO Central Brake Unit under the ZF REMAN label, with first part numbers available in 2025. The development is relevant to the Electronic Braking Systems for Heavy-Duty Trucks Market because ZF identifies the Central Brake Unit as a key component of the Electronic Braking System (EBS) for commercial vehicles. It sends inputs electronically to braking components, supports shorter response times, and improves brake stability.
Key Players in the Electronic Braking Systems for Heavy-Duty Trucks Market
Major Global Players:
- Knorr-Bremse AG
- ZF Friedrichshafen AG
- Bendix Commercial Vehicle Systems
Specialist Players:
- SAF-HOLLAND SE
- Zhejiang VIE Science & Technology Co., Ltd.
Report Scope and Coverage
| Parameter | Details |
|---|---|
| Quantitative Units | USD 1.5 billion to USD 2.9 billion, at a CAGR of 6.8% |
| Market Definition | The electronic braking systems for heavy-duty trucks market encompasses electronically controlled brake systems used to manage stopping, stability, and emergency braking functions in heavy trucks. |
| Regions Covered | North America, Latin America, Europe, East Asia, South Asia and Pacific, Middle East and Africa |
| Countries Covered | USA, UK, Germany, China, India, Japan, South Korea, and 30 plus countries |
| Key Companies Profiled | Knorr-Bremse AG, ZF Friedrichshafen AG, Continental AG, Bendix Commercial Vehicle Systems, Zhejiang VIE Science & Technology Co., Ltd. |
| Forecast Period | 2026 to 2036 |
| Approach | Hybrid bottom-up and top-down methodology starting with system fitment and verified truck safety use patterns. |
Electronic Braking Systems for Heavy-Duty Trucks Market by Segments
Electronic Braking Systems for Heavy-Duty Trucks Market Segmented by System Type:
- Electronic Braking System
- Electronic Stability Control
- Anti-lock Braking System
- Automatic Emergency Braking
- Brake-by-Wire
Electronic Braking Systems for Heavy-Duty Trucks Market Segmented by Component:
- Electronic Control Unit
- Wheel Sensor
- Brake Modulator
- Brake Actuator
- Brake Valve
Electronic Braking Systems for Heavy-Duty Trucks Market Segmented by Vehicle Class:
- Class 8 Trucks
- Class 7 Trucks
- Class 6 Trucks
- Heavy Tractors
Electronic Braking Systems for Heavy-Duty Trucks Market Segmented by Sales Channel:
- OEM
- Aftermarket
Electronic Braking Systems for Heavy-Duty Trucks Market Segmented by Application:
- Long Haul Freight
- Regional Haul
- Construction Trucks
- Mining Trucks
Electronic Braking Systems for Heavy-Duty Trucks Market by Region:
- North America
- USA
- Canada
- Mexico
- Latin America
- Brazil
- Chile
- Rest of Latin America
- Europe
- Germany
- UK
- Italy
- Spain
- France
- Rest of Europe
- East Asia
- China
- Japan
- South Korea
- South Asia and Pacific
- India
- ASEAN
- Australia & New Zealand
- Rest of South Asia and Pacific
- Middle East and Africa
- Saudi Arabia
- Other GCC Countries
- South Africa
- Rest of Middle East and Africa
Research Sources and Bibliography
- Federal Ministry for Digital and Transport. (2024, July). New vehicle safety systems. Government of Germany.
- Federal Motor Carrier Safety Administration. (2025, October). Large Truck and Bus Crash Facts 2022. USA Department of Transportation.
- International Energy Agency. (2025, May 14). Global EV Outlook 2025: Trends in heavy-duty electric vehicles. IEA.
- International Council on Clean Transportation. (2025, September 30). Zero-emission medium- and heavy-duty vehicle market in China, H1 2025. ICCT.
- Society of Indian Automobile Manufacturers. (2025, October 15). Key highlights from Q2 July September 2025. SIAM.
- European Automobile Manufacturers’ Association. (2026, January 29). New commercial vehicle registrations: Vans -8.8%, trucks -6.2%, buses +7.5% in 2025. ACEA.
- Society of Motor Manufacturers and Traders. (2026, February 17). HGV demand dips in 2025 as nascent ZEV uptake grows. SMMT.
- ZF Friedrichshafen AG. (2024, June 27). ZF highlights intelligent software solutions for smarter, more connected commercial vehicles. ZF.
- Knorr-Bremse AG. (2025, May 8). Goal achieved: The driverless truck on the road becomes reality. Knorr-Bremse.
- Federal Ministry for Digital and Transport. (2024, July). New vehicle safety systems. Government of Germany.
- ZF Friedrichshafen AG. (2024). Driving commercial vehicle innovation. ZF.
- SAF-HOLLAND SE. (2026, May). Investor presentation May 2026. SAF-HOLLAND.
- Federal Motor Carrier Safety Administration. (2025, October 3). CMV ADAS consumer performance testing. USA Department of Transportation. CMV ADAS Consumer Performance Testing | FMCSA
- Semiconductor Industry Association. (2026, February 6). Global annual semiconductor sales increase 25.6% to $791.7 billion in 2025. Semiconductor Industry Association. Global Annual Semiconductor Sales Increase 25.6% to $791.7 Billion in 2025 - Semiconductor Industry Association
- Bendix Commercial Vehicle Systems LLC. (2025, December 10). Bendix® Intellipark® Electronic Parking Brake System now available on Kenworth trucks. Bendix.
This Report Answers
- What is the current and future size of the electronic braking systems for heavy-duty trucks market?
- How fast is the electronic braking systems for heavy-duty trucks market expected to expand between 2026 and 2036?
- Which sales channel is expected to lead the market by 2026?
- Which vehicle class is expected to account for the leading demand by 2026?
- What factors are driving demand for electronic braking systems for heavy-duty trucks globally?
- How are safety rules influencing adoption of electronic braking systems?
- Why are OEM channels the main demand base for electronic braking systems?
- How are electric trucks creating demand for brake software coordination?
- Which countries are projected to record faster expansion through 2036?
- What is driving market expansion in India and China?
- Who are the key companies active in the electronic braking systems for heavy-duty trucks market?
- How does FMI estimate and validate the market forecast?
Frequently Asked Questions
What is the global market demand for Electronic Braking Systems for Heavy-Duty Trucks in 2026?
In 2026, the global market for electronic braking systems for heavy-duty trucks is expected to be worth USD 1.5 billion.
How big will the market for electronic braking systems for heavy-duty trucks be in 2036?
By 2036, the market for electronic braking systems for heavy-duty trucks is expected to be worth USD 2.9 billion.
How much is demand for electronic braking systems for heavy-duty trucks expected to expand between 2026 and 2036?
Between 2026 and 2036, demand for electronic braking systems for heavy-duty trucks is expected to expand at a CAGR of 6.8%.
Which sales channel segment is likely to be the leading segment globally by 2026?
OEM channels are expected to account for 72.0% of the sales channel segment in 2026.
What is causing demand to rise in India?
The India electronic braking systems for heavy-duty trucks market is projected to record 8.0% CAGR through 2036, backed by fleet renewal and higher safety content.
What is causing demand to rise in China?
The China electronic braking systems for heavy-duty trucks market is projected to expand at 7.6% CAGR through 2036, backed by electric heavy truck penetration.
What does this report mean by electronic braking systems for heavy-duty trucks market definition?
The electronic braking systems for heavy-duty trucks market includes electronic brake control systems used to manage stopping and stability functions before full brake actuation.
How does Fmi make the electronic braking systems for heavy-duty trucks forecast and check it?
Forecasting models use a hybrid bottom-up and top-down approach, starting with system fitment and checking it against truck safety use patterns.
Preview the report firsthand - request a free sample
Get SampleGet the brochure for pricing and purchase details.
Get PDFTable of Content
- Key Takeaways
- Market Size and CAGR
- Top Growth Driver
- Fastest Growing Segment
- Leading Region
- Key Companies
- Emerging Opportunities
- Executive Summary
- Global Market Outlook
- Demand-side Trends
- Supply-side Trends
- Technology Roadmap Analysis
- Analysis and Recommendations
- Analyst Perspective (What is happening? Why now? What should investors know?)
- Key Questions Answered
- How large is the market?
- What is the CAGR?
- What are key trends?
- Which region dominates?
- Who are the leaders?
- Market Overview
- Market Coverage / Taxonomy
- Market Definition / Scope / Limitations
- Research Methodology
- Chapter Orientation
- Analytical Lens and Working Hypotheses
- Market Structure, Signals, and Trend Drivers
- Benchmarking and Cross-market Comparability
- Market Sizing, Forecasting, and Opportunity Mapping
- Research Design and Evidence Framework
- Desk Research Programme (Secondary Evidence)
- Expert Input and Fieldwork (Primary Evidence)
- Tooling, Models, and Reference Databases
- Data Engineering and Model Build
- Quality Assurance and Audit Trail
- Market Background
- Market Dynamics (Drivers, Restraints, Opportunity, Trends)
- Scenario Forecast (Optimistic, Likely, Conservative)
- Impact Analysis
- AI Impact
- Sustainability Impact
- Regulatory Impact
- Technology Impact
- Consumer / Buyer Analysis
- Purchase Drivers
- Adoption Barriers
- Buyer Journey
- Opportunity Map Analysis
- Product Life Cycle Analysis
- Supply Chain Analysis
- Investment Feasibility Matrix
- Value Chain Analysis
- PESTLE and Porter's Analysis
- Regulatory Landscape
- Regional Parent Market Outlook
- Production and Consumption Statistics
- Import and Export Statistics
- Global Market Analysis and Forecast, 2021 to 2036
- Historical Market Size Value (USD Billion) & Volume (Unit) Analysis, 2021 to 2025
- Current and Future Market Size Value (USD Billion) & Volume (Unit) Projections, 2026 to 2036
- Y-o-Y Growth Trend Analysis
- Absolute $ Opportunity Analysis
- Global Market Pricing Analysis, 2021 to 2036
- Global Market Analysis and Forecast, By System Type, 2021 to 2036
- Introduction / Key Findings
- Historical Market Size Value (USD Billion) & Volume (Unit) Analysis By System Type, 2021 to 2025
- Current and Future Market Size Value (USD Billion) & Volume (Unit) Analysis and Forecast By System Type, 2026 to 2036
- Electronic Braking System
- Electronic Stability Control
- Anti-lock Braking System
- Automatic Emergency Braking
- Brake-by-Wire
- Electronic Braking System
- Y-o-Y Growth Trend Analysis By System Type, 2021 to 2025
- Absolute $ Opportunity Analysis By System Type, 2026 to 2036
- Global Market Analysis and Forecast, By Component, 2021 to 2036
- Introduction / Key Findings
- Historical Market Size Value (USD Billion) & Volume (Unit) Analysis By Component, 2021 to 2025
- Current and Future Market Size Value (USD Billion) & Volume (Unit) Analysis and Forecast By Component, 2026 to 2036
- Electronic Control Value (USD Billion) & Volume (Unit)
- Wheel Sensor
- Brake Modulator
- Brake Actuator
- Brake Valve
- Electronic Control Value (USD Billion) & Volume (Unit)
- Y-o-Y Growth Trend Analysis By Component, 2021 to 2025
- Absolute $ Opportunity Analysis By Component, 2026 to 2036
- Global Market Analysis and Forecast, By Vehicle Class, 2021 to 2036
- Introduction / Key Findings
- Historical Market Size Value (USD Billion) & Volume (Unit) Analysis By Vehicle Class, 2021 to 2025
- Current and Future Market Size Value (USD Billion) & Volume (Unit) Analysis and Forecast By Vehicle Class, 2026 to 2036
- Class 8 Trucks
- Class 7 Trucks
- Class 6 Trucks
- Heavy Tractors
- Class 8 Trucks
- Y-o-Y Growth Trend Analysis By Vehicle Class, 2021 to 2025
- Absolute $ Opportunity Analysis By Vehicle Class, 2026 to 2036
- Global Market Analysis and Forecast, By Sales Channel, 2021 to 2036
- Introduction / Key Findings
- Historical Market Size Value (USD Billion) & Volume (Unit) Analysis By Sales Channel, 2021 to 2025
- Current and Future Market Size Value (USD Billion) & Volume (Unit) Analysis and Forecast By Sales Channel, 2026 to 2036
- OEM
- Aftermarket
- OEM
- Y-o-Y Growth Trend Analysis By Sales Channel, 2021 to 2025
- Absolute $ Opportunity Analysis By Sales Channel, 2026 to 2036
- Global Market Analysis and Forecast, By Application, 2021 to 2036
- Introduction / Key Findings
- Historical Market Size Value (USD Billion) & Volume (Unit) Analysis By Application, 2021 to 2025
- Current and Future Market Size Value (USD Billion) & Volume (Unit) Analysis and Forecast By Application, 2026 to 2036
- Long Haul Freight
- Regional Haul
- Construction Trucks
- Mining Trucks
- Long Haul Freight
- Y-o-Y Growth Trend Analysis By Application, 2021 to 2025
- Absolute $ Opportunity Analysis By Application, 2026 to 2036
- Global Market Analysis and Forecast, By Region, 2021 to 2036
- Introduction
- Historical Market Size Value (USD Billion) & Volume (Unit) Analysis By Region, 2021 to 2025
- Current Market Size Value (USD Billion) & Volume (Unit) Analysis and Forecast By Region, 2026 to 2036
- North America
- Latin America
- Western Europe
- Eastern Europe
- East Asia
- South Asia and Pacific
- Middle East & Africa
- Market Attractiveness Analysis By Region
- North America Market Analysis and Forecast, By Country, 2021 to 2036
- Historical Market Size Value (USD Billion) & Volume (Unit) Trend Analysis By Market Taxonomy, 2021 to 2025
- Market Size Value (USD Billion) & Volume (Unit) Forecast By Market Taxonomy, 2026 to 2036
- By Country
- USA
- Canada
- Mexico
- By System Type
- By Component
- By Vehicle Class
- By Sales Channel
- By Application
- By Country
- Market Attractiveness Analysis
- By Country
- By System Type
- By Component
- By Vehicle Class
- By Sales Channel
- By Application
- Key Takeaways
- Latin America Market Analysis and Forecast, By Country
- Historical Market Size Value (USD Billion) & Volume (Unit) Trend Analysis By Market Taxonomy, 2021 to 2025
- Market Size Value (USD Billion) & Volume (Unit) Forecast By Market Taxonomy, 2026 to 2036
- By Country
- Brazil
- Chile
- Rest of Latin America
- By System Type
- By Component
- By Vehicle Class
- By Sales Channel
- By Application
- By Country
- Market Attractiveness Analysis
- By Country
- By System Type
- By Component
- By Vehicle Class
- By Sales Channel
- By Application
- Key Takeaways
- Western Europe Market Analysis and Forecast, By Country
- Historical Market Size Value (USD Billion) & Volume (Unit) Trend Analysis By Market Taxonomy, 2021 to 2025
- Market Size Value (USD Billion) & Volume (Unit) Forecast By Market Taxonomy, 2026 to 2036
- By Country
- Germany
- UK
- Italy
- Spain
- France
- Nordic
- BENELUX
- Rest of Western Europe
- By System Type
- By Component
- By Vehicle Class
- By Sales Channel
- By Application
- By Country
- Market Attractiveness Analysis
- By Country
- By System Type
- By Component
- By Vehicle Class
- By Sales Channel
- By Application
- Key Takeaways
- Eastern Europe Market Analysis and Forecast, By Country
- Historical Market Size Value (USD Billion) & Volume (Unit) Trend Analysis By Market Taxonomy, 2021 to 2025
- Market Size Value (USD Billion) & Volume (Unit) Forecast By Market Taxonomy, 2026 to 2036
- By Country
- Russia
- Poland
- Hungary
- Balkan & Baltic
- Rest of Eastern Europe
- By System Type
- By Component
- By Vehicle Class
- By Sales Channel
- By Application
- By Country
- Market Attractiveness Analysis
- By Country
- By System Type
- By Component
- By Vehicle Class
- By Sales Channel
- By Application
- Key Takeaways
- East Asia Market Analysis and Forecast, By Country
- Historical Market Size Value (USD Billion) & Volume (Unit) Trend Analysis By Market Taxonomy, 2021 to 2025
- Market Size Value (USD Billion) & Volume (Unit) Forecast By Market Taxonomy, 2026 to 2036
- By Country
- China
- Japan
- South Korea
- By System Type
- By Component
- By Vehicle Class
- By Sales Channel
- By Application
- By Country
- Market Attractiveness Analysis
- By Country
- By System Type
- By Component
- By Vehicle Class
- By Sales Channel
- By Application
- Key Takeaways
- South Asia and Pacific Market Analysis and Forecast, By Country
- Historical Market Size Value (USD Billion) & Volume (Unit) Trend Analysis By Market Taxonomy, 2021 to 2025
- Market Size Value (USD Billion) & Volume (Unit) Forecast By Market Taxonomy, 2026 to 2036
- By Country
- India
- ASEAN
- Australia & New Zealand
- Rest of South Asia and Pacific
- By System Type
- By Component
- By Vehicle Class
- By Sales Channel
- By Application
- By Country
- Market Attractiveness Analysis
- By Country
- By System Type
- By Component
- By Vehicle Class
- By Sales Channel
- By Application
- Key Takeaways
- Middle East & Africa Market Analysis and Forecast, By Country
- Historical Market Size Value (USD Billion) & Volume (Unit) Trend Analysis By Market Taxonomy, 2021 to 2025
- Market Size Value (USD Billion) & Volume (Unit) Forecast By Market Taxonomy, 2026 to 2036
- By Country
- Kingdom of Saudi Arabia
- Other GCC Countries
- Türkiye
- South Africa
- Other African Union
- Rest of Middle East & Africa
- By System Type
- By Component
- By Vehicle Class
- By Sales Channel
- By Application
- By Country
- Market Attractiveness Analysis
- By Country
- By System Type
- By Component
- By Vehicle Class
- By Sales Channel
- By Application
- Key Takeaways
- Key Countries Market Analysis
- USA
- Pricing Analysis
- Market Share Analysis, 2025
- By System Type
- By Component
- By Vehicle Class
- By Sales Channel
- By Application
- Canada
- Pricing Analysis
- Market Share Analysis, 2025
- By System Type
- By Component
- By Vehicle Class
- By Sales Channel
- By Application
- Mexico
- Pricing Analysis
- Market Share Analysis, 2025
- By System Type
- By Component
- By Vehicle Class
- By Sales Channel
- By Application
- Brazil
- Pricing Analysis
- Market Share Analysis, 2025
- By System Type
- By Component
- By Vehicle Class
- By Sales Channel
- By Application
- Chile
- Pricing Analysis
- Market Share Analysis, 2025
- By System Type
- By Component
- By Vehicle Class
- By Sales Channel
- By Application
- Germany
- Pricing Analysis
- Market Share Analysis, 2025
- By System Type
- By Component
- By Vehicle Class
- By Sales Channel
- By Application
- UK
- Pricing Analysis
- Market Share Analysis, 2025
- By System Type
- By Component
- By Vehicle Class
- By Sales Channel
- By Application
- Italy
- Pricing Analysis
- Market Share Analysis, 2025
- By System Type
- By Component
- By Vehicle Class
- By Sales Channel
- By Application
- Spain
- Pricing Analysis
- Market Share Analysis, 2025
- By System Type
- By Component
- By Vehicle Class
- By Sales Channel
- By Application
- France
- Pricing Analysis
- Market Share Analysis, 2025
- By System Type
- By Component
- By Vehicle Class
- By Sales Channel
- By Application
- India
- Pricing Analysis
- Market Share Analysis, 2025
- By System Type
- By Component
- By Vehicle Class
- By Sales Channel
- By Application
- ASEAN
- Pricing Analysis
- Market Share Analysis, 2025
- By System Type
- By Component
- By Vehicle Class
- By Sales Channel
- By Application
- Australia & New Zealand
- Pricing Analysis
- Market Share Analysis, 2025
- By System Type
- By Component
- By Vehicle Class
- By Sales Channel
- By Application
- China
- Pricing Analysis
- Market Share Analysis, 2025
- By System Type
- By Component
- By Vehicle Class
- By Sales Channel
- By Application
- Japan
- Pricing Analysis
- Market Share Analysis, 2025
- By System Type
- By Component
- By Vehicle Class
- By Sales Channel
- By Application
- South Korea
- Pricing Analysis
- Market Share Analysis, 2025
- By System Type
- By Component
- By Vehicle Class
- By Sales Channel
- By Application
- Russia
- Pricing Analysis
- Market Share Analysis, 2025
- By System Type
- By Component
- By Vehicle Class
- By Sales Channel
- By Application
- Poland
- Pricing Analysis
- Market Share Analysis, 2025
- By System Type
- By Component
- By Vehicle Class
- By Sales Channel
- By Application
- Hungary
- Pricing Analysis
- Market Share Analysis, 2025
- By System Type
- By Component
- By Vehicle Class
- By Sales Channel
- By Application
- Kingdom of Saudi Arabia
- Pricing Analysis
- Market Share Analysis, 2025
- By System Type
- By Component
- By Vehicle Class
- By Sales Channel
- By Application
- Türkiye
- Pricing Analysis
- Market Share Analysis, 2025
- By System Type
- By Component
- By Vehicle Class
- By Sales Channel
- By Application
- South Africa
- Pricing Analysis
- Market Share Analysis, 2025
- By System Type
- By Component
- By Vehicle Class
- By Sales Channel
- By Application
- USA
- Market Structure Analysis
- Competition Dashboard
- Competition Benchmarking
- Market Share Analysis of Top Players
- By Regional
- By System Type
- By Component
- By Vehicle Class
- By Sales Channel
- By Application
- Emerging Startups
- Innovation Benchmarking
- Competition Analysis
- Competition Deep Dive
- Knorr-Bremse AG
- Overview
- Product Portfolio
- Profitability by Market Segments (Product/Region/Sales Channel)
- Sales Footprint
- Strategy Overview
- Marketing Strategy
- Product Strategy
- Channel Strategy
- ZF Friedrichshafen AG
- Continental AG
- Bendix Commercial Vehicle Systems
- SAF-HOLLAND SE
- Zhejiang VIE Science & Technology Co., Ltd.
- Knorr-Bremse AG
- Case Studies
- Success Stories
- Recent Developments
- Competition Deep Dive
- Assumptions & Acronyms Used


