Reports

- Global Locations -

Headquarters

Future Market Insights, Inc.

Christiana Corporate, 200
Continental Drive, Suite 401,
Newark, Delaware - 19713,
United States

T: +1-845-579-5705

Americas

Future Market Insights, Inc.

616 Corporate Way, Suite 2-9018,
Valley Cottage, NY 10989, United States

T: +1-347-918-3531

MEA

Future Market Insights

1602-6 Jumeirah Bay X2 Tower, Plot No: JLT-PH2-X2A,
Jumeirah Lakes Towers, Dubai,
United Arab Emirates

Europe

Future Market Insights

3rd Floor, 207 Regent Street,
W1B 3HH London
United Kingdom

T: + 44 (0) 20 8123 9659
D: +44 (0) 20 3287 4268

Asia Pacific

Future Market Insights

IndiaLand Global Tech Park, Unit UG-1, Behind Grand HighStreet, Phase 1, Hinjawadi, MH, Pune – 411057, India

Energy Gel Product Market Overview for 2024 to 2034

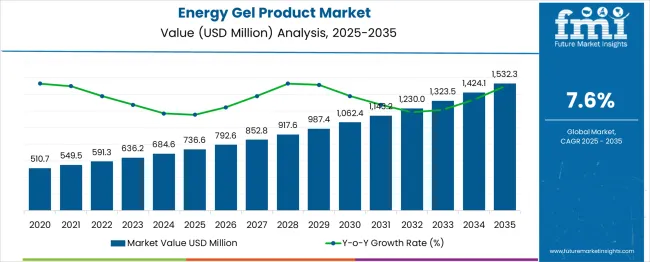
The energy gel product market is evaluated to be sized at US$ 684.54 million in 2024. During the period from 2024 to 2034, the market is expected to progress at a promising clip, registering a CAGR of 7.6%. By 2034, the energy gel product market is anticipated to have reached US$ 1,412.23 million.

Energy Gel Product Market Analysis

  • Demand for energy gel products is flourishing as a result of an increasing number of gym goers taking the help of the product to bring more energy into their bodies.
  • As fitness trends grow, an increase in physical activities is also seeing an increase in the consumption of energy-boosting products like energy gel products.
  • Energy gel product demand among the geriatric population is growing, as doctors are recommending that even aged people be more physically active.
  • Energy gel products are serving as an alternative to sugary drinks, chocolates, and more for patients with diabetes.
  • Energy gel product providers are not only relying on the energy-boosting properties of the gel but also making the product tasty to expand market demand.
Attributes Details
Energy Gel Product Market Value for 2024 US$ 684.54 million
Projected Market Value for 2034 US$ 1,412.23 million
Value-based CAGR of Market for 2024 to 2034 7.6%

Don't pay for what you don't need

Customize your report by selecting specific countries or regions and save 30%!

Energy Gel Product Industry Trends

  • Experimentation with different flavors and textures is allowing vendors in the market to appeal to an increasing number of consumers.
  • Demand for energy gel products is increasing with the higher number of people taking up sports activities. Energy gel product is used to pump up the body for strenuous physical activity.
  • Use of fruits in energy gel products makes the product more appealing to the organic product-obsessed crowd.
  • Convenient packaging of energy gel products endearing the product to consumers, especially the younger generation who value ease of opening.
  • Increasing number of dieticians are recommending the use of energy gel products in diets, as a way to augment the body’s carbohydrate intake, thus bolstering the demand for the product.
  • Energy gel products targeted at specific physical activities, such as running and cycling, are keeping the wheels of the market spinning.
  • Companies in the energy gel product market are stepping up branding efforts to expand the scope of the market. Thus, celebrity endorsements and brand tie-ins are increasingly becoming a part of the market.
  • Consumers opting for natural diets and sources of energy is limiting the scope of the market.
  • Alternatives such as energy bars, sports drinks, and more can augment market demand but also have the potential to eat into it.

Comparative View of Adjacent Markets

Apart from the energy gel product market, an in-depth analysis has been done on two other related markets. The markets by name are the sports drink market and the dietary supplement market.

Increasing social encouragement for sports is fueling the sports drink market. An increasing number of parents enrolling their children in sports is also increasing the demand for sports drinks.

Consumer doubt about sufficient nutrition intake in their daily diets is propelling the dietary supplement market. The irregular eating habits of consumers are also increasing the need for dietary supplements in diets.

Energy Gel Product Market:

Attributes Energy Gel Product Market
Value-based CAGR (2024 to 2034) 7.6%
Projected Market Value (2034) US$ 1,412.23 million
Market Trends
  • Experimentation with different flavors and taste
  • Fruit-based energy gel products
Restraint Aversion towards artificial sources of energy
Growth Factors
  • Fitness trends among the younger population
  • Rising number of people going to gyms

Sports Drink Market:

Attributes Sports Drink Market
Value-based CAGR (2024 to 2034) 6.0%
Market Trend Mineral-infused sports drinks
Restraint Doubts about the nutritional qualities of sports drinks
Growth Factor Increasing number of children partaking in sports activities

Dietary Supplement Market:

Attributes Dietary Supplement Market
Value-based CAGR (2024 to 2034) 9.5%
Market Trend Multivitamin supplements gaining in popularity
Restraint General aversion towards supplements in certain quarters
Growth Factor Increasing demand for probiotics and prebiotics
Nandini Roy Choudhury

Principal Consultant

Talk to Analyst

Find your sweet spots for generating winning opportunities in this market.

Category-wise Outlook

Fruit flavor energy gel products are preferred by a vast number of consumers. Hypermarkets/supermarkets are the predominant place where consumers are obtaining energy gel products.

Fruit Flavor Energy Gel Products Top the Flavor Segment Due to Increasing Organic Trends

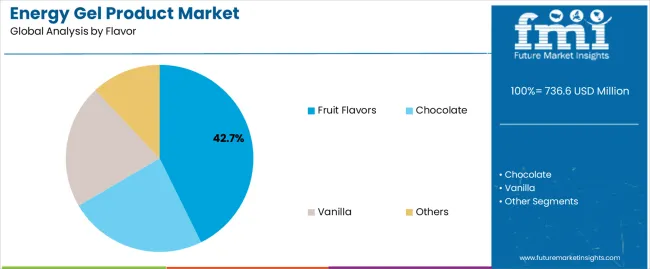
Fruit flavor energy gel products are expected to account for 33.7% of the market share by flavor in 2024. Some of the factors influencing the progress of fruit flavor energy gel products are:

  • Rising number of consumers are inclined toward natural ingredients in their food intake and thus fruit-flavored energy gel product demand is blossoming.
  • Manufacturers incorporating a wide variety of fruits in the assimilation of energy gel products are making sure the demand for the product remains fresh.
Attributes Details
Top Flavor Fruit Flavors
Market Share (2024) 33.7%

Variety Provided by Supermarket/Hypermarkets in Energy gel products Make Sure they Rule the Roost in the Sales Channel Segment

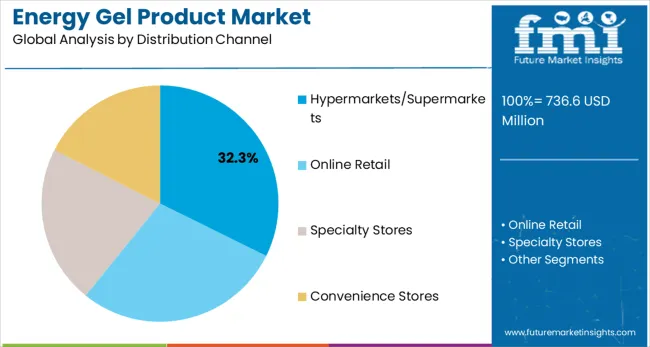
Hypermarkets/supermarkets are anticipated to account for 32.3% of the market share by sales channel in 2024. Some of the reasons for the progress of hypermarkets/supermarkets sales of the product are:

  • Hypermarkets/supermarkets provide a wide variety of gels to consumers and thus they prefer the sales channel.
  • Hypermarkets/supermarkets increase sales by using strategies like bundling energy gel products with other fitness products, discounts, and more. Thus, energy gel product sales through the sales channel are increasing.
Attributes Details
Top Sales Channel Hypermarkets/supermarkets
Market Share (2024) 32.3%

Country-Wise Analysis

The Asia Pacific is emerging as a significant hub for the region due to its notable fitness culture. The increasing urban population of the region is also contributing to the market’s acceleration in the region.

Europe’s ever-continuing sports culture helps the market’s cause in the region. The lives of customers in the region getting increasingly busy is also propelling the demand for energy-boosting products in the region, including energy gel products.

Countries CAGR (2024 to 2034)
Poland 11.3%
Russia 8.9%
Japan 9.5%
China 8.5%
South Korea 10.3%

Sports Culture Propagating in Poland Sees the Market Penetrate Further into the Country

The CAGR of the market for the forecast period in Poland is anticipated to be 11.3%. Some of the factors influencing the growth of the market in the country are:

  • Sports culture shows no signs of slowing down in Poland, with an increasing number of people taking up football, handball, and other sports, enriching the market’s prospects in the nation.
  • Poland’s population favoring fruit-based food products is increasing the demand for fruit flavor energy gel products in the country.

Adverse Weather Conditions in Russia See Consumers Seek Out Energy gel products in Russia

The market is expected to have a CAGR of 8.9% in Russia through 2034. Some of the factors responsible for the growth of the market are:

  • Weather conditions in Russia have the potential to be severe, especially in remote areas. To keep energy up during tough weather conditions, energy gel products are being resorted to.
  • Government encouragement for the taking up of sports activities is benefitting the market’s prospects in the country.

Japan’s Considerable Geriatric Population Taking Help of Energy Gel Products to Partake in Physical Activities

The market is expected to progress at a CAGR of 9.5% in Japan for the forecast period. Some factors influencing the progress are:

  • Japan’s notable aged population is being encouraged to maintain fitness, thus leading to more exercising on their part. Energy gel products are being utilized by these aged people to make sure their energy is kept up during exercises.
  • Energy gel product vendors are establishing tie-ups with media companies for branding opportunities in Japan, thus appealing to the younger section of the population.

Manufacture of Energy Gel Products with Traditional Flavors Aiding Market Demand in China

The market is expected to progress at a CAGR of 8.5% in China throughout the forecast period. Some factors influencing the progress are:

  • Producers of energy gel products in China are experimenting with local flavors to expand market demand in the country.
  • To counter the prevailing obesity problem in China, more fitness and diet programs are being launched, which is increasing the profile of energy gel products in the country.

South Korea’s Growing Gym-going Culture Helps the Market’s Cause in the Country

The market is expected to progress at a CAGR of 10.3% in South Korea. Some factors influencing the progress are:
  • Increasing number of consumers are hitting the gyms in South Korea and thus the use of energy gel products in the country is multiplying.
  • South Korea’s population is getting increasingly busy and to maintain energy throughout the day, a considerable number of people are taking up the option of energy gel products.

Get the data you need at a Fraction of the cost

Personalize your report by choosing insights you need
and save 40%!

Competitive Landscape in the Energy Gel Product Market

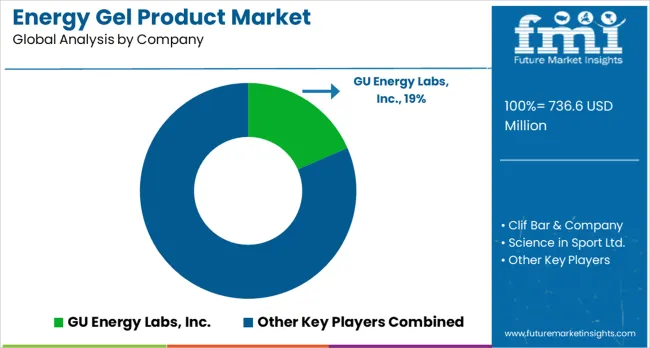
Market players in the energy gel product landscape are taking the help of celebrity endorsements to expand their reach. The development of new products to keep an ever-widening roster available to consumers is concentrated on by market players.

Fitness brands are entering the energy gel product market, sensing the opportunities lurking in it. Collaborative as well as acquisition strategies are being practiced by market players.

Recent Developments in the Energy Gel Product Market

  • In January 2024, Carbs Fuel LLC launched a new carbohydrate-rich energy gel product. It is touted as a cost-effective gel as compared to similar products.
  • In August 2023, it was announced that Australian company Fixx Nutrition launched a new production facility in Gold Coast, Australia, which includes the production of energy gel products.
  • In March 2022, HIGH launched the Energy gel product Electrolyte, targeted to restore key minerals lost during workouts.
  • In February 2022, Morinaga launched its athletic gel drink, which is targeted toward pre-workout routines.

Key Companies in the Energy Gel Product Market

  • Advanced Food Concepts, Inc.
  • Nutrition Works Ltd
  • Boom Nutrition Inc.
  • Clif Bar & Company
  • EN-R-G Foods, LLC
  • Gatorade Company, Inc.
  • Hammer Nutrition Ltd.
  • Powerbar Inc.
  • Zipvit Ltd.
  • Scientific Sports Nutrition (Pty) Ltd.

Key Coverage in the Energy Gel Product Market Report

  • Energy Gel Product Market Size, Share and Trends
  • Energy Gel Product Market Forecast
  • Energy Gel Product Market Global Analysis
  • Energy Gel Product and Energy Supplement Market Comparative Analysis
  • Analysis of Strategic Players in the Energy Gel Product Market
  • India Energy Gel Product Market Report

Key Segments

By Flavor:

  • Fruit Flavours
    • Berry Flavour
    • Citrus Flavour
    • Cherry Flavour
    • Watermelon Flavour
    • Other Fruit Flavours
  • Lemonade/Limeade Flavours
  • Chocolate Flavour
  • Coffee/Espresso Flavour
  • Vanilla Flavour
  • Blended Flavours
  • Other Flavours (Coconut, Ginger Ale, etc.)

By Nature:

  • Organic
  • Conventional

By Pack Size:

  • Single-Serve
  • Multi-Serve

By Ingredient Type:

  • Caffeine-free
  • With Caffeine

By Sales Channel:

  • Hypermarkets/ Supermarkets
  • Groceries/Mass Retailers
  • Wholesale Club Stores
  • Convenience Stores
  • Specialty Stores
  • Online Retailers

By Region:

  • North America
  • Latin America
  • Europe
  • South Asia
  • East Asia
  • Oceania
  • Middle East and Africa (MEA)

Frequently Asked Questions

How Big is the Energy Gel Product Market?

The size of the energy gel product market is estimated to be US$ 684.54 million in 2024.

At What Rate is the Energy Gel Product Market Expected to Grow?

The energy gel product market is expected to increase at a CAGR of 7.6% over the forecast period.

What is the Scope of Energy gel products in China?

The energy gel product market is expected to register a CAGR of 8.5% in China over the period from 2024 to 2034.

What is the Forecast of the Energy Gel Product Market?

The energy gel product market is forecasted to have reached a size of US$ 1,412.23 million by 2034.

What are the Trends in the Energy gel product Industry?

Energy gel products made from various fruit flavors and dietitians recommending the product to be a part of diets are two of the trends in the energy gel product industry.

Who are the Key Companies in the Energy Gel Product Market?

Advanced Food Concepts, Inc., Nutrition Works Ltd, Boom Nutrition Inc., and Clif Bar & Company are some of the prominent companies in the energy gel product market.

What is the Top Flavor in the Energy Gel Product Market?

Fruit flavor is the top flavor in the energy gel product market, with an estimated market share of 33.7% in 2024.

What is the Scope of Energy gel products in Japan?

The energy gel product market is expected to register a CAGR of 9.5% in Japan over the period from 2024 to 2034.

Table of Content

1. Executive Summary

    1.1. Global Market Outlook

    1.2. Demand-side Trends

    1.3. Supply-side Trends

    1.4. Technology Roadmap Analysis

    1.5. Analysis and Recommendations

2. Market Overview

    2.1. Market Coverage / Taxonomy

    2.2. Market Definition / Scope / Limitations

3. Market Background

    3.1. Market Dynamics

        3.1.1. Drivers

        3.1.2. Restraints

        3.1.3. Opportunity

        3.1.4. Trends

    3.2. Scenario Forecast

        3.2.1. Demand in Optimistic Scenario

        3.2.2. Demand in Likely Scenario

        3.2.3. Demand in Conservative Scenario

    3.3. Opportunity Map Analysis

    3.4. Product Life Cycle Analysis

    3.5. Supply Chain Analysis

        3.5.1. Supply Side Participants and their Roles

            3.5.1.1. Manufacturer

            3.5.1.2. Mid-Level Participants (Traders)

            3.5.1.3. Wholesalers and Distributors

        3.5.2. Value Added and Value Created at Node in the Supply Chain

        3.5.3. List of Raw Material Suppliers

        3.5.4. List of Existing and Potential Buyer’s

    3.6. Investment Feasibility Matrix

    3.7. Value Chain Analysis

        3.7.1. Profit Margin Analysis

        3.7.2. Wholesalers and Distributors

        3.7.3. Retailers

    3.8. PESTLE and Porter’s Analysis

    3.9. Regulatory Landscape

        3.9.1. By Key Regions

        3.9.2. By Key Countries

    3.10. Regional Parent Market Outlook

    3.11. Production and Consumption Statistics

    3.12. Import and Export Statistics

4. Global Market Analysis 2019 to 2023 and Forecast, 2024 to 2034

    4.1. Historical Market Size Value (US$ Million) & Volume (Unit Pack) Analysis, 2019 to 2023

    4.2. Current and Future Market Size Value (US$ Million) & Volume (Unit Pack) Projections, 2024 to 2034

        4.2.1. Y-o-Y Growth Trend Analysis

        4.2.2. Absolute $ Opportunity Analysis

5. Global Market Analysis 2019 to 2023 and Forecast 2024 to 2034, By Flavour Type

    5.1. Introduction / Key Findings

    5.2. Historical Market Size Value (US$ Million) & Volume (Unit Pack) Analysis By Flavour Type, 2019 to 2023

    5.3. Current and Future Market Size Value (US$ Million) & Volume (Unit Pack) Analysis and Forecast By Flavour Type, 2024 to 2034

        5.3.1. Fruit

            5.3.1.1. Orange

            5.3.1.2. Strawberry

            5.3.1.3. Raspberry

            5.3.1.4. Lemon

        5.3.2. Vanilla

        5.3.3. Chocolate

        5.3.4. Others

    5.4. Y-o-Y Growth Trend Analysis By Flavour Type, 2019 to 2023

    5.5. Absolute $ Opportunity Analysis By Flavour Type, 2024 to 2034

6. Global Market Analysis 2019 to 2023 and Forecast 2024 to 2034, By Distribution Channel

    6.1. Introduction / Key Findings

    6.2. Historical Market Size Value (US$ Million) & Volume (Unit Pack) Analysis By Distribution Channel, 2019 to 2023

    6.3. Current and Future Market Size Value (US$ Million) & Volume (Unit Pack) Analysis and Forecast By Distribution Channel, 2024 to 2034

        6.3.1. Supermarket/Hypermarket

        6.3.2. Specialty Store

        6.3.3. Online Store

        6.3.4. Others

    6.4. Y-o-Y Growth Trend Analysis By Distribution Channel, 2019 to 2023

    6.5. Absolute $ Opportunity Analysis By Distribution Channel, 2024 to 2034

7. Global Market Analysis 2019 to 2023 and Forecast 2024 to 2034, By Region

    7.1. Introduction

    7.2. Historical Market Size Value (US$ Million) & Volume (Unit Pack) Analysis By Region, 2019 to 2023

    7.3. Current Market Size Value (US$ Million) & Volume (Unit Pack) Analysis and Forecast By Region, 2024 to 2034

        7.3.1. North America

        7.3.2. Latin America

        7.3.3. Western Europe

        7.3.4. Eastern Europe

        7.3.5. South Asia and Pacific

        7.3.6. East Asia

        7.3.7. Middle East and Africa

    7.4. Market Attractiveness Analysis By Region

8. North America Market Analysis 2019 to 2023 and Forecast 2024 to 2034, By Country

    8.1. Historical Market Size Value (US$ Million) & Volume (Unit Pack) Trend Analysis By Market Taxonomy, 2019 to 2023

    8.2. Market Size Value (US$ Million) & Volume (Unit Pack) Forecast By Market Taxonomy, 2024 to 2034

        8.2.1. By Country

            8.2.1.1. USA

            8.2.1.2. Canada

        8.2.2. By Flavour Type

        8.2.3. By Distribution Channel

    8.3. Market Attractiveness Analysis

        8.3.1. By Country

        8.3.2. By Flavour Type

        8.3.3. By Distribution Channel

    8.4. Key Takeaways

9. Latin America Market Analysis 2019 to 2023 and Forecast 2024 to 2034, By Country

    9.1. Historical Market Size Value (US$ Million) & Volume (Unit Pack) Trend Analysis By Market Taxonomy, 2019 to 2023

    9.2. Market Size Value (US$ Million) & Volume (Unit Pack) Forecast By Market Taxonomy, 2024 to 2034

        9.2.1. By Country

            9.2.1.1. Brazil

            9.2.1.2. Mexico

            9.2.1.3. Rest of Latin America

        9.2.2. By Flavour Type

        9.2.3. By Distribution Channel

    9.3. Market Attractiveness Analysis

        9.3.1. By Country

        9.3.2. By Flavour Type

        9.3.3. By Distribution Channel

    9.4. Key Takeaways

10. Western Europe Market Analysis 2019 to 2023 and Forecast 2024 to 2034, By Country

    10.1. Historical Market Size Value (US$ Million) & Volume (Unit Pack) Trend Analysis By Market Taxonomy, 2019 to 2023

    10.2. Market Size Value (US$ Million) & Volume (Unit Pack) Forecast By Market Taxonomy, 2024 to 2034

        10.2.1. By Country

            10.2.1.1. Germany

            10.2.1.2. UK

            10.2.1.3. France

            10.2.1.4. Spain

            10.2.1.5. Italy

            10.2.1.6. Rest of Western Europe

        10.2.2. By Flavour Type

        10.2.3. By Distribution Channel

    10.3. Market Attractiveness Analysis

        10.3.1. By Country

        10.3.2. By Flavour Type

        10.3.3. By Distribution Channel

    10.4. Key Takeaways

11. Eastern Europe Market Analysis 2019 to 2023 and Forecast 2024 to 2034, By Country

    11.1. Historical Market Size Value (US$ Million) & Volume (Unit Pack) Trend Analysis By Market Taxonomy, 2019 to 2023

    11.2. Market Size Value (US$ Million) & Volume (Unit Pack) Forecast By Market Taxonomy, 2024 to 2034

        11.2.1. By Country

            11.2.1.1. Poland

            11.2.1.2. Russia

            11.2.1.3. Czech Republic

            11.2.1.4. Romania

            11.2.1.5. Rest of Eastern Europe

        11.2.2. By Flavour Type

        11.2.3. By Distribution Channel

    11.3. Market Attractiveness Analysis

        11.3.1. By Country

        11.3.2. By Flavour Type

        11.3.3. By Distribution Channel

    11.4. Key Takeaways

12. South Asia and Pacific Market Analysis 2019 to 2023 and Forecast 2024 to 2034, By Country

    12.1. Historical Market Size Value (US$ Million) & Volume (Unit Pack) Trend Analysis By Market Taxonomy, 2019 to 2023

    12.2. Market Size Value (US$ Million) & Volume (Unit Pack) Forecast By Market Taxonomy, 2024 to 2034

        12.2.1. By Country

            12.2.1.1. India

            12.2.1.2. Bangladesh

            12.2.1.3. Australia

            12.2.1.4. New Zealand

            12.2.1.5. Rest of South Asia and Pacific

        12.2.2. By Flavour Type

        12.2.3. By Distribution Channel

    12.3. Market Attractiveness Analysis

        12.3.1. By Country

        12.3.2. By Flavour Type

        12.3.3. By Distribution Channel

    12.4. Key Takeaways

13. East Asia Market Analysis 2019 to 2023 and Forecast 2024 to 2034, By Country

    13.1. Historical Market Size Value (US$ Million) & Volume (Unit Pack) Trend Analysis By Market Taxonomy, 2019 to 2023

    13.2. Market Size Value (US$ Million) & Volume (Unit Pack) Forecast By Market Taxonomy, 2024 to 2034

        13.2.1. By Country

            13.2.1.1. China

            13.2.1.2. Japan

            13.2.1.3. South Korea

        13.2.2. By Flavour Type

        13.2.3. By Distribution Channel

    13.3. Market Attractiveness Analysis

        13.3.1. By Country

        13.3.2. By Flavour Type

        13.3.3. By Distribution Channel

    13.4. Key Takeaways

14. Middle East and Africa Market Analysis 2019 to 2023 and Forecast 2024 to 2034, By Country

    14.1. Historical Market Size Value (US$ Million) & Volume (Unit Pack) Trend Analysis By Market Taxonomy, 2019 to 2023

    14.2. Market Size Value (US$ Million) & Volume (Unit Pack) Forecast By Market Taxonomy, 2024 to 2034

        14.2.1. By Country

            14.2.1.1. GCC Countries

            14.2.1.2. South Africa

            14.2.1.3. Israel

            14.2.1.4. Rest of MEA

        14.2.2. By Flavour Type

        14.2.3. By Distribution Channel

    14.3. Market Attractiveness Analysis

        14.3.1. By Country

        14.3.2. By Flavour Type

        14.3.3. By Distribution Channel

    14.4. Key Takeaways

15. Key Countries Market Analysis

    15.1. USA

        15.1.1. Pricing Analysis

        15.1.2. Market Share Analysis, 2023

            15.1.2.1. By Flavour Type

            15.1.2.2. By Distribution Channel

    15.2. Canada

        15.2.1. Pricing Analysis

        15.2.2. Market Share Analysis, 2023

            15.2.2.1. By Flavour Type

            15.2.2.2. By Distribution Channel

    15.3. Brazil

        15.3.1. Pricing Analysis

        15.3.2. Market Share Analysis, 2023

            15.3.2.1. By Flavour Type

            15.3.2.2. By Distribution Channel

    15.4. Mexico

        15.4.1. Pricing Analysis

        15.4.2. Market Share Analysis, 2023

            15.4.2.1. By Flavour Type

            15.4.2.2. By Distribution Channel

    15.5. Germany

        15.5.1. Pricing Analysis

        15.5.2. Market Share Analysis, 2023

            15.5.2.1. By Flavour Type

            15.5.2.2. By Distribution Channel

    15.6. UK

        15.6.1. Pricing Analysis

        15.6.2. Market Share Analysis, 2023

            15.6.2.1. By Flavour Type

            15.6.2.2. By Distribution Channel

    15.7. France

        15.7.1. Pricing Analysis

        15.7.2. Market Share Analysis, 2023

            15.7.2.1. By Flavour Type

            15.7.2.2. By Distribution Channel

    15.8. Spain

        15.8.1. Pricing Analysis

        15.8.2. Market Share Analysis, 2023

            15.8.2.1. By Flavour Type

            15.8.2.2. By Distribution Channel

    15.9. Italy

        15.9.1. Pricing Analysis

        15.9.2. Market Share Analysis, 2023

            15.9.2.1. By Flavour Type

            15.9.2.2. By Distribution Channel

    15.10. Poland

        15.10.1. Pricing Analysis

        15.10.2. Market Share Analysis, 2023

            15.10.2.1. By Flavour Type

            15.10.2.2. By Distribution Channel

    15.11. Russia

        15.11.1. Pricing Analysis

        15.11.2. Market Share Analysis, 2023

            15.11.2.1. By Flavour Type

            15.11.2.2. By Distribution Channel

    15.12. Czech Republic

        15.12.1. Pricing Analysis

        15.12.2. Market Share Analysis, 2023

            15.12.2.1. By Flavour Type

            15.12.2.2. By Distribution Channel

    15.13. Romania

        15.13.1. Pricing Analysis

        15.13.2. Market Share Analysis, 2023

            15.13.2.1. By Flavour Type

            15.13.2.2. By Distribution Channel

    15.14. India

        15.14.1. Pricing Analysis

        15.14.2. Market Share Analysis, 2023

            15.14.2.1. By Flavour Type

            15.14.2.2. By Distribution Channel

    15.15. Bangladesh

        15.15.1. Pricing Analysis

        15.15.2. Market Share Analysis, 2023

            15.15.2.1. By Flavour Type

            15.15.2.2. By Distribution Channel

    15.16. Australia

        15.16.1. Pricing Analysis

        15.16.2. Market Share Analysis, 2023

            15.16.2.1. By Flavour Type

            15.16.2.2. By Distribution Channel

    15.17. New Zealand

        15.17.1. Pricing Analysis

        15.17.2. Market Share Analysis, 2023

            15.17.2.1. By Flavour Type

            15.17.2.2. By Distribution Channel

    15.18. China

        15.18.1. Pricing Analysis

        15.18.2. Market Share Analysis, 2023

            15.18.2.1. By Flavour Type

            15.18.2.2. By Distribution Channel

    15.19. Japan

        15.19.1. Pricing Analysis

        15.19.2. Market Share Analysis, 2023

            15.19.2.1. By Flavour Type

            15.19.2.2. By Distribution Channel

    15.20. South Korea

        15.20.1. Pricing Analysis

        15.20.2. Market Share Analysis, 2023

            15.20.2.1. By Flavour Type

            15.20.2.2. By Distribution Channel

    15.21. GCC Countries

        15.21.1. Pricing Analysis

        15.21.2. Market Share Analysis, 2023

            15.21.2.1. By Flavour Type

            15.21.2.2. By Distribution Channel

    15.22. South Africa

        15.22.1. Pricing Analysis

        15.22.2. Market Share Analysis, 2023

            15.22.2.1. By Flavour Type

            15.22.2.2. By Distribution Channel

    15.23. Israel

        15.23.1. Pricing Analysis

        15.23.2. Market Share Analysis, 2023

            15.23.2.1. By Flavour Type

            15.23.2.2. By Distribution Channel

16. Market Structure Analysis

    16.1. Competition Dashboard

    16.2. Competition Benchmarking

    16.3. Market Share Analysis of Top Players

        16.3.1. By Regional

        16.3.2. By Flavour Type

        16.3.3. By Distribution Channel

17. Competition Analysis

    17.1. Competition Deep Dive

        17.1.1. Advanced Food Concepts, Inc.

            17.1.1.1. Overview

            17.1.1.2. Product Portfolio

            17.1.1.3. Profitability by Market Segments

            17.1.1.4. Sales Footprint

            17.1.1.5. Strategy Overview

                17.1.1.5.1. Marketing Strategy

                17.1.1.5.2. Product Strategy

                17.1.1.5.3. Channel Strategy

        17.1.2. Nutrition Works Ltd

            17.1.2.1. Overview

            17.1.2.2. Product Portfolio

            17.1.2.3. Profitability by Market Segments

            17.1.2.4. Sales Footprint

            17.1.2.5. Strategy Overview

                17.1.2.5.1. Marketing Strategy

                17.1.2.5.2. Product Strategy

                17.1.2.5.3. Channel Strategy

        17.1.3. Boom Nutrition Inc.

            17.1.3.1. Overview

            17.1.3.2. Product Portfolio

            17.1.3.3. Profitability by Market Segments

            17.1.3.4. Sales Footprint

            17.1.3.5. Strategy Overview

                17.1.3.5.1. Marketing Strategy

                17.1.3.5.2. Product Strategy

                17.1.3.5.3. Channel Strategy

        17.1.4. Clif Bar & Company

            17.1.4.1. Overview

            17.1.4.2. Product Portfolio

            17.1.4.3. Profitability by Market Segments

            17.1.4.4. Sales Footprint

            17.1.4.5. Strategy Overview

                17.1.4.5.1. Marketing Strategy

                17.1.4.5.2. Product Strategy

                17.1.4.5.3. Channel Strategy

        17.1.5. EN-R-G Foods, LLC

            17.1.5.1. Overview

            17.1.5.2. Product Portfolio

            17.1.5.3. Profitability by Market Segments

            17.1.5.4. Sales Footprint

            17.1.5.5. Strategy Overview

                17.1.5.5.1. Marketing Strategy

                17.1.5.5.2. Product Strategy

                17.1.5.5.3. Channel Strategy

        17.1.6. Gatorade Company, Inc.

            17.1.6.1. Overview

            17.1.6.2. Product Portfolio

            17.1.6.3. Profitability by Market Segments

            17.1.6.4. Sales Footprint

            17.1.6.5. Strategy Overview

                17.1.6.5.1. Marketing Strategy

                17.1.6.5.2. Product Strategy

                17.1.6.5.3. Channel Strategy

        17.1.7. Hammer Nutrition Ltd.

            17.1.7.1. Overview

            17.1.7.2. Product Portfolio

            17.1.7.3. Profitability by Market Segments

            17.1.7.4. Sales Footprint

            17.1.7.5. Strategy Overview

                17.1.7.5.1. Marketing Strategy

                17.1.7.5.2. Product Strategy

                17.1.7.5.3. Channel Strategy

        17.1.8. Powerbar Inc.

            17.1.8.1. Overview

            17.1.8.2. Product Portfolio

            17.1.8.3. Profitability by Market Segments

            17.1.8.4. Sales Footprint

            17.1.8.5. Strategy Overview

                17.1.8.5.1. Marketing Strategy

                17.1.8.5.2. Product Strategy

                17.1.8.5.3. Channel Strategy

        17.1.9. Zipvit Ltd.

            17.1.9.1. Overview

            17.1.9.2. Product Portfolio

            17.1.9.3. Profitability by Market Segments

            17.1.9.4. Sales Footprint

            17.1.9.5. Strategy Overview

                17.1.9.5.1. Marketing Strategy

                17.1.9.5.2. Product Strategy

                17.1.9.5.3. Channel Strategy

        17.1.10. Scientific Sports Nutrition (Pty) Ltd.

            17.1.10.1. Overview

            17.1.10.2. Product Portfolio

            17.1.10.3. Profitability by Market Segments

            17.1.10.4. Sales Footprint

            17.1.10.5. Strategy Overview

                17.1.10.5.1. Marketing Strategy

                17.1.10.5.2. Product Strategy

                17.1.10.5.3. Channel Strategy

18. Assumptions & Acronyms Used

19. Research Methodology

Don't pay for what you don't need

Customize your report by selecting specific countries or regions and save 30%!

List of Tables

Table 1: Global Market Value (US$ Million) Forecast by Region, 2019 to 2034

Table 2: Global Market Volume (Unit Pack) Forecast by Region, 2019 to 2034

Table 3: Global Market Value (US$ Million) Forecast by Flavour Type, 2019 to 2034

Table 4: Global Market Volume (Unit Pack) Forecast by Flavour Type, 2019 to 2034

Table 5: Global Market Value (US$ Million) Forecast by Distribution Channel, 2019 to 2034

Table 6: Global Market Volume (Unit Pack) Forecast by Distribution Channel, 2019 to 2034

Table 7: North America Market Value (US$ Million) Forecast by Country, 2019 to 2034

Table 8: North America Market Volume (Unit Pack) Forecast by Country, 2019 to 2034

Table 9: North America Market Value (US$ Million) Forecast by Flavour Type, 2019 to 2034

Table 10: North America Market Volume (Unit Pack) Forecast by Flavour Type, 2019 to 2034

Table 11: North America Market Value (US$ Million) Forecast by Distribution Channel, 2019 to 2034

Table 12: North America Market Volume (Unit Pack) Forecast by Distribution Channel, 2019 to 2034

Table 13: Latin America Market Value (US$ Million) Forecast by Country, 2019 to 2034

Table 14: Latin America Market Volume (Unit Pack) Forecast by Country, 2019 to 2034

Table 15: Latin America Market Value (US$ Million) Forecast by Flavour Type, 2019 to 2034

Table 16: Latin America Market Volume (Unit Pack) Forecast by Flavour Type, 2019 to 2034

Table 17: Latin America Market Value (US$ Million) Forecast by Distribution Channel, 2019 to 2034

Table 18: Latin America Market Volume (Unit Pack) Forecast by Distribution Channel, 2019 to 2034

Table 19: Western Europe Market Value (US$ Million) Forecast by Country, 2019 to 2034

Table 20: Western Europe Market Volume (Unit Pack) Forecast by Country, 2019 to 2034

Table 21: Western Europe Market Value (US$ Million) Forecast by Flavour Type, 2019 to 2034

Table 22: Western Europe Market Volume (Unit Pack) Forecast by Flavour Type, 2019 to 2034

Table 23: Western Europe Market Value (US$ Million) Forecast by Distribution Channel, 2019 to 2034

Table 24: Western Europe Market Volume (Unit Pack) Forecast by Distribution Channel, 2019 to 2034

Table 25: Eastern Europe Market Value (US$ Million) Forecast by Country, 2019 to 2034

Table 26: Eastern Europe Market Volume (Unit Pack) Forecast by Country, 2019 to 2034

Table 27: Eastern Europe Market Value (US$ Million) Forecast by Flavour Type, 2019 to 2034

Table 28: Eastern Europe Market Volume (Unit Pack) Forecast by Flavour Type, 2019 to 2034

Table 29: Eastern Europe Market Value (US$ Million) Forecast by Distribution Channel, 2019 to 2034

Table 30: Eastern Europe Market Volume (Unit Pack) Forecast by Distribution Channel, 2019 to 2034

Table 31: South Asia and Pacific Market Value (US$ Million) Forecast by Country, 2019 to 2034

Table 32: South Asia and Pacific Market Volume (Unit Pack) Forecast by Country, 2019 to 2034

Table 33: South Asia and Pacific Market Value (US$ Million) Forecast by Flavour Type, 2019 to 2034

Table 34: South Asia and Pacific Market Volume (Unit Pack) Forecast by Flavour Type, 2019 to 2034

Table 35: South Asia and Pacific Market Value (US$ Million) Forecast by Distribution Channel, 2019 to 2034

Table 36: South Asia and Pacific Market Volume (Unit Pack) Forecast by Distribution Channel, 2019 to 2034

Table 37: East Asia Market Value (US$ Million) Forecast by Country, 2019 to 2034

Table 38: East Asia Market Volume (Unit Pack) Forecast by Country, 2019 to 2034

Table 39: East Asia Market Value (US$ Million) Forecast by Flavour Type, 2019 to 2034

Table 40: East Asia Market Volume (Unit Pack) Forecast by Flavour Type, 2019 to 2034

Table 41: East Asia Market Value (US$ Million) Forecast by Distribution Channel, 2019 to 2034

Table 42: East Asia Market Volume (Unit Pack) Forecast by Distribution Channel, 2019 to 2034

Table 43: Middle East and Africa Market Value (US$ Million) Forecast by Country, 2019 to 2034

Table 44: Middle East and Africa Market Volume (Unit Pack) Forecast by Country, 2019 to 2034

Table 45: Middle East and Africa Market Value (US$ Million) Forecast by Flavour Type, 2019 to 2034

Table 46: Middle East and Africa Market Volume (Unit Pack) Forecast by Flavour Type, 2019 to 2034

Table 47: Middle East and Africa Market Value (US$ Million) Forecast by Distribution Channel, 2019 to 2034

Table 48: Middle East and Africa Market Volume (Unit Pack) Forecast by Distribution Channel, 2019 to 2034
Nandini Roy Choudhury

Principal Consultant

Talk to Analyst

Find your sweet spots for generating winning opportunities in this market.

List of Charts

Figure 1: Global Market Value (US$ Million) by Flavour Type, 2024 to 2034

Figure 2: Global Market Value (US$ Million) by Distribution Channel, 2024 to 2034

Figure 3: Global Market Value (US$ Million) by Region, 2024 to 2034

Figure 4: Global Market Value (US$ Million) Analysis by Region, 2019 to 2034

Figure 5: Global Market Volume (Unit Pack) Analysis by Region, 2019 to 2034

Figure 6: Global Market Value Share (%) and BPS Analysis by Region, 2024 to 2034

Figure 7: Global Market Y-o-Y Growth (%) Projections by Region, 2024 to 2034

Figure 8: Global Market Value (US$ Million) Analysis by Flavour Type, 2019 to 2034

Figure 9: Global Market Volume (Unit Pack) Analysis by Flavour Type, 2019 to 2034

Figure 10: Global Market Value Share (%) and BPS Analysis by Flavour Type, 2024 to 2034

Figure 11: Global Market Y-o-Y Growth (%) Projections by Flavour Type, 2024 to 2034

Figure 12: Global Market Value (US$ Million) Analysis by Distribution Channel, 2019 to 2034

Figure 13: Global Market Volume (Unit Pack) Analysis by Distribution Channel, 2019 to 2034

Figure 14: Global Market Value Share (%) and BPS Analysis by Distribution Channel, 2024 to 2034

Figure 15: Global Market Y-o-Y Growth (%) Projections by Distribution Channel, 2024 to 2034

Figure 16: Global Market Attractiveness by Flavour Type, 2024 to 2034

Figure 17: Global Market Attractiveness by Distribution Channel, 2024 to 2034

Figure 18: Global Market Attractiveness by Region, 2024 to 2034

Figure 19: North America Market Value (US$ Million) by Flavour Type, 2024 to 2034

Figure 20: North America Market Value (US$ Million) by Distribution Channel, 2024 to 2034

Figure 21: North America Market Value (US$ Million) by Country, 2024 to 2034

Figure 22: North America Market Value (US$ Million) Analysis by Country, 2019 to 2034

Figure 23: North America Market Volume (Unit Pack) Analysis by Country, 2019 to 2034

Figure 24: North America Market Value Share (%) and BPS Analysis by Country, 2024 to 2034

Figure 25: North America Market Y-o-Y Growth (%) Projections by Country, 2024 to 2034

Figure 26: North America Market Value (US$ Million) Analysis by Flavour Type, 2019 to 2034

Figure 27: North America Market Volume (Unit Pack) Analysis by Flavour Type, 2019 to 2034

Figure 28: North America Market Value Share (%) and BPS Analysis by Flavour Type, 2024 to 2034

Figure 29: North America Market Y-o-Y Growth (%) Projections by Flavour Type, 2024 to 2034

Figure 30: North America Market Value (US$ Million) Analysis by Distribution Channel, 2019 to 2034

Figure 31: North America Market Volume (Unit Pack) Analysis by Distribution Channel, 2019 to 2034

Figure 32: North America Market Value Share (%) and BPS Analysis by Distribution Channel, 2024 to 2034

Figure 33: North America Market Y-o-Y Growth (%) Projections by Distribution Channel, 2024 to 2034

Figure 34: North America Market Attractiveness by Flavour Type, 2024 to 2034

Figure 35: North America Market Attractiveness by Distribution Channel, 2024 to 2034

Figure 36: North America Market Attractiveness by Country, 2024 to 2034

Figure 37: Latin America Market Value (US$ Million) by Flavour Type, 2024 to 2034

Figure 38: Latin America Market Value (US$ Million) by Distribution Channel, 2024 to 2034

Figure 39: Latin America Market Value (US$ Million) by Country, 2024 to 2034

Figure 40: Latin America Market Value (US$ Million) Analysis by Country, 2019 to 2034

Figure 41: Latin America Market Volume (Unit Pack) Analysis by Country, 2019 to 2034

Figure 42: Latin America Market Value Share (%) and BPS Analysis by Country, 2024 to 2034

Figure 43: Latin America Market Y-o-Y Growth (%) Projections by Country, 2024 to 2034

Figure 44: Latin America Market Value (US$ Million) Analysis by Flavour Type, 2019 to 2034

Figure 45: Latin America Market Volume (Unit Pack) Analysis by Flavour Type, 2019 to 2034

Figure 46: Latin America Market Value Share (%) and BPS Analysis by Flavour Type, 2024 to 2034

Figure 47: Latin America Market Y-o-Y Growth (%) Projections by Flavour Type, 2024 to 2034

Figure 48: Latin America Market Value (US$ Million) Analysis by Distribution Channel, 2019 to 2034

Figure 49: Latin America Market Volume (Unit Pack) Analysis by Distribution Channel, 2019 to 2034

Figure 50: Latin America Market Value Share (%) and BPS Analysis by Distribution Channel, 2024 to 2034

Figure 51: Latin America Market Y-o-Y Growth (%) Projections by Distribution Channel, 2024 to 2034

Figure 52: Latin America Market Attractiveness by Flavour Type, 2024 to 2034

Figure 53: Latin America Market Attractiveness by Distribution Channel, 2024 to 2034

Figure 54: Latin America Market Attractiveness by Country, 2024 to 2034

Figure 55: Western Europe Market Value (US$ Million) by Flavour Type, 2024 to 2034

Figure 56: Western Europe Market Value (US$ Million) by Distribution Channel, 2024 to 2034

Figure 57: Western Europe Market Value (US$ Million) by Country, 2024 to 2034

Figure 58: Western Europe Market Value (US$ Million) Analysis by Country, 2019 to 2034

Figure 59: Western Europe Market Volume (Unit Pack) Analysis by Country, 2019 to 2034

Figure 60: Western Europe Market Value Share (%) and BPS Analysis by Country, 2024 to 2034

Figure 61: Western Europe Market Y-o-Y Growth (%) Projections by Country, 2024 to 2034

Figure 62: Western Europe Market Value (US$ Million) Analysis by Flavour Type, 2019 to 2034

Figure 63: Western Europe Market Volume (Unit Pack) Analysis by Flavour Type, 2019 to 2034

Figure 64: Western Europe Market Value Share (%) and BPS Analysis by Flavour Type, 2024 to 2034

Figure 65: Western Europe Market Y-o-Y Growth (%) Projections by Flavour Type, 2024 to 2034

Figure 66: Western Europe Market Value (US$ Million) Analysis by Distribution Channel, 2019 to 2034

Figure 67: Western Europe Market Volume (Unit Pack) Analysis by Distribution Channel, 2019 to 2034

Figure 68: Western Europe Market Value Share (%) and BPS Analysis by Distribution Channel, 2024 to 2034

Figure 69: Western Europe Market Y-o-Y Growth (%) Projections by Distribution Channel, 2024 to 2034

Figure 70: Western Europe Market Attractiveness by Flavour Type, 2024 to 2034

Figure 71: Western Europe Market Attractiveness by Distribution Channel, 2024 to 2034

Figure 72: Western Europe Market Attractiveness by Country, 2024 to 2034

Figure 73: Eastern Europe Market Value (US$ Million) by Flavour Type, 2024 to 2034

Figure 74: Eastern Europe Market Value (US$ Million) by Distribution Channel, 2024 to 2034

Figure 75: Eastern Europe Market Value (US$ Million) by Country, 2024 to 2034

Figure 76: Eastern Europe Market Value (US$ Million) Analysis by Country, 2019 to 2034

Figure 77: Eastern Europe Market Volume (Unit Pack) Analysis by Country, 2019 to 2034

Figure 78: Eastern Europe Market Value Share (%) and BPS Analysis by Country, 2024 to 2034

Figure 79: Eastern Europe Market Y-o-Y Growth (%) Projections by Country, 2024 to 2034

Figure 80: Eastern Europe Market Value (US$ Million) Analysis by Flavour Type, 2019 to 2034

Figure 81: Eastern Europe Market Volume (Unit Pack) Analysis by Flavour Type, 2019 to 2034

Figure 82: Eastern Europe Market Value Share (%) and BPS Analysis by Flavour Type, 2024 to 2034

Figure 83: Eastern Europe Market Y-o-Y Growth (%) Projections by Flavour Type, 2024 to 2034

Figure 84: Eastern Europe Market Value (US$ Million) Analysis by Distribution Channel, 2019 to 2034

Figure 85: Eastern Europe Market Volume (Unit Pack) Analysis by Distribution Channel, 2019 to 2034

Figure 86: Eastern Europe Market Value Share (%) and BPS Analysis by Distribution Channel, 2024 to 2034

Figure 87: Eastern Europe Market Y-o-Y Growth (%) Projections by Distribution Channel, 2024 to 2034

Figure 88: Eastern Europe Market Attractiveness by Flavour Type, 2024 to 2034

Figure 89: Eastern Europe Market Attractiveness by Distribution Channel, 2024 to 2034

Figure 90: Eastern Europe Market Attractiveness by Country, 2024 to 2034

Figure 91: South Asia and Pacific Market Value (US$ Million) by Flavour Type, 2024 to 2034

Figure 92: South Asia and Pacific Market Value (US$ Million) by Distribution Channel, 2024 to 2034

Figure 93: South Asia and Pacific Market Value (US$ Million) by Country, 2024 to 2034

Figure 94: South Asia and Pacific Market Value (US$ Million) Analysis by Country, 2019 to 2034

Figure 95: South Asia and Pacific Market Volume (Unit Pack) Analysis by Country, 2019 to 2034

Figure 96: South Asia and Pacific Market Value Share (%) and BPS Analysis by Country, 2024 to 2034

Figure 97: South Asia and Pacific Market Y-o-Y Growth (%) Projections by Country, 2024 to 2034

Figure 98: South Asia and Pacific Market Value (US$ Million) Analysis by Flavour Type, 2019 to 2034

Figure 99: South Asia and Pacific Market Volume (Unit Pack) Analysis by Flavour Type, 2019 to 2034

Figure 100: South Asia and Pacific Market Value Share (%) and BPS Analysis by Flavour Type, 2024 to 2034

Figure 101: South Asia and Pacific Market Y-o-Y Growth (%) Projections by Flavour Type, 2024 to 2034

Figure 102: South Asia and Pacific Market Value (US$ Million) Analysis by Distribution Channel, 2019 to 2034

Figure 103: South Asia and Pacific Market Volume (Unit Pack) Analysis by Distribution Channel, 2019 to 2034

Figure 104: South Asia and Pacific Market Value Share (%) and BPS Analysis by Distribution Channel, 2024 to 2034

Figure 105: South Asia and Pacific Market Y-o-Y Growth (%) Projections by Distribution Channel, 2024 to 2034

Figure 106: South Asia and Pacific Market Attractiveness by Flavour Type, 2024 to 2034

Figure 107: South Asia and Pacific Market Attractiveness by Distribution Channel, 2024 to 2034

Figure 108: South Asia and Pacific Market Attractiveness by Country, 2024 to 2034

Figure 109: East Asia Market Value (US$ Million) by Flavour Type, 2024 to 2034

Figure 110: East Asia Market Value (US$ Million) by Distribution Channel, 2024 to 2034

Figure 111: East Asia Market Value (US$ Million) by Country, 2024 to 2034

Figure 112: East Asia Market Value (US$ Million) Analysis by Country, 2019 to 2034

Figure 113: East Asia Market Volume (Unit Pack) Analysis by Country, 2019 to 2034

Figure 114: East Asia Market Value Share (%) and BPS Analysis by Country, 2024 to 2034

Figure 115: East Asia Market Y-o-Y Growth (%) Projections by Country, 2024 to 2034

Figure 116: East Asia Market Value (US$ Million) Analysis by Flavour Type, 2019 to 2034

Figure 117: East Asia Market Volume (Unit Pack) Analysis by Flavour Type, 2019 to 2034

Figure 118: East Asia Market Value Share (%) and BPS Analysis by Flavour Type, 2024 to 2034

Figure 119: East Asia Market Y-o-Y Growth (%) Projections by Flavour Type, 2024 to 2034

Figure 120: East Asia Market Value (US$ Million) Analysis by Distribution Channel, 2019 to 2034

Figure 121: East Asia Market Volume (Unit Pack) Analysis by Distribution Channel, 2019 to 2034

Figure 122: East Asia Market Value Share (%) and BPS Analysis by Distribution Channel, 2024 to 2034

Figure 123: East Asia Market Y-o-Y Growth (%) Projections by Distribution Channel, 2024 to 2034

Figure 124: East Asia Market Attractiveness by Flavour Type, 2024 to 2034

Figure 125: East Asia Market Attractiveness by Distribution Channel, 2024 to 2034

Figure 126: East Asia Market Attractiveness by Country, 2024 to 2034

Figure 127: Middle East and Africa Market Value (US$ Million) by Flavour Type, 2024 to 2034

Figure 128: Middle East and Africa Market Value (US$ Million) by Distribution Channel, 2024 to 2034

Figure 129: Middle East and Africa Market Value (US$ Million) by Country, 2024 to 2034

Figure 130: Middle East and Africa Market Value (US$ Million) Analysis by Country, 2019 to 2034

Figure 131: Middle East and Africa Market Volume (Unit Pack) Analysis by Country, 2019 to 2034

Figure 132: Middle East and Africa Market Value Share (%) and BPS Analysis by Country, 2024 to 2034

Figure 133: Middle East and Africa Market Y-o-Y Growth (%) Projections by Country, 2024 to 2034

Figure 134: Middle East and Africa Market Value (US$ Million) Analysis by Flavour Type, 2019 to 2034

Figure 135: Middle East and Africa Market Volume (Unit Pack) Analysis by Flavour Type, 2019 to 2034

Figure 136: Middle East and Africa Market Value Share (%) and BPS Analysis by Flavour Type, 2024 to 2034

Figure 137: Middle East and Africa Market Y-o-Y Growth (%) Projections by Flavour Type, 2024 to 2034

Figure 138: Middle East and Africa Market Value (US$ Million) Analysis by Distribution Channel, 2019 to 2034

Figure 139: Middle East and Africa Market Volume (Unit Pack) Analysis by Distribution Channel, 2019 to 2034

Figure 140: Middle East and Africa Market Value Share (%) and BPS Analysis by Distribution Channel, 2024 to 2034

Figure 141: Middle East and Africa Market Y-o-Y Growth (%) Projections by Distribution Channel, 2024 to 2034

Figure 142: Middle East and Africa Market Attractiveness by Flavour Type, 2024 to 2034

Figure 143: Middle East and Africa Market Attractiveness by Distribution Channel, 2024 to 2034

Figure 144: Middle East and Africa Market Attractiveness by Country, 2024 to 2034

Recommendations

Food and Beverage

Dietary Supplement Market

Published : January 2024

Food and Beverage

Sports Drink Market

Published : December 2022

Explore Food and Beverage Insights

View Reports

Energy Gel Product Market