Reports

- Global Locations -

Headquarters

Future Market Insights, Inc.

Christiana Corporate, 200
Continental Drive, Suite 401,
Newark, Delaware - 19713,
United States

T: +1-845-579-5705

Americas

Future Market Insights, Inc.

616 Corporate Way, Suite 2-9018,
Valley Cottage, NY 10989, United States

T: +1-347-918-3531

MEA

Future Market Insights

1602-6 Jumeirah Bay X2 Tower, Plot No: JLT-PH2-X2A,
Jumeirah Lakes Towers, Dubai,
United Arab Emirates

Europe

Future Market Insights

3rd Floor, 207 Regent Street,
W1B 3HH London
United Kingdom

T: + 44 (0) 20 8123 9659
D: +44 (0) 20 3287 4268

Asia Pacific

Future Market Insights

IndiaLand Global Tech Park, Unit UG-1, Behind Grand HighStreet, Phase 1, Hinjawadi, MH, Pune – 411057, India

Energy Efficient Motor Market Outlook from 2024 to 2034

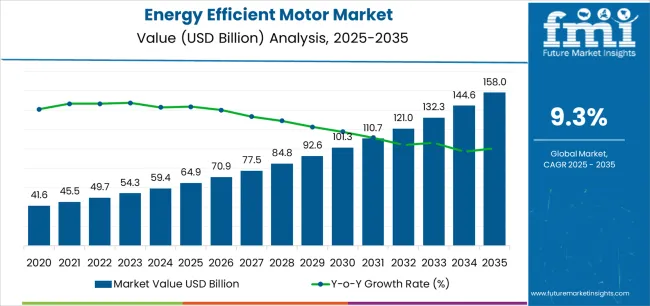
The energy efficient motor market is expected to be valued at US$ 59.1 billion in 2024 and rise to US$ 151.0 billion by 2034. It is projected to grow at a CAGR of 9.8% during the forecast period. The energy efficient motor market is growing due to the increasing awareness of environmental sustainability and regulatory mandates driving demand for energy-saving solutions.

Key Market Drivers

  • Strict energy efficiency regulations drive industries to adopt energy efficient motors to comply with environmental mandates and reduce carbon emissions.
  • Escalating energy prices are compelling industries to seek energy-saving solutions to lower operational costs.
  • Energy-efficient motors offer significant energy savings over traditional motors, making them attractive to end-users looking to reduce their utility bills.
  • Growing awareness of environmental issues and the need for sustainable practices drive industries to prioritize energy efficiency.
  • Energy efficient motors help companies minimize their carbon footprint and align with sustainability objectives.
  • Ongoing advancements in motor design have led to the development of highly efficient motors with improved performance and reliability. Features such as variable frequency drives (VFDs), permanent magnet motors, and advanced control systems enhance motor efficiency, driving adoption in various industries.
  • Government incentives, rebates, and subsidies for energy-efficient motor installations incentivize businesses to invest in these technologies.
  • Growing demand for energy-efficient motors is observed in key industries such as manufacturing, HVAC, automotive, and agriculture.
  • Energy-efficient motors offer long-term cost savings over their lifecycle due to reduced energy consumption, lower maintenance requirements, and extended operational life.
Attributes Key Statistics
Energy Efficient Motor Market Value (2024) US$ 59.1 billion
Anticipated Market Value (2034) US$ 151.0 billion
Estimated Growth (2024 to 2034) 9.8% CAGR

Don't pay for what you don't need

Customize your report by selecting specific countries or regions and save 30%!

Consumption Analysis of the Energy Efficient Motor Market

  • The market is growing rapidly due to increased demand from various sectors such as manufacturing, HVAC, transportation, and utilities.
  • End-users clearly prefer energy-efficient motors as they offer tangible benefits such as reduced energy consumption, lower operating costs, and improved environmental sustainability.
  • Manufacturers and suppliers are taking advantage of the growing demand for energy-efficient motors by offering various innovative and technologically advanced motor solutions.
  • Energy-efficient motors are designed to meet or exceed energy efficiency standards set by regulatory bodies and industry organizations, providing customers with reliable, high-performance options that deliver long-term cost savings and environmental benefits.
  • Incentive programs, tax rebates, and government initiatives promote energy conservation and reduce carbon emissions further driving the adoption of energy-efficient motors.
  • The popularity of energy-efficient motors is increasing as more countries recognize the importance of reducing energy consumption and greenhouse gas emissions.
  • The adoption of energy-efficient motors is beneficial for the environment, businesses, and consumers. These motors offer long-term cost savings, improved performance, and a positive brand image, making them an attractive option for those looking to reduce their environmental footprint and save money in the long run.

Factors Adversely Affecting the Energy Efficient Motor Market

The energy efficient motor market is anticipated to surpass a valuation of US$ 151.0 billion by 2034, expanding at a growth rate of 9.8% CAGR. Despite the growth of the market, higher upfront costs can deter customers, especially in price-sensitive markets or industries.

  • Lack of awareness and understanding of the long-term benefits of energy-efficient motors can impede market growth, as consumers may prioritize short-term cost savings over long-term energy efficiency.
  • Retrofitting older equipment with energy-efficient motors requires system layout, controls, or wiring modifications, adding complexity and costs to the upgrade process.
  • Regulatory uncertainty or inconsistent enforcement of energy efficiency standards and incentives across different regions and industries can create market barriers.
  • Certain types of energy-efficient motor technologies may have technical limitations or performance trade-offs that restrict their applicability in specific applications or industries.
  • Collaboration between stakeholders, including governments, regulatory agencies, industry associations, manufacturers, and end-users, is essential for overcoming these barriers and fostering a supportive environment for energy-efficient motor deployment.
Nikhil Kaitwade
Nikhil Kaitwade

Principal Consultant

Talk to Analyst

Find your sweet spots for generating winning opportunities in this market.

Comparative View of Adjacent Industries

The section provides a comparative analysis of two other markets that have the potential to compete rigorously with the energy efficient motor market. These markets are the motor generator set market and the low-voltage motor market. The growth rates and current market valuations are mentioned in the tables below. The respective markets' growth factors and critical challenges are also discussed below.

Energy Efficient motor Market:

Attributes Energy Efficient Motor Market
CAGR (2024 to 2034) 9.8%
Market Value (2024) US$ 59.1 billion
Growth Factor Increasing awareness of environmental sustainability and regulatory mandates
Key Challenges Higher upfront costs, lack of awareness, retrofitting complexities, and inconsistent regulatory standards

Motor Generator Set Market:

Attributes Motor Generator Set Market
CAGR (2023 to 2033) 5.3 %
Market Value (2033) US$ 4.5 billion
Growth Factor The burgeoning demand in the industrial, commercial, and residential sectors is expected to boost market sales in the forecast period.
Key Challenges Increasing competition from alternative energy sources and advancements in energy storage technologies

Low Voltage Motor Market:

Attributes Low Voltage Motor Market
CAGR (2022 to 2032) 5.2%
Market Value (2032) US$ 75 Billion
Growth Factor Increasing industrial automation, rising demand for energy-efficient solutions, and technological advancements
Key Challenges High cost of producing low-voltage motors

Category-wise Insights

Superior Efficiency and Performance Characteristics of Super Premium-IE4

Attributes Details
Top Type Super premium IE4
CAGR (2024 to 2034) 9.5%

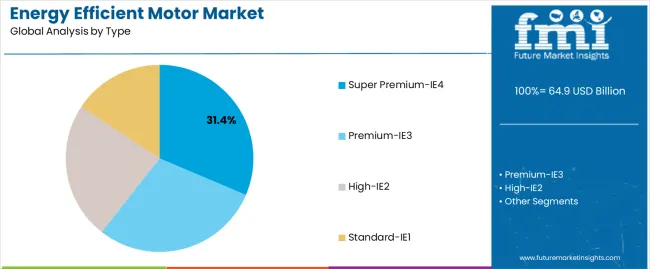
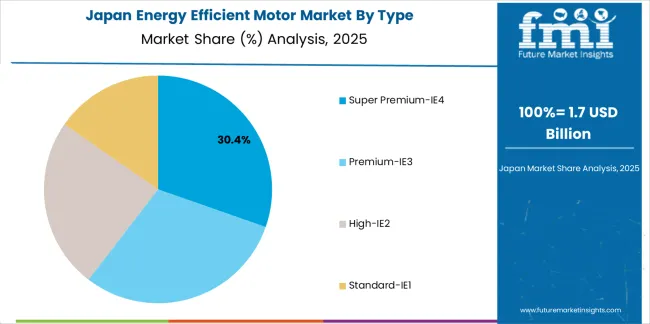
Super premium IE4 dominates the market based on the type. The segment is expected to expand at a 9.5% CAGR through 2034. This rising popularity of the segment is attributed to:

  • Super premium IE4 motors offer significant energy savings and reduced operating costs over their lifespan, making them an ideal choice for industries aiming to optimize energy consumption and reduce carbon footprint.
  • With energy efficiency levels approaching or exceeding 97%, Super premium IE4 motors represent the pinnacle of motor technology.
  • Advancements in motor design, materials, and manufacturing processes have made them more reliable, durable, and versatile, increasing adoption across various sectors.
  • Super premium-IE4 high-efficiency motors are highly sought after by industries looking to achieve carbon neutrality targets and comply with stringent energy regulations while enhancing operational sustainability.

Versatility, Reliability, and High Efficiency of AC Motors

Attributes Details
Top Product Type AC Motor
CAGR (2024 to 2034) 9.3%

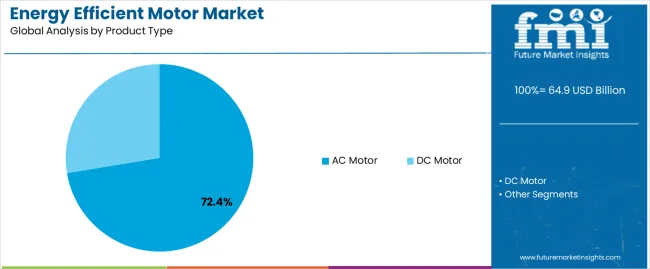
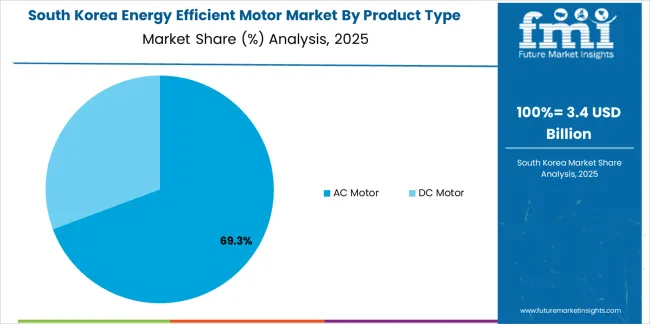
Based on the product type, AC motors dominate the market, expanding at an annual growth of 9.3% CAGR over the forecast period. The segment’s rising popularity is attributed to:

  • AC motors suit various applications, from powering industrial machinery to driving HVAC systems and appliances.
  • AC motors have undergone significant advancements in motor design, such as improved winding configurations, optimized magnetic circuits, and reduced rotor and stator component losses, resulting in substantial energy savings and reduced operating costs for end-users.
  • Continuous technological innovations and improvements in motor control drive systems, such as variable frequency drives (VFDs) and soft starters, enable precise speed control, reduce energy consumption, and improve overall system efficiency.
  • Ongoing advanced control technologies allow AC motors to operate at optimal performance levels across varying load conditions, maximizing energy efficiency and enhancing their appeal to industries seeking to minimize energy waste and environmental impact.

Get the data you need at a Fraction of the cost

Personalize your report by choosing insights you need
and save 40%!

Country-wise Insights

The section analyzes the energy efficient market by country, including the United States, the United Kingdom, China, Japan, and South Korea. The table presents the CAGRs for each country, indicating the expected market growth through 2034.

Countries CAGR (2024 to 2034)
United States 10.2%
United Kingdom 11.2%
China 10.7%
Japan 11.0%
South Korea 7.8%

The United Kingdom’s Commitment to Reducing Carbon Emissions

The United Kingdom is the leading European country in the energy efficiency motor market, and it is predicted to register an annual growth rate of 11.2% through 2034.

  • The United Kingdom’s government has implemented strict energy efficiency standards and incentive programs to encourage the adoption of energy-efficient technologies, including motors.
  • British industries and businesses recognize the long-term benefits of energy-efficient motors in terms of cost savings, environmental sustainability, and compliance with regulatory requirements, thus driving market dominance.

Strong Industrial Base, Stringent Energy Regulations, and a Focus on Sustainability in the United States

The United States dominates the energy efficiency motor market in the North American region. It is expected to exhibit an annual growth rate of 10.2% until 2034.

  • American industries prioritize energy efficiency to reduce operating costs and comply with environmental standards, driving demand for energy-efficient motors across manufacturing, HVAC, and transportation sectors.
  • The presence of leading motor manufacturers and technological innovators in the United States contributes to the country's dominance in the global market.

China’s Manufacturing Prowess and Rapid Industrialization

China is another Asian country in the global energy efficient motor market. The Chinese market is anticipated to register a CAGR of 10.7% through 2034.

  • China's dominance in the global energy efficient motor market is driven by its position as the world's largest manufacturing hub, rapid industrialization, and government initiatives to promote energy conservation and environmental protection.
  • Chinese industries face pressure to improve energy efficiency and reduce emissions, leading to the widespread adoption of energy-efficient motors in various applications.
  • China's significant investments in research and development and its large domestic market for motor products further bolster its leadership in the global market.

Japan’s Culture of Innovation, Technological Excellence, and Commitment to Energy Conservation

Japan is one of the leading Asian countries in the energy efficient motor market. The Japanese market is anticipated to register a CAGR of 11.0% through 2034.

  • Japanese industries prioritize energy efficiency as part of their corporate sustainability strategies, driving demand for advanced motor technologies that offer superior performance and efficiency.
  • Japan's stringent energy efficiency standards, government incentives, and technological advancements support the country's leadership in the global market for energy-efficient motors.

South Korea’s Manufacturing Sector and Technological Expertise

South Korea is another Asian country in the energy efficient motor market. The Korean market is expected to grow annually at a CAGR of 7.8% until 2034.

  • South Korea's global energy efficient motor market dominance is fueled by its government initiatives to promote energy conservation and green growth.
  • South Korean industries prioritize energy efficiency to enhance competitiveness and reduce environmental impact, leading to the widespread adoption of energy-efficient motors across various applications.
  • South Korean motor manufacturers are renowned for their innovation and quality, further solidifying their position as a global market leader.

Competitive Landscape

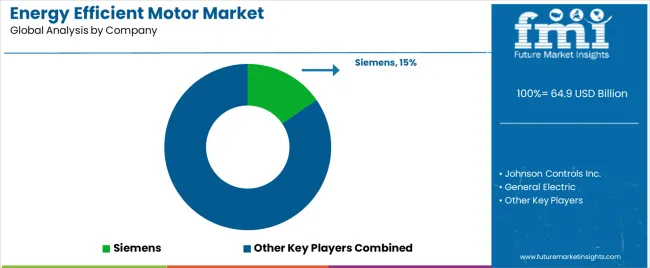
Siemens AG is a leading player in the energy efficient motor market, with a wide range of innovative solutions across various industries. The company's commitment to technology, sustainability, and digitalization has helped it become a market leader.

ABB Ltd. is another key player focused on sustainability; its global presence and strategic partnerships have made it a leading provider of energy-efficient motor solutions, driving market growth and innovation.

The emphasis on research and development, strong manufacturing capabilities, and global distribution network of WEG Industries enables it to meet the unique needs of industries seeking energy-efficient solutions.

Nidec Corporation has extensive expertise in motor technologies and a focus on sustainability, continuous innovation, and strategic investments to help drive growth and foster market expansion by providing cutting-edge motor solutions tailored to the unique requirements of diverse industries and applications.

Recent Developments

  • On February 3, 2024, WEG Africa commended the South African government's introduction of minimum energy performance standards (MEPS). With many electric motors lacking efficiency, this initiative was deemed timely and necessary to improve energy standards within the country.
  • On June 23, 2023, ABB introduced the AMI 5800 NEMA modular induction motor, designed for demanding applications in the oil and gas industry. With exceptional energy efficiency and reliability, this motor offers up to 1750 HP power output, providing modularity and customization for various industries, including chemical, oil, and gas.
  • On February 8, 2023, KEB Automation utilized Yokogawa’s WT5000 Precision Power analyzer to develop its newest frequency converters for variable speed drives. This initiative ensured compliance with the European Union's (EU) energy efficiency regulations, specifically the Ecodesign Directive, highlighting the company's commitment to high-efficiency motor drives.

Key Companies in the Market

  • Johnson Controls Inc.
  • General Electric
  • Marathon Electric
  • Honeywell International Inc.
  • Schneider Electric SE
  • ABB
  • Siemens
  • Rockwell
  • Crompton Greaves
  • Kirloskar Electric Company Ltd.
  • Bosch Rexroth AG
  • Regal Beloit Corporation
  • Nidec Motor Corporation
  • WEG

Market Segmentation

By Type:

  • Super premium-IE4
  • Premium-IE3
  • High-IE2
  • Standard-IE1

By Product Type:

  • AC Motor
  • DC Motor

By Application:

  • Pumps
  • Fans
  • Compressed Air
  • Refrigeration
  • Material Handling
  • Material Processing

By End User:

  • Industrial
  • Commercial
  • Residential
  • Agriculture Sector
  • Others

By Region:

  • Asia Pacific
  • Europe
  • North America
  • Middle East & Africa
  • Latin America

Frequently Asked Questions

What is the Energy Efficient Motor Market Value in 2024?

The energy efficient motor market is predicted to be worth US$ 59.1 billion in 2024.

What is the Sales Forecast for the Energy Efficient Motors through 2034?

The demand for energy efficient motors is expected to reach US$ 151.0 billion by 2034.

At What Rate is the Energy Efficient Motor Market Growing over the Forecast Period?

The energy efficient motor market is growing at a CAGR of 9.8% from 2024 to 2034.

Which are the Key Companies in the Market?

Some of the key players in the market are Johnson Controls Inc., Bosch Rexroth, General Electric, Marathon Electric, Honeywell International, Inc., Schneider Electric SE, etc.

Which is the Top Product of the Energy Efficient Motor Market?

The AC motor segment is expected to lead the market by product type.

Table of Content

1. Executive Summary

    1.1. Global Market Outlook

    1.2. Demand-side Trends

    1.3. Supply-side Trends

    1.4. Technology Roadmap Analysis

    1.5. Analysis and Recommendations

2. Market Overview

    2.1. Market Coverage / Taxonomy

    2.2. Market Definition / Scope / Limitations

3. Market Background

    3.1. Market Dynamics

        3.1.1. Drivers

        3.1.2. Restraints

        3.1.3. Opportunity

        3.1.4. Trends

    3.2. Scenario Forecast

        3.2.1. Demand in Optimistic Scenario

        3.2.2. Demand in Likely Scenario

        3.2.3. Demand in Conservative Scenario

    3.3. Opportunity Map Analysis

    3.4. Product Life Cycle Analysis

    3.5. Supply Chain Analysis

        3.5.1. Supply Side Participants and their Roles

            3.5.1.1. Producers

            3.5.1.2. Mid-Level Participants (Traders/ Agents/ Brokers)

            3.5.1.3. Wholesalers and Distributors

        3.5.2. Value Added and Value Created at Node in the Supply Chain

        3.5.3. List of Raw Material Suppliers

        3.5.4. List of Existing and Potential Buyer’s

    3.6. Investment Feasibility Matrix

    3.7. Value Chain Analysis

        3.7.1. Profit Margin Analysis

        3.7.2. Wholesalers and Distributors

        3.7.3. Retailers

    3.8. PESTLE and Porter’s Analysis

    3.9. Regulatory Landscape

        3.9.1. By Key Regions

        3.9.2. By Key Countries

    3.10. Regional Parent Market Outlook

    3.11. Production and Consumption Statistics

    3.12. Import and Export Statistics

4. Global Market Analysis 2019 to 2023 and Forecast, 2024 to 2034

    4.1. Historical Market Size Value (US$ Million) & Volume (Units) Analysis, 2019 to 2023

    4.2. Current and Future Market Size Value (US$ Million) & Volume (Units) Projections, 2024 to 2034

        4.2.1. Y-o-Y Growth Trend Analysis

        4.2.2. Absolute $ Opportunity Analysis

5. Global Market Analysis 2019 to 2023 and Forecast 2024 to 2034, By Type

    5.1. Introduction / Key Findings

    5.2. Historical Market Size Value (US$ Million) & Volume (Units) Analysis By Type, 2019 to 2023

    5.3. Current and Future Market Size Value (US$ Million) & Volume (Units) Analysis and Forecast By Type, 2024 to 2034

        5.3.1. Super premium-IE4

        5.3.2. Premium-IE3

        5.3.3. High-IE2

        5.3.4. Standard-IE1

    5.4. Y-o-Y Growth Trend Analysis By Type, 2019 to 2023

    5.5. Absolute $ Opportunity Analysis By Type, 2024 to 2034

6. Global Market Analysis 2019 to 2023 and Forecast 2024 to 2034, By Product Type

    6.1. Introduction / Key Findings

    6.2. Historical Market Size Value (US$ Million) & Volume (Units) Analysis By Product Type, 2019 to 2023

    6.3. Current and Future Market Size Value (US$ Million) & Volume (Units) Analysis and Forecast By Product Type, 2024 to 2034

        6.3.1. AC Motor

        6.3.2. DC Motor

    6.4. Y-o-Y Growth Trend Analysis By Product Type, 2019 to 2023

    6.5. Absolute $ Opportunity Analysis By Product Type, 2024 to 2034

7. Global Market Analysis 2019 to 2023 and Forecast 2024 to 2034, By Application

    7.1. Introduction / Key Findings

    7.2. Historical Market Size Value (US$ Million) & Volume (Units) Analysis By Application, 2019 to 2023

    7.3. Current and Future Market Size Value (US$ Million) & Volume (Units) Analysis and Forecast By Application, 2024 to 2034

        7.3.1. Pumps

        7.3.2. Fans

        7.3.3. Compressed Air

        7.3.4. Refrigeration

        7.3.5. Material Handling

        7.3.6. Material Processing

    7.4. Y-o-Y Growth Trend Analysis By Application, 2019 to 2023

    7.5. Absolute $ Opportunity Analysis By Application, 2024 to 2034

8. Global Market Analysis 2019 to 2023 and Forecast 2024 to 2034, By End User

    8.1. Introduction / Key Findings

    8.2. Historical Market Size Value (US$ Million) & Volume (Units) Analysis By End User, 2019 to 2023

    8.3. Current and Future Market Size Value (US$ Million) & Volume (Units) Analysis and Forecast By End User, 2024 to 2034

        8.3.1. Industrial

        8.3.2. Commercial

        8.3.3. Residential

        8.3.4. Agriculture Sector

        8.3.5. Others

    8.4. Y-o-Y Growth Trend Analysis By End User, 2019 to 2023

    8.5. Absolute $ Opportunity Analysis By End User, 2024 to 2034

9. Global Market Analysis 2019 to 2023 and Forecast 2024 to 2034, By Region

    9.1. Introduction

    9.2. Historical Market Size Value (US$ Million) & Volume (Units) Analysis By Region, 2019 to 2023

    9.3. Current Market Size Value (US$ Million) & Volume (Units) Analysis and Forecast By Region, 2024 to 2034

        9.3.1. North America

        9.3.2. Latin America

        9.3.3. Western Europe

        9.3.4. Eastern Europe

        9.3.5. South Asia and Pacific

        9.3.6. East Asia

        9.3.7. Middle East and Africa

    9.4. Market Attractiveness Analysis By Region

10. North America Market Analysis 2019 to 2023 and Forecast 2024 to 2034, By Country

    10.1. Historical Market Size Value (US$ Million) & Volume (Units) Trend Analysis By Market Taxonomy, 2019 to 2023

    10.2. Market Size Value (US$ Million) & Volume (Units) Forecast By Market Taxonomy, 2024 to 2034

        10.2.1. By Country

            10.2.1.1. USA

            10.2.1.2. Canada

        10.2.2. By Type

        10.2.3. By Product Type

        10.2.4. By Application

        10.2.5. By End User

    10.3. Market Attractiveness Analysis

        10.3.1. By Country

        10.3.2. By Type

        10.3.3. By Product Type

        10.3.4. By Application

        10.3.5. By End User

    10.4. Key Takeaways

11. Latin America Market Analysis 2019 to 2023 and Forecast 2024 to 2034, By Country

    11.1. Historical Market Size Value (US$ Million) & Volume (Units) Trend Analysis By Market Taxonomy, 2019 to 2023

    11.2. Market Size Value (US$ Million) & Volume (Units) Forecast By Market Taxonomy, 2024 to 2034

        11.2.1. By Country

            11.2.1.1. Brazil

            11.2.1.2. Mexico

            11.2.1.3. Rest of Latin America

        11.2.2. By Type

        11.2.3. By Product Type

        11.2.4. By Application

        11.2.5. By End User

    11.3. Market Attractiveness Analysis

        11.3.1. By Country

        11.3.2. By Type

        11.3.3. By Product Type

        11.3.4. By Application

        11.3.5. By End User

    11.4. Key Takeaways

12. Western Europe Market Analysis 2019 to 2023 and Forecast 2024 to 2034, By Country

    12.1. Historical Market Size Value (US$ Million) & Volume (Units) Trend Analysis By Market Taxonomy, 2019 to 2023

    12.2. Market Size Value (US$ Million) & Volume (Units) Forecast By Market Taxonomy, 2024 to 2034

        12.2.1. By Country

            12.2.1.1. Germany

            12.2.1.2. UK

            12.2.1.3. France

            12.2.1.4. Spain

            12.2.1.5. Italy

            12.2.1.6. Rest of Western Europe

        12.2.2. By Type

        12.2.3. By Product Type

        12.2.4. By Application

        12.2.5. By End User

    12.3. Market Attractiveness Analysis

        12.3.1. By Country

        12.3.2. By Type

        12.3.3. By Product Type

        12.3.4. By Application

        12.3.5. By End User

    12.4. Key Takeaways

13. Eastern Europe Market Analysis 2019 to 2023 and Forecast 2024 to 2034, By Country

    13.1. Historical Market Size Value (US$ Million) & Volume (Units) Trend Analysis By Market Taxonomy, 2019 to 2023

    13.2. Market Size Value (US$ Million) & Volume (Units) Forecast By Market Taxonomy, 2024 to 2034

        13.2.1. By Country

            13.2.1.1. Poland

            13.2.1.2. Russia

            13.2.1.3. Czech Republic

            13.2.1.4. Romania

            13.2.1.5. Rest of Eastern Europe

        13.2.2. By Type

        13.2.3. By Product Type

        13.2.4. By Application

        13.2.5. By End User

    13.3. Market Attractiveness Analysis

        13.3.1. By Country

        13.3.2. By Type

        13.3.3. By Product Type

        13.3.4. By Application

        13.3.5. By End User

    13.4. Key Takeaways

14. South Asia and Pacific Market Analysis 2019 to 2023 and Forecast 2024 to 2034, By Country

    14.1. Historical Market Size Value (US$ Million) & Volume (Units) Trend Analysis By Market Taxonomy, 2019 to 2023

    14.2. Market Size Value (US$ Million) & Volume (Units) Forecast By Market Taxonomy, 2024 to 2034

        14.2.1. By Country

            14.2.1.1. India

            14.2.1.2. Bangladesh

            14.2.1.3. Australia

            14.2.1.4. New Zealand

            14.2.1.5. Rest of South Asia and Pacific

        14.2.2. By Type

        14.2.3. By Product Type

        14.2.4. By Application

        14.2.5. By End User

    14.3. Market Attractiveness Analysis

        14.3.1. By Country

        14.3.2. By Type

        14.3.3. By Product Type

        14.3.4. By Application

        14.3.5. By End User

    14.4. Key Takeaways

15. East Asia Market Analysis 2019 to 2023 and Forecast 2024 to 2034, By Country

    15.1. Historical Market Size Value (US$ Million) & Volume (Units) Trend Analysis By Market Taxonomy, 2019 to 2023

    15.2. Market Size Value (US$ Million) & Volume (Units) Forecast By Market Taxonomy, 2024 to 2034

        15.2.1. By Country

            15.2.1.1. China

            15.2.1.2. Japan

            15.2.1.3. South Korea

        15.2.2. By Type

        15.2.3. By Product Type

        15.2.4. By Application

        15.2.5. By End User

    15.3. Market Attractiveness Analysis

        15.3.1. By Country

        15.3.2. By Type

        15.3.3. By Product Type

        15.3.4. By Application

        15.3.5. By End User

    15.4. Key Takeaways

16. Middle East and Africa Market Analysis 2019 to 2023 and Forecast 2024 to 2034, By Country

    16.1. Historical Market Size Value (US$ Million) & Volume (Units) Trend Analysis By Market Taxonomy, 2019 to 2023

    16.2. Market Size Value (US$ Million) & Volume (Units) Forecast By Market Taxonomy, 2024 to 2034

        16.2.1. By Country

            16.2.1.1. GCC Countries

            16.2.1.2. South Africa

            16.2.1.3. Israel

            16.2.1.4. Rest of MEA

        16.2.2. By Type

        16.2.3. By Product Type

        16.2.4. By Application

        16.2.5. By End User

    16.3. Market Attractiveness Analysis

        16.3.1. By Country

        16.3.2. By Type

        16.3.3. By Product Type

        16.3.4. By Application

        16.3.5. By End User

    16.4. Key Takeaways

17. Key Countries Market Analysis

    17.1. USA

        17.1.1. Pricing Analysis

        17.1.2. Market Share Analysis, 2023

            17.1.2.1. By Type

            17.1.2.2. By Product Type

            17.1.2.3. By Application

            17.1.2.4. By End User

    17.2. Canada

        17.2.1. Pricing Analysis

        17.2.2. Market Share Analysis, 2023

            17.2.2.1. By Type

            17.2.2.2. By Product Type

            17.2.2.3. By Application

            17.2.2.4. By End User

    17.3. Brazil

        17.3.1. Pricing Analysis

        17.3.2. Market Share Analysis, 2023

            17.3.2.1. By Type

            17.3.2.2. By Product Type

            17.3.2.3. By Application

            17.3.2.4. By End User

    17.4. Mexico

        17.4.1. Pricing Analysis

        17.4.2. Market Share Analysis, 2023

            17.4.2.1. By Type

            17.4.2.2. By Product Type

            17.4.2.3. By Application

            17.4.2.4. By End User

    17.5. Germany

        17.5.1. Pricing Analysis

        17.5.2. Market Share Analysis, 2023

            17.5.2.1. By Type

            17.5.2.2. By Product Type

            17.5.2.3. By Application

            17.5.2.4. By End User

    17.6. UK

        17.6.1. Pricing Analysis

        17.6.2. Market Share Analysis, 2023

            17.6.2.1. By Type

            17.6.2.2. By Product Type

            17.6.2.3. By Application

            17.6.2.4. By End User

    17.7. France

        17.7.1. Pricing Analysis

        17.7.2. Market Share Analysis, 2023

            17.7.2.1. By Type

            17.7.2.2. By Product Type

            17.7.2.3. By Application

            17.7.2.4. By End User

    17.8. Spain

        17.8.1. Pricing Analysis

        17.8.2. Market Share Analysis, 2023

            17.8.2.1. By Type

            17.8.2.2. By Product Type

            17.8.2.3. By Application

            17.8.2.4. By End User

    17.9. Italy

        17.9.1. Pricing Analysis

        17.9.2. Market Share Analysis, 2023

            17.9.2.1. By Type

            17.9.2.2. By Product Type

            17.9.2.3. By Application

            17.9.2.4. By End User

    17.10. Poland

        17.10.1. Pricing Analysis

        17.10.2. Market Share Analysis, 2023

            17.10.2.1. By Type

            17.10.2.2. By Product Type

            17.10.2.3. By Application

            17.10.2.4. By End User

    17.11. Russia

        17.11.1. Pricing Analysis

        17.11.2. Market Share Analysis, 2023

            17.11.2.1. By Type

            17.11.2.2. By Product Type

            17.11.2.3. By Application

            17.11.2.4. By End User

    17.12. Czech Republic

        17.12.1. Pricing Analysis

        17.12.2. Market Share Analysis, 2023

            17.12.2.1. By Type

            17.12.2.2. By Product Type

            17.12.2.3. By Application

            17.12.2.4. By End User

    17.13. Romania

        17.13.1. Pricing Analysis

        17.13.2. Market Share Analysis, 2023

            17.13.2.1. By Type

            17.13.2.2. By Product Type

            17.13.2.3. By Application

            17.13.2.4. By End User

    17.14. India

        17.14.1. Pricing Analysis

        17.14.2. Market Share Analysis, 2023

            17.14.2.1. By Type

            17.14.2.2. By Product Type

            17.14.2.3. By Application

            17.14.2.4. By End User

    17.15. Bangladesh

        17.15.1. Pricing Analysis

        17.15.2. Market Share Analysis, 2023

            17.15.2.1. By Type

            17.15.2.2. By Product Type

            17.15.2.3. By Application

            17.15.2.4. By End User

    17.16. Australia

        17.16.1. Pricing Analysis

        17.16.2. Market Share Analysis, 2023

            17.16.2.1. By Type

            17.16.2.2. By Product Type

            17.16.2.3. By Application

            17.16.2.4. By End User

    17.17. New Zealand

        17.17.1. Pricing Analysis

        17.17.2. Market Share Analysis, 2023

            17.17.2.1. By Type

            17.17.2.2. By Product Type

            17.17.2.3. By Application

            17.17.2.4. By End User

    17.18. China

        17.18.1. Pricing Analysis

        17.18.2. Market Share Analysis, 2023

            17.18.2.1. By Type

            17.18.2.2. By Product Type

            17.18.2.3. By Application

            17.18.2.4. By End User

    17.19. Japan

        17.19.1. Pricing Analysis

        17.19.2. Market Share Analysis, 2023

            17.19.2.1. By Type

            17.19.2.2. By Product Type

            17.19.2.3. By Application

            17.19.2.4. By End User

    17.20. South Korea

        17.20.1. Pricing Analysis

        17.20.2. Market Share Analysis, 2023

            17.20.2.1. By Type

            17.20.2.2. By Product Type

            17.20.2.3. By Application

            17.20.2.4. By End User

    17.21. GCC Countries

        17.21.1. Pricing Analysis

        17.21.2. Market Share Analysis, 2023

            17.21.2.1. By Type

            17.21.2.2. By Product Type

            17.21.2.3. By Application

            17.21.2.4. By End User

    17.22. South Africa

        17.22.1. Pricing Analysis

        17.22.2. Market Share Analysis, 2023

            17.22.2.1. By Type

            17.22.2.2. By Product Type

            17.22.2.3. By Application

            17.22.2.4. By End User

    17.23. Israel

        17.23.1. Pricing Analysis

        17.23.2. Market Share Analysis, 2023

            17.23.2.1. By Type

            17.23.2.2. By Product Type

            17.23.2.3. By Application

            17.23.2.4. By End User

18. Market Structure Analysis

    18.1. Competition Dashboard

    18.2. Competition Benchmarking

    18.3. Market Share Analysis of Top Players

        18.3.1. By Regional

        18.3.2. By Type

        18.3.3. By Product Type

        18.3.4. By Application

        18.3.5. By End User

19. Competition Analysis

    19.1. Competition Deep Dive

        19.1.1. Johnson Controls Inc.

            19.1.1.1. Overview

            19.1.1.2. Product Portfolio

            19.1.1.3. Profitability by Market Segments

            19.1.1.4. Sales Footprint

            19.1.1.5. Strategy Overview

                19.1.1.5.1. Marketing Strategy

                19.1.1.5.2. Product Strategy

                19.1.1.5.3. Channel Strategy

        19.1.2. Bosch Rexroth

            19.1.2.1. Overview

            19.1.2.2. Product Portfolio

            19.1.2.3. Profitability by Market Segments

            19.1.2.4. Sales Footprint

            19.1.2.5. Strategy Overview

                19.1.2.5.1. Marketing Strategy

                19.1.2.5.2. Product Strategy

                19.1.2.5.3. Channel Strategy

        19.1.3. General Electric

            19.1.3.1. Overview

            19.1.3.2. Product Portfolio

            19.1.3.3. Profitability by Market Segments

            19.1.3.4. Sales Footprint

            19.1.3.5. Strategy Overview

                19.1.3.5.1. Marketing Strategy

                19.1.3.5.2. Product Strategy

                19.1.3.5.3. Channel Strategy

        19.1.4. Marathon Electric

            19.1.4.1. Overview

            19.1.4.2. Product Portfolio

            19.1.4.3. Profitability by Market Segments

            19.1.4.4. Sales Footprint

            19.1.4.5. Strategy Overview

                19.1.4.5.1. Marketing Strategy

                19.1.4.5.2. Product Strategy

                19.1.4.5.3. Channel Strategy

        19.1.5. Honeywell International Inc.

            19.1.5.1. Overview

            19.1.5.2. Product Portfolio

            19.1.5.3. Profitability by Market Segments

            19.1.5.4. Sales Footprint

            19.1.5.5. Strategy Overview

                19.1.5.5.1. Marketing Strategy

                19.1.5.5.2. Product Strategy

                19.1.5.5.3. Channel Strategy

        19.1.6. Schneider Electric SE

            19.1.6.1. Overview

            19.1.6.2. Product Portfolio

            19.1.6.3. Profitability by Market Segments

            19.1.6.4. Sales Footprint

            19.1.6.5. Strategy Overview

                19.1.6.5.1. Marketing Strategy

                19.1.6.5.2. Product Strategy

                19.1.6.5.3. Channel Strategy

        19.1.7. Microchip Technology Inc.

            19.1.7.1. Overview

            19.1.7.2. Product Portfolio

            19.1.7.3. Profitability by Market Segments

            19.1.7.4. Sales Footprint

            19.1.7.5. Strategy Overview

                19.1.7.5.1. Marketing Strategy

                19.1.7.5.2. Product Strategy

                19.1.7.5.3. Channel Strategy

        19.1.8. AG Regal

            19.1.8.1. Overview

            19.1.8.2. Product Portfolio

            19.1.8.3. Profitability by Market Segments

            19.1.8.4. Sales Footprint

            19.1.8.5. Strategy Overview

                19.1.8.5.1. Marketing Strategy

                19.1.8.5.2. Product Strategy

                19.1.8.5.3. Channel Strategy

        19.1.9. Crompton Greaves

            19.1.9.1. Overview

            19.1.9.2. Product Portfolio

            19.1.9.3. Profitability by Market Segments

            19.1.9.4. Sales Footprint

            19.1.9.5. Strategy Overview

                19.1.9.5.1. Marketing Strategy

                19.1.9.5.2. Product Strategy

                19.1.9.5.3. Channel Strategy

        19.1.10. ABB Ltd

            19.1.10.1. Overview

            19.1.10.2. Product Portfolio

            19.1.10.3. Profitability by Market Segments

            19.1.10.4. Sales Footprint

            19.1.10.5. Strategy Overview

                19.1.10.5.1. Marketing Strategy

                19.1.10.5.2. Product Strategy

                19.1.10.5.3. Channel Strategy

20. Assumptions & Acronyms Used

21. Research Methodology

List of Tables

Table 1: Global Market Value (US$ Million) Forecast by Region, 2019 to 2034

Table 2: Global Market Volume (Units) Forecast by Region, 2019 to 2034

Table 3: Global Market Value (US$ Million) Forecast by Type, 2019 to 2034

Table 4: Global Market Volume (Units) Forecast by Type, 2019 to 2034

Table 5: Global Market Value (US$ Million) Forecast by Product Type, 2019 to 2034

Table 6: Global Market Volume (Units) Forecast by Product Type, 2019 to 2034

Table 7: Global Market Value (US$ Million) Forecast by Application, 2019 to 2034

Table 8: Global Market Volume (Units) Forecast by Application, 2019 to 2034

Table 9: Global Market Value (US$ Million) Forecast by End User, 2019 to 2034

Table 10: Global Market Volume (Units) Forecast by End User, 2019 to 2034

Table 11: North America Market Value (US$ Million) Forecast by Country, 2019 to 2034

Table 12: North America Market Volume (Units) Forecast by Country, 2019 to 2034

Table 13: North America Market Value (US$ Million) Forecast by Type, 2019 to 2034

Table 14: North America Market Volume (Units) Forecast by Type, 2019 to 2034

Table 15: North America Market Value (US$ Million) Forecast by Product Type, 2019 to 2034

Table 16: North America Market Volume (Units) Forecast by Product Type, 2019 to 2034

Table 17: North America Market Value (US$ Million) Forecast by Application, 2019 to 2034

Table 18: North America Market Volume (Units) Forecast by Application, 2019 to 2034

Table 19: North America Market Value (US$ Million) Forecast by End User, 2019 to 2034

Table 20: North America Market Volume (Units) Forecast by End User, 2019 to 2034

Table 21: Latin America Market Value (US$ Million) Forecast by Country, 2019 to 2034

Table 22: Latin America Market Volume (Units) Forecast by Country, 2019 to 2034

Table 23: Latin America Market Value (US$ Million) Forecast by Type, 2019 to 2034

Table 24: Latin America Market Volume (Units) Forecast by Type, 2019 to 2034

Table 25: Latin America Market Value (US$ Million) Forecast by Product Type, 2019 to 2034

Table 26: Latin America Market Volume (Units) Forecast by Product Type, 2019 to 2034

Table 27: Latin America Market Value (US$ Million) Forecast by Application, 2019 to 2034

Table 28: Latin America Market Volume (Units) Forecast by Application, 2019 to 2034

Table 29: Latin America Market Value (US$ Million) Forecast by End User, 2019 to 2034

Table 30: Latin America Market Volume (Units) Forecast by End User, 2019 to 2034

Table 31: Western Europe Market Value (US$ Million) Forecast by Country, 2019 to 2034

Table 32: Western Europe Market Volume (Units) Forecast by Country, 2019 to 2034

Table 33: Western Europe Market Value (US$ Million) Forecast by Type, 2019 to 2034

Table 34: Western Europe Market Volume (Units) Forecast by Type, 2019 to 2034

Table 35: Western Europe Market Value (US$ Million) Forecast by Product Type, 2019 to 2034

Table 36: Western Europe Market Volume (Units) Forecast by Product Type, 2019 to 2034

Table 37: Western Europe Market Value (US$ Million) Forecast by Application, 2019 to 2034

Table 38: Western Europe Market Volume (Units) Forecast by Application, 2019 to 2034

Table 39: Western Europe Market Value (US$ Million) Forecast by End User, 2019 to 2034

Table 40: Western Europe Market Volume (Units) Forecast by End User, 2019 to 2034

Table 41: Eastern Europe Market Value (US$ Million) Forecast by Country, 2019 to 2034

Table 42: Eastern Europe Market Volume (Units) Forecast by Country, 2019 to 2034

Table 43: Eastern Europe Market Value (US$ Million) Forecast by Type, 2019 to 2034

Table 44: Eastern Europe Market Volume (Units) Forecast by Type, 2019 to 2034

Table 45: Eastern Europe Market Value (US$ Million) Forecast by Product Type, 2019 to 2034

Table 46: Eastern Europe Market Volume (Units) Forecast by Product Type, 2019 to 2034

Table 47: Eastern Europe Market Value (US$ Million) Forecast by Application, 2019 to 2034

Table 48: Eastern Europe Market Volume (Units) Forecast by Application, 2019 to 2034

Table 49: Eastern Europe Market Value (US$ Million) Forecast by End User, 2019 to 2034

Table 50: Eastern Europe Market Volume (Units) Forecast by End User, 2019 to 2034

Table 51: South Asia and Pacific Market Value (US$ Million) Forecast by Country, 2019 to 2034

Table 52: South Asia and Pacific Market Volume (Units) Forecast by Country, 2019 to 2034

Table 53: South Asia and Pacific Market Value (US$ Million) Forecast by Type, 2019 to 2034

Table 54: South Asia and Pacific Market Volume (Units) Forecast by Type, 2019 to 2034

Table 55: South Asia and Pacific Market Value (US$ Million) Forecast by Product Type, 2019 to 2034

Table 56: South Asia and Pacific Market Volume (Units) Forecast by Product Type, 2019 to 2034

Table 57: South Asia and Pacific Market Value (US$ Million) Forecast by Application, 2019 to 2034

Table 58: South Asia and Pacific Market Volume (Units) Forecast by Application, 2019 to 2034

Table 59: South Asia and Pacific Market Value (US$ Million) Forecast by End User, 2019 to 2034

Table 60: South Asia and Pacific Market Volume (Units) Forecast by End User, 2019 to 2034

Table 61: East Asia Market Value (US$ Million) Forecast by Country, 2019 to 2034

Table 62: East Asia Market Volume (Units) Forecast by Country, 2019 to 2034

Table 63: East Asia Market Value (US$ Million) Forecast by Type, 2019 to 2034

Table 64: East Asia Market Volume (Units) Forecast by Type, 2019 to 2034

Table 65: East Asia Market Value (US$ Million) Forecast by Product Type, 2019 to 2034

Table 66: East Asia Market Volume (Units) Forecast by Product Type, 2019 to 2034

Table 67: East Asia Market Value (US$ Million) Forecast by Application, 2019 to 2034

Table 68: East Asia Market Volume (Units) Forecast by Application, 2019 to 2034

Table 69: East Asia Market Value (US$ Million) Forecast by End User, 2019 to 2034

Table 70: East Asia Market Volume (Units) Forecast by End User, 2019 to 2034

Table 71: Middle East and Africa Market Value (US$ Million) Forecast by Country, 2019 to 2034

Table 72: Middle East and Africa Market Volume (Units) Forecast by Country, 2019 to 2034

Table 73: Middle East and Africa Market Value (US$ Million) Forecast by Type, 2019 to 2034

Table 74: Middle East and Africa Market Volume (Units) Forecast by Type, 2019 to 2034

Table 75: Middle East and Africa Market Value (US$ Million) Forecast by Product Type, 2019 to 2034

Table 76: Middle East and Africa Market Volume (Units) Forecast by Product Type, 2019 to 2034

Table 77: Middle East and Africa Market Value (US$ Million) Forecast by Application, 2019 to 2034

Table 78: Middle East and Africa Market Volume (Units) Forecast by Application, 2019 to 2034

Table 79: Middle East and Africa Market Value (US$ Million) Forecast by End User, 2019 to 2034

Table 80: Middle East and Africa Market Volume (Units) Forecast by End User, 2019 to 2034

List of Charts

Figure 1: Global Market Value (US$ Million) by Type, 2024 to 2034

Figure 2: Global Market Value (US$ Million) by Product Type, 2024 to 2034

Figure 3: Global Market Value (US$ Million) by Application, 2024 to 2034

Figure 4: Global Market Value (US$ Million) by End User, 2024 to 2034

Figure 5: Global Market Value (US$ Million) by Region, 2024 to 2034

Figure 6: Global Market Value (US$ Million) Analysis by Region, 2019 to 2034

Figure 7: Global Market Volume (Units) Analysis by Region, 2019 to 2034

Figure 8: Global Market Value Share (%) and BPS Analysis by Region, 2024 to 2034

Figure 9: Global Market Y-o-Y Growth (%) Projections by Region, 2024 to 2034

Figure 10: Global Market Value (US$ Million) Analysis by Type, 2019 to 2034

Figure 11: Global Market Volume (Units) Analysis by Type, 2019 to 2034

Figure 12: Global Market Value Share (%) and BPS Analysis by Type, 2024 to 2034

Figure 13: Global Market Y-o-Y Growth (%) Projections by Type, 2024 to 2034

Figure 14: Global Market Value (US$ Million) Analysis by Product Type, 2019 to 2034

Figure 15: Global Market Volume (Units) Analysis by Product Type, 2019 to 2034

Figure 16: Global Market Value Share (%) and BPS Analysis by Product Type, 2024 to 2034

Figure 17: Global Market Y-o-Y Growth (%) Projections by Product Type, 2024 to 2034

Figure 18: Global Market Value (US$ Million) Analysis by Application, 2019 to 2034

Figure 19: Global Market Volume (Units) Analysis by Application, 2019 to 2034

Figure 20: Global Market Value Share (%) and BPS Analysis by Application, 2024 to 2034

Figure 21: Global Market Y-o-Y Growth (%) Projections by Application, 2024 to 2034

Figure 22: Global Market Value (US$ Million) Analysis by End User, 2019 to 2034

Figure 23: Global Market Volume (Units) Analysis by End User, 2019 to 2034

Figure 24: Global Market Value Share (%) and BPS Analysis by End User, 2024 to 2034

Figure 25: Global Market Y-o-Y Growth (%) Projections by End User, 2024 to 2034

Figure 26: Global Market Attractiveness by Type, 2024 to 2034

Figure 27: Global Market Attractiveness by Product Type, 2024 to 2034

Figure 28: Global Market Attractiveness by Application, 2024 to 2034

Figure 29: Global Market Attractiveness by End User, 2024 to 2034

Figure 30: Global Market Attractiveness by Region, 2024 to 2034

Figure 31: North America Market Value (US$ Million) by Type, 2024 to 2034

Figure 32: North America Market Value (US$ Million) by Product Type, 2024 to 2034

Figure 33: North America Market Value (US$ Million) by Application, 2024 to 2034

Figure 34: North America Market Value (US$ Million) by End User, 2024 to 2034

Figure 35: North America Market Value (US$ Million) by Country, 2024 to 2034

Figure 36: North America Market Value (US$ Million) Analysis by Country, 2019 to 2034

Figure 37: North America Market Volume (Units) Analysis by Country, 2019 to 2034

Figure 38: North America Market Value Share (%) and BPS Analysis by Country, 2024 to 2034

Figure 39: North America Market Y-o-Y Growth (%) Projections by Country, 2024 to 2034

Figure 40: North America Market Value (US$ Million) Analysis by Type, 2019 to 2034

Figure 41: North America Market Volume (Units) Analysis by Type, 2019 to 2034

Figure 42: North America Market Value Share (%) and BPS Analysis by Type, 2024 to 2034

Figure 43: North America Market Y-o-Y Growth (%) Projections by Type, 2024 to 2034

Figure 44: North America Market Value (US$ Million) Analysis by Product Type, 2019 to 2034

Figure 45: North America Market Volume (Units) Analysis by Product Type, 2019 to 2034

Figure 46: North America Market Value Share (%) and BPS Analysis by Product Type, 2024 to 2034

Figure 47: North America Market Y-o-Y Growth (%) Projections by Product Type, 2024 to 2034

Figure 48: North America Market Value (US$ Million) Analysis by Application, 2019 to 2034

Figure 49: North America Market Volume (Units) Analysis by Application, 2019 to 2034

Figure 50: North America Market Value Share (%) and BPS Analysis by Application, 2024 to 2034

Figure 51: North America Market Y-o-Y Growth (%) Projections by Application, 2024 to 2034

Figure 52: North America Market Value (US$ Million) Analysis by End User, 2019 to 2034

Figure 53: North America Market Volume (Units) Analysis by End User, 2019 to 2034

Figure 54: North America Market Value Share (%) and BPS Analysis by End User, 2024 to 2034

Figure 55: North America Market Y-o-Y Growth (%) Projections by End User, 2024 to 2034

Figure 56: North America Market Attractiveness by Type, 2024 to 2034

Figure 57: North America Market Attractiveness by Product Type, 2024 to 2034

Figure 58: North America Market Attractiveness by Application, 2024 to 2034

Figure 59: North America Market Attractiveness by End User, 2024 to 2034

Figure 60: North America Market Attractiveness by Country, 2024 to 2034

Figure 61: Latin America Market Value (US$ Million) by Type, 2024 to 2034

Figure 62: Latin America Market Value (US$ Million) by Product Type, 2024 to 2034

Figure 63: Latin America Market Value (US$ Million) by Application, 2024 to 2034

Figure 64: Latin America Market Value (US$ Million) by End User, 2024 to 2034

Figure 65: Latin America Market Value (US$ Million) by Country, 2024 to 2034

Figure 66: Latin America Market Value (US$ Million) Analysis by Country, 2019 to 2034

Figure 67: Latin America Market Volume (Units) Analysis by Country, 2019 to 2034

Figure 68: Latin America Market Value Share (%) and BPS Analysis by Country, 2024 to 2034

Figure 69: Latin America Market Y-o-Y Growth (%) Projections by Country, 2024 to 2034

Figure 70: Latin America Market Value (US$ Million) Analysis by Type, 2019 to 2034

Figure 71: Latin America Market Volume (Units) Analysis by Type, 2019 to 2034

Figure 72: Latin America Market Value Share (%) and BPS Analysis by Type, 2024 to 2034

Figure 73: Latin America Market Y-o-Y Growth (%) Projections by Type, 2024 to 2034

Figure 74: Latin America Market Value (US$ Million) Analysis by Product Type, 2019 to 2034

Figure 75: Latin America Market Volume (Units) Analysis by Product Type, 2019 to 2034

Figure 76: Latin America Market Value Share (%) and BPS Analysis by Product Type, 2024 to 2034

Figure 77: Latin America Market Y-o-Y Growth (%) Projections by Product Type, 2024 to 2034

Figure 78: Latin America Market Value (US$ Million) Analysis by Application, 2019 to 2034

Figure 79: Latin America Market Volume (Units) Analysis by Application, 2019 to 2034

Figure 80: Latin America Market Value Share (%) and BPS Analysis by Application, 2024 to 2034

Figure 81: Latin America Market Y-o-Y Growth (%) Projections by Application, 2024 to 2034

Figure 82: Latin America Market Value (US$ Million) Analysis by End User, 2019 to 2034

Figure 83: Latin America Market Volume (Units) Analysis by End User, 2019 to 2034

Figure 84: Latin America Market Value Share (%) and BPS Analysis by End User, 2024 to 2034

Figure 85: Latin America Market Y-o-Y Growth (%) Projections by End User, 2024 to 2034

Figure 86: Latin America Market Attractiveness by Type, 2024 to 2034

Figure 87: Latin America Market Attractiveness by Product Type, 2024 to 2034

Figure 88: Latin America Market Attractiveness by Application, 2024 to 2034

Figure 89: Latin America Market Attractiveness by End User, 2024 to 2034

Figure 90: Latin America Market Attractiveness by Country, 2024 to 2034

Figure 91: Western Europe Market Value (US$ Million) by Type, 2024 to 2034

Figure 92: Western Europe Market Value (US$ Million) by Product Type, 2024 to 2034

Figure 93: Western Europe Market Value (US$ Million) by Application, 2024 to 2034

Figure 94: Western Europe Market Value (US$ Million) by End User, 2024 to 2034

Figure 95: Western Europe Market Value (US$ Million) by Country, 2024 to 2034

Figure 96: Western Europe Market Value (US$ Million) Analysis by Country, 2019 to 2034

Figure 97: Western Europe Market Volume (Units) Analysis by Country, 2019 to 2034

Figure 98: Western Europe Market Value Share (%) and BPS Analysis by Country, 2024 to 2034

Figure 99: Western Europe Market Y-o-Y Growth (%) Projections by Country, 2024 to 2034

Figure 100: Western Europe Market Value (US$ Million) Analysis by Type, 2019 to 2034

Figure 101: Western Europe Market Volume (Units) Analysis by Type, 2019 to 2034

Figure 102: Western Europe Market Value Share (%) and BPS Analysis by Type, 2024 to 2034

Figure 103: Western Europe Market Y-o-Y Growth (%) Projections by Type, 2024 to 2034

Figure 104: Western Europe Market Value (US$ Million) Analysis by Product Type, 2019 to 2034

Figure 105: Western Europe Market Volume (Units) Analysis by Product Type, 2019 to 2034

Figure 106: Western Europe Market Value Share (%) and BPS Analysis by Product Type, 2024 to 2034

Figure 107: Western Europe Market Y-o-Y Growth (%) Projections by Product Type, 2024 to 2034

Figure 108: Western Europe Market Value (US$ Million) Analysis by Application, 2019 to 2034

Figure 109: Western Europe Market Volume (Units) Analysis by Application, 2019 to 2034

Figure 110: Western Europe Market Value Share (%) and BPS Analysis by Application, 2024 to 2034

Figure 111: Western Europe Market Y-o-Y Growth (%) Projections by Application, 2024 to 2034

Figure 112: Western Europe Market Value (US$ Million) Analysis by End User, 2019 to 2034

Figure 113: Western Europe Market Volume (Units) Analysis by End User, 2019 to 2034

Figure 114: Western Europe Market Value Share (%) and BPS Analysis by End User, 2024 to 2034

Figure 115: Western Europe Market Y-o-Y Growth (%) Projections by End User, 2024 to 2034

Figure 116: Western Europe Market Attractiveness by Type, 2024 to 2034

Figure 117: Western Europe Market Attractiveness by Product Type, 2024 to 2034

Figure 118: Western Europe Market Attractiveness by Application, 2024 to 2034

Figure 119: Western Europe Market Attractiveness by End User, 2024 to 2034

Figure 120: Western Europe Market Attractiveness by Country, 2024 to 2034

Figure 121: Eastern Europe Market Value (US$ Million) by Type, 2024 to 2034

Figure 122: Eastern Europe Market Value (US$ Million) by Product Type, 2024 to 2034

Figure 123: Eastern Europe Market Value (US$ Million) by Application, 2024 to 2034

Figure 124: Eastern Europe Market Value (US$ Million) by End User, 2024 to 2034

Figure 125: Eastern Europe Market Value (US$ Million) by Country, 2024 to 2034

Figure 126: Eastern Europe Market Value (US$ Million) Analysis by Country, 2019 to 2034

Figure 127: Eastern Europe Market Volume (Units) Analysis by Country, 2019 to 2034

Figure 128: Eastern Europe Market Value Share (%) and BPS Analysis by Country, 2024 to 2034

Figure 129: Eastern Europe Market Y-o-Y Growth (%) Projections by Country, 2024 to 2034

Figure 130: Eastern Europe Market Value (US$ Million) Analysis by Type, 2019 to 2034

Figure 131: Eastern Europe Market Volume (Units) Analysis by Type, 2019 to 2034

Figure 132: Eastern Europe Market Value Share (%) and BPS Analysis by Type, 2024 to 2034

Figure 133: Eastern Europe Market Y-o-Y Growth (%) Projections by Type, 2024 to 2034

Figure 134: Eastern Europe Market Value (US$ Million) Analysis by Product Type, 2019 to 2034

Figure 135: Eastern Europe Market Volume (Units) Analysis by Product Type, 2019 to 2034

Figure 136: Eastern Europe Market Value Share (%) and BPS Analysis by Product Type, 2024 to 2034

Figure 137: Eastern Europe Market Y-o-Y Growth (%) Projections by Product Type, 2024 to 2034

Figure 138: Eastern Europe Market Value (US$ Million) Analysis by Application, 2019 to 2034

Figure 139: Eastern Europe Market Volume (Units) Analysis by Application, 2019 to 2034

Figure 140: Eastern Europe Market Value Share (%) and BPS Analysis by Application, 2024 to 2034

Figure 141: Eastern Europe Market Y-o-Y Growth (%) Projections by Application, 2024 to 2034

Figure 142: Eastern Europe Market Value (US$ Million) Analysis by End User, 2019 to 2034

Figure 143: Eastern Europe Market Volume (Units) Analysis by End User, 2019 to 2034

Figure 144: Eastern Europe Market Value Share (%) and BPS Analysis by End User, 2024 to 2034

Figure 145: Eastern Europe Market Y-o-Y Growth (%) Projections by End User, 2024 to 2034

Figure 146: Eastern Europe Market Attractiveness by Type, 2024 to 2034

Figure 147: Eastern Europe Market Attractiveness by Product Type, 2024 to 2034

Figure 148: Eastern Europe Market Attractiveness by Application, 2024 to 2034

Figure 149: Eastern Europe Market Attractiveness by End User, 2024 to 2034

Figure 150: Eastern Europe Market Attractiveness by Country, 2024 to 2034

Figure 151: South Asia and Pacific Market Value (US$ Million) by Type, 2024 to 2034

Figure 152: South Asia and Pacific Market Value (US$ Million) by Product Type, 2024 to 2034

Figure 153: South Asia and Pacific Market Value (US$ Million) by Application, 2024 to 2034

Figure 154: South Asia and Pacific Market Value (US$ Million) by End User, 2024 to 2034

Figure 155: South Asia and Pacific Market Value (US$ Million) by Country, 2024 to 2034

Figure 156: South Asia and Pacific Market Value (US$ Million) Analysis by Country, 2019 to 2034

Figure 157: South Asia and Pacific Market Volume (Units) Analysis by Country, 2019 to 2034

Figure 158: South Asia and Pacific Market Value Share (%) and BPS Analysis by Country, 2024 to 2034

Figure 159: South Asia and Pacific Market Y-o-Y Growth (%) Projections by Country, 2024 to 2034

Figure 160: South Asia and Pacific Market Value (US$ Million) Analysis by Type, 2019 to 2034

Figure 161: South Asia and Pacific Market Volume (Units) Analysis by Type, 2019 to 2034

Figure 162: South Asia and Pacific Market Value Share (%) and BPS Analysis by Type, 2024 to 2034

Figure 163: South Asia and Pacific Market Y-o-Y Growth (%) Projections by Type, 2024 to 2034

Figure 164: South Asia and Pacific Market Value (US$ Million) Analysis by Product Type, 2019 to 2034

Figure 165: South Asia and Pacific Market Volume (Units) Analysis by Product Type, 2019 to 2034

Figure 166: South Asia and Pacific Market Value Share (%) and BPS Analysis by Product Type, 2024 to 2034

Figure 167: South Asia and Pacific Market Y-o-Y Growth (%) Projections by Product Type, 2024 to 2034

Figure 168: South Asia and Pacific Market Value (US$ Million) Analysis by Application, 2019 to 2034

Figure 169: South Asia and Pacific Market Volume (Units) Analysis by Application, 2019 to 2034

Figure 170: South Asia and Pacific Market Value Share (%) and BPS Analysis by Application, 2024 to 2034

Figure 171: South Asia and Pacific Market Y-o-Y Growth (%) Projections by Application, 2024 to 2034

Figure 172: South Asia and Pacific Market Value (US$ Million) Analysis by End User, 2019 to 2034

Figure 173: South Asia and Pacific Market Volume (Units) Analysis by End User, 2019 to 2034

Figure 174: South Asia and Pacific Market Value Share (%) and BPS Analysis by End User, 2024 to 2034

Figure 175: South Asia and Pacific Market Y-o-Y Growth (%) Projections by End User, 2024 to 2034

Figure 176: South Asia and Pacific Market Attractiveness by Type, 2024 to 2034

Figure 177: South Asia and Pacific Market Attractiveness by Product Type, 2024 to 2034

Figure 178: South Asia and Pacific Market Attractiveness by Application, 2024 to 2034

Figure 179: South Asia and Pacific Market Attractiveness by End User, 2024 to 2034

Figure 180: South Asia and Pacific Market Attractiveness by Country, 2024 to 2034

Figure 181: East Asia Market Value (US$ Million) by Type, 2024 to 2034

Figure 182: East Asia Market Value (US$ Million) by Product Type, 2024 to 2034

Figure 183: East Asia Market Value (US$ Million) by Application, 2024 to 2034

Figure 184: East Asia Market Value (US$ Million) by End User, 2024 to 2034

Figure 185: East Asia Market Value (US$ Million) by Country, 2024 to 2034

Figure 186: East Asia Market Value (US$ Million) Analysis by Country, 2019 to 2034

Figure 187: East Asia Market Volume (Units) Analysis by Country, 2019 to 2034

Figure 188: East Asia Market Value Share (%) and BPS Analysis by Country, 2024 to 2034

Figure 189: East Asia Market Y-o-Y Growth (%) Projections by Country, 2024 to 2034

Figure 190: East Asia Market Value (US$ Million) Analysis by Type, 2019 to 2034

Figure 191: East Asia Market Volume (Units) Analysis by Type, 2019 to 2034

Figure 192: East Asia Market Value Share (%) and BPS Analysis by Type, 2024 to 2034

Figure 193: East Asia Market Y-o-Y Growth (%) Projections by Type, 2024 to 2034

Figure 194: East Asia Market Value (US$ Million) Analysis by Product Type, 2019 to 2034

Figure 195: East Asia Market Volume (Units) Analysis by Product Type, 2019 to 2034

Figure 196: East Asia Market Value Share (%) and BPS Analysis by Product Type, 2024 to 2034

Figure 197: East Asia Market Y-o-Y Growth (%) Projections by Product Type, 2024 to 2034

Figure 198: East Asia Market Value (US$ Million) Analysis by Application, 2019 to 2034

Figure 199: East Asia Market Volume (Units) Analysis by Application, 2019 to 2034

Figure 200: East Asia Market Value Share (%) and BPS Analysis by Application, 2024 to 2034

Figure 201: East Asia Market Y-o-Y Growth (%) Projections by Application, 2024 to 2034

Figure 202: East Asia Market Value (US$ Million) Analysis by End User, 2019 to 2034

Figure 203: East Asia Market Volume (Units) Analysis by End User, 2019 to 2034

Figure 204: East Asia Market Value Share (%) and BPS Analysis by End User, 2024 to 2034

Figure 205: East Asia Market Y-o-Y Growth (%) Projections by End User, 2024 to 2034

Figure 206: East Asia Market Attractiveness by Type, 2024 to 2034

Figure 207: East Asia Market Attractiveness by Product Type, 2024 to 2034

Figure 208: East Asia Market Attractiveness by Application, 2024 to 2034

Figure 209: East Asia Market Attractiveness by End User, 2024 to 2034

Figure 210: East Asia Market Attractiveness by Country, 2024 to 2034

Figure 211: Middle East and Africa Market Value (US$ Million) by Type, 2024 to 2034

Figure 212: Middle East and Africa Market Value (US$ Million) by Product Type, 2024 to 2034

Figure 213: Middle East and Africa Market Value (US$ Million) by Application, 2024 to 2034

Figure 214: Middle East and Africa Market Value (US$ Million) by End User, 2024 to 2034

Figure 215: Middle East and Africa Market Value (US$ Million) by Country, 2024 to 2034

Figure 216: Middle East and Africa Market Value (US$ Million) Analysis by Country, 2019 to 2034

Figure 217: Middle East and Africa Market Volume (Units) Analysis by Country, 2019 to 2034

Figure 218: Middle East and Africa Market Value Share (%) and BPS Analysis by Country, 2024 to 2034

Figure 219: Middle East and Africa Market Y-o-Y Growth (%) Projections by Country, 2024 to 2034

Figure 220: Middle East and Africa Market Value (US$ Million) Analysis by Type, 2019 to 2034

Figure 221: Middle East and Africa Market Volume (Units) Analysis by Type, 2019 to 2034

Figure 222: Middle East and Africa Market Value Share (%) and BPS Analysis by Type, 2024 to 2034

Figure 223: Middle East and Africa Market Y-o-Y Growth (%) Projections by Type, 2024 to 2034

Figure 224: Middle East and Africa Market Value (US$ Million) Analysis by Product Type, 2019 to 2034

Figure 225: Middle East and Africa Market Volume (Units) Analysis by Product Type, 2019 to 2034

Figure 226: Middle East and Africa Market Value Share (%) and BPS Analysis by Product Type, 2024 to 2034

Figure 227: Middle East and Africa Market Y-o-Y Growth (%) Projections by Product Type, 2024 to 2034

Figure 228: Middle East and Africa Market Value (US$ Million) Analysis by Application, 2019 to 2034

Figure 229: Middle East and Africa Market Volume (Units) Analysis by Application, 2019 to 2034

Figure 230: Middle East and Africa Market Value Share (%) and BPS Analysis by Application, 2024 to 2034

Figure 231: Middle East and Africa Market Y-o-Y Growth (%) Projections by Application, 2024 to 2034

Figure 232: Middle East and Africa Market Value (US$ Million) Analysis by End User, 2019 to 2034

Figure 233: Middle East and Africa Market Volume (Units) Analysis by End User, 2019 to 2034

Figure 234: Middle East and Africa Market Value Share (%) and BPS Analysis by End User, 2024 to 2034

Figure 235: Middle East and Africa Market Y-o-Y Growth (%) Projections by End User, 2024 to 2034

Figure 236: Middle East and Africa Market Attractiveness by Type, 2024 to 2034

Figure 237: Middle East and Africa Market Attractiveness by Product Type, 2024 to 2034

Figure 238: Middle East and Africa Market Attractiveness by Application, 2024 to 2034

Figure 239: Middle East and Africa Market Attractiveness by End User, 2024 to 2034

Figure 240: Middle East and Africa Market Attractiveness by Country, 2024 to 2034

Recommendations

Industrial Automation

Motor Generator Set Market

Published : July 2023

Industrial Automation

Low Voltage Motor Market

Published : June 2022

Explore Industrial Automation Insights

View Reports

Energy Efficient Motor Market